Market Overview
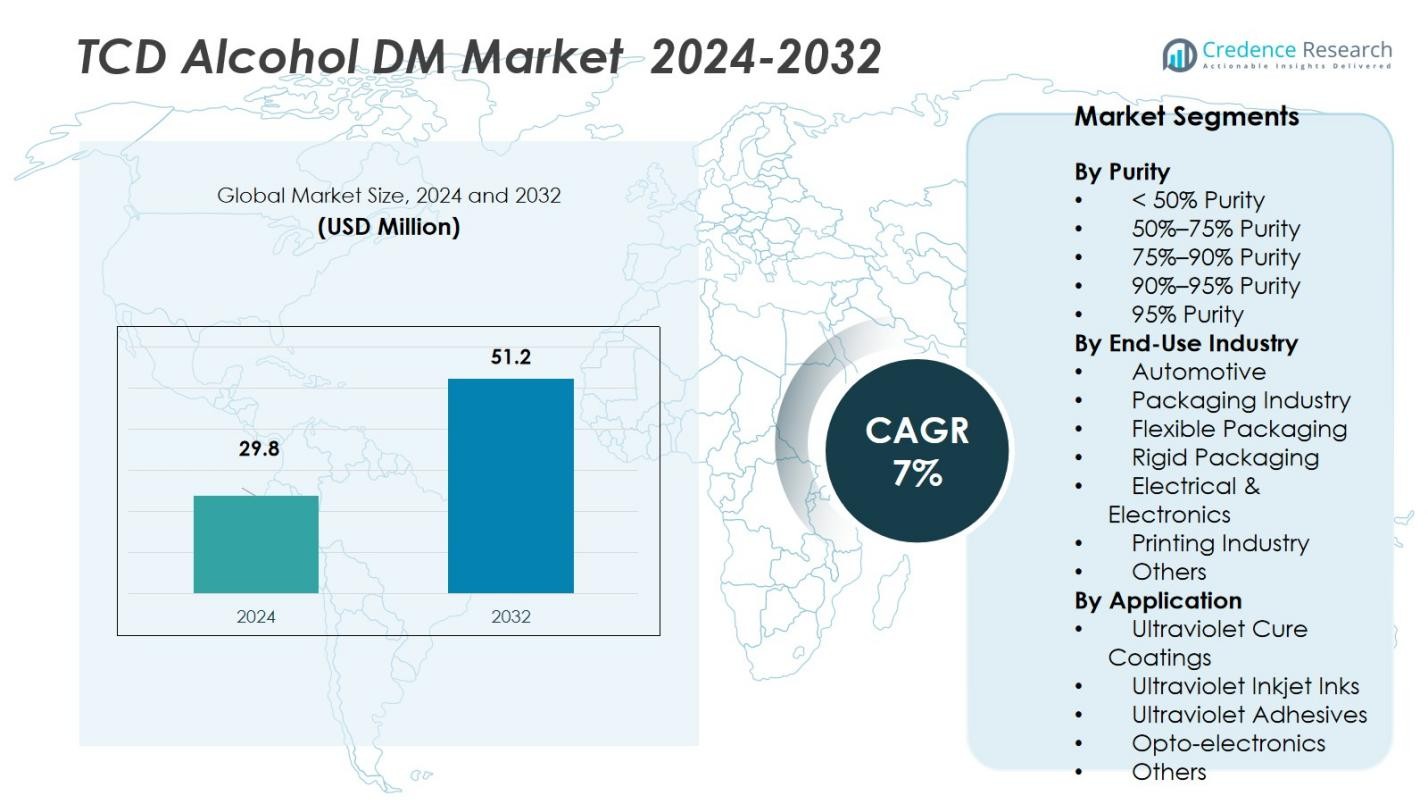
The TCD Alcohol DM Market size was valued at USD 29.8 million in 2024 and is anticipated to reach USD 51.2 million by 2032, at a CAGR of 7% during the forecast period.
| REPORT ATTRIBUTE |
DETAILS |
| Historical Period |
2020-2023 |
| Base Year |
2024 |
| Forecast Period |
2025-2032 |
| TCD Alcohol DM Market Size 2024 |
USD 29.8 Million |
| TCD Alcohol DM Market, CAGR |
7% |
| TCD Alcohol DM Market Size 2032 |
USD 51.2 Million |
The TCD Alcohol DM Market is led by major players including BASF SE, Eastman Chemical Company, Mil-Spec Industries Corporation, Ernesto Ventós S.A., Synchem Inc., Oxea Chemicals, and Tokyo Chemical Industry Co. Ltd. These companies dominate through strategic initiatives such as capacity expansion, technological innovations, and product development. The Asia Pacific region holds the largest market share, accounting for 35% of the global TCD Alcohol DM Market. This dominance is driven by rapid industrialization and growing demand in key sectors like automotive, packaging, and electronics, particularly in China, India, and Japan. The region’s strong infrastructure, coupled with the increasing adoption of UV-curable technologies, positions it as the leading market for TCD Alcohol DM. As manufacturing capabilities expand and new applications emerge, Asia Pacific is expected to continue driving the market’s growth in the coming years.
Access crucial information at unmatched prices!
Request your sample report today & start making informed decisions powered by Credence Research Inc.!
Download Sample
Market Insights
- The TCD Alcohol DM Market size was valued at USD 29.8 million in 2024 and is projected to reach USD 51.2 million by 2032, growing at a CAGR of 7% during the forecast period.
- The automotive industry is the dominant end-use segment, holding 40% of the market share, driven by the demand for advanced coatings and adhesives.
- Asia Pacific leads the market with a 35% share, driven by high industrial growth and adoption of UV-curable coatings and adhesives in automotive, packaging, and electronics.
- The increasing adoption of UV curing technology is a key driver, as it offers energy efficiency and faster curing times, particularly in coatings and adhesives.
- The main challenge in the market is raw material price volatility, which can disrupt manufacturing costs and supply chain stability, affecting profitability and pricing strategies.
Market Segmentation Analysis:
By Purity:
The TCD Alcohol DM market is segmented by purity levels, with the 95% purity sub-segment holding the dominant market share of 35%. This segment is preferred for its high concentration and effectiveness in various applications, particularly in coatings and adhesives. The 95% purity segment benefits from increasing demand in industries requiring high-performance materials. It commands a significant share of the market due to its optimal balance between cost-effectiveness and quality. As demand for high-quality products grows, this segment is expected to maintain its leading position, driven by innovations in manufacturing and improved supply chain efficiency.
- For instance, OQ Chemicals has launched Oxbalance TCD Alcohol DM, emphasizing its use in high-performance technical polymers, paints, and coatings that demand superior durability and scratch resistance.
By End-Use Industry:
The Automotive industry is the dominant sub-segment within the end-use category, accounting for 40% of the market share. TCD Alcohol DM is widely used in automotive coatings and adhesives, enhancing product durability and performance. The growth of the automotive sector, particularly in regions experiencing a boom in electric vehicle manufacturing, drives the demand for advanced chemical solutions. The automotive segment’s reliance on TCD Alcohol DM for its strong bonding properties and long-lasting effects ensures its continued dominance in the market.
- For instance, companies like Ernesto Ventós S.A. distribute TCD Alcohol DM formulations that contribute to high-performance finishes on automotive parts, combining optical clarity and resistance to yellowing, which supports long-lasting vehicle aesthetics and durability.
By Application:
Within the application segment, Ultraviolet Cure Coatings is the leading sub-segment, holding a substantial share of 45% of the market. This is due to the growing demand for UV-cured coatings, which offer faster curing times, lower energy consumption, and enhanced product durability. The increasing adoption of UV technology in various industries such as packaging, automotive, and electronics boosts the demand for TCD Alcohol DM in this application. As more industries focus on sustainability and energy efficiency, the UV Cure Coatings sub-segment is poised to expand its market share further.
Key Growth Drivers
Rising Demand in Coatings and Adhesives
The increasing demand for TCD Alcohol DM in coatings and adhesives is a significant driver for market growth. TCD Alcohol DM’s superior properties, such as its fast curing time and enhanced durability, make it an ideal ingredient in UV cure coatings and adhesives used in various industries. As demand for advanced coatings and adhesives grows, particularly in packaging, automotive, and electronics, TCD Alcohol DM plays a crucial role in providing high-performance solutions. This trend is expected to fuel the market’s expansion in the coming years.
- For instance, in the packaging sector, TCD Alcohol DM-based UV coatings enable fast-curing overprint varnishes and laminating adhesives that support high-speed production lines, as demonstrated by Guangdong CPD-Chem New Material Technology.
Expanding Automotive Sector
The growth of the automotive industry, particularly with the rise in electric vehicles (EVs), is driving demand for TCD Alcohol DM. Automotive manufacturers increasingly rely on high-performance coatings, adhesives, and sealants to meet the growing need for lightweight, durable, and environmentally-friendly materials. TCD Alcohol DM, known for its exceptional bonding strength and resistance to heat and chemicals, is a key component in these applications. As the automotive sector continues to expand globally, TCD Alcohol DM’s market position is expected to strengthen significantly.
- For instance, Henkel has developed structural adhesives using TCD Alcohol DM-based formulations, which have been used to replace traditional welding in vehicle cabins, resulting in lighter vehicles and up to 42% lower CO2 emissions in multipurpose vehicle designs.
Growth in UV Curing Applications
The increasing adoption of UV curing technology is a major growth driver for the TCD Alcohol DM market. UV-curing systems are being widely used across industries due to their efficiency, energy-saving benefits, and minimal environmental impact. TCD Alcohol DM’s ability to enhance the performance of UV inks, coatings, and adhesives makes it a preferred choice in these applications. As more industries, including packaging and printing, adopt UV curing for faster and more sustainable production, the demand for TCD Alcohol DM is expected to increase.
Key Trends & Opportunities
Shift Towards Sustainable Solutions
A key trend in the TCD Alcohol DM market is the growing demand for sustainable and eco-friendly chemical solutions. As companies increasingly focus on reducing their environmental impact, there is a strong push for renewable and low-emission chemicals in manufacturing processes. TCD Alcohol DM is gaining attention for its ability to reduce energy consumption in curing processes and its lower toxicity compared to traditional alternatives. This sustainability trend opens up significant opportunities for market players to innovate and capture a broader customer base seeking greener solutions.
- For instance, OQ Chemicals launched Oxbalance TCD Alcohol DM, a bio-based product designed to offer a sustainable alternative with reduced emissions and environmental impact.
Technological Advancements in UV-Curing Systems
Ongoing technological advancements in UV curing systems present significant opportunities for the TCD Alcohol DM market. New developments in UV LED curing technology, which offer faster curing speeds and more energy-efficient systems, are expected to increase the demand for high-performance chemical ingredients. TCD Alcohol DM, known for its compatibility with UV curing systems, stands to benefit from these innovations. As industries seek faster, more efficient, and sustainable production methods, TCD Alcohol DM is well-positioned to capitalize on this trend.
- For instance, Excelitas Technologies Corporation recently introduced a UV LED curing system (Generation 8) that improves irradiance by 20% via a new three‑part reflector assembly, enabling faster process speeds in fiber and wire coating applications.
Key Challenges
Raw Material Price Volatility
One of the key challenges facing the TCD Alcohol DM market is the volatility in raw material prices. The cost of key ingredients used in the production of TCD Alcohol DM can fluctuate due to supply chain disruptions or changes in the prices of petrochemical-based products. This volatility can affect manufacturers’ ability to maintain consistent pricing and margins, impacting their profitability. Companies must develop strategies to mitigate the impact of these price fluctuations, such as securing long-term supply contracts or exploring alternative raw materials.
Regulatory Compliance and Environmental Standards
The TCD Alcohol DM market is also challenged by the increasing complexity of regulatory compliance and environmental standards. As governments around the world tighten regulations on chemical products, manufacturers are faced with higher compliance costs and the need for constant innovation to meet environmental standards. These regulations can add significant pressure to production timelines and increase the cost of research and development. Market participants must stay ahead of regulatory changes and adapt their processes to remain competitive while meeting sustainability criteria.
Regional Analysis
North America
The North American region holds a market share of around 18% in the TCD Alcohol DM market and displays steady growth driven by advanced manufacturing and chemicals industries. The region benefits from strong demand in automotive coatings, electronics and printing sectors, where UV‑curable coatings are increasingly adopted. Robust regulatory frameworks and high adoption of high‑performance materials support share expansion. Supply chain improvements and strategic partnerships further strengthen market footing. However, mature market conditions keep incremental growth modest compared to emerging regions.
Europe
Europe commands roughly 22% of the global TCD Alcohol DM market share, led by Western Europe’s strong specialty chemical base and printing industry infrastructure. The region’s advanced UV inkjet printing and commercial printing sectors drive demand for this compound in adhesives and coatings. Additionally, rigorous environmental standards encourage adoption of high‑performance, low‑VOC products, favouring this market. Despite the lead, slower industrial growth and high production costs temper future expansion. Emerging Eastern European markets contribute, but Europe’s overall growth remains moderate.
Asia Pacific
Asia Pacific emerges as the leading region with over 35% market share in the TCD Alcohol DM market. Rapid industrialisation, large automotive production hubs, and booming packaging and printing sectors in countries such as China, India and Japan fuel this dominance. Rising demand for UV‑curable coatings and adhesives in electronics and flexible packaging supports growth. Infrastructure investment and shift toward high‑performance materials accelerate uptake. The region’s growth potential remains high as emerging economies adopt advanced manufacturing practices.
Latin America
Latin America accounts for about 8% of the global TCD Alcohol DM market share, showing moderate growth opportunities. The region’s packaging, printing and automotive sectors are gradually adopting UV‑curable technologies, driving incremental demand for high‑performance chemicals. Economic variability, infrastructure gaps and less developed specialty chemical manufacturing limit share expansion. Still, regional initiatives to boost packaging and consumer goods production present a pathway for growth in the coming years as market awareness improves.
Middle East & Africa
The Middle East & Africa region holds approximately 7% of the global TCD Alcohol DM market share. Despite a smaller base, the region shows steady growth as petrochemical‑rich countries explore value‑added speciality chemical applications, including UV‑cure coatings and inks. Growth is supported by expanding construction, packaging and electronics sectors in Gulf Cooperation Council (GCC) countries. However, limited manufacturing infrastructure, higher import reliance and economic volatility present constraints. Strategic partnerships and local capacity building could enhance future share.
Market Segmentations:
By Purity
- < 50% Purity
- 50%–75% Purity
- 75%–90% Purity
- 90%–95% Purity
- 95% Purity
By End-Use Industry
- Automotive
- Packaging Industry
- Flexible Packaging
- Rigid Packaging
- Electrical & Electronics
- Printing Industry
- Others
By Application
- Ultraviolet Cure Coatings
- Ultraviolet Inkjet Inks
- Ultraviolet Adhesives
- Opto-electronics
- Others
By Region
- North America
- Europe
- Germany
- France
- U.K.
- Italy
- Spain
- Rest of Europe
- Asia Pacific
- China
- Japan
- India
- South Korea
- South-east Asia
- Rest of Asia Pacific
- Latin America
- Brazil
- Argentina
- Rest of Latin America
- Middle East & Africa
- GCC Countries
- South Africa
- Rest of the Middle East and Africa
Competitive Landscape
Competitive landscape or analysis: The competitive landscape of the TCD Alcohol DM market is primarily driven by key players such as Ernesto Ventós S.A., BASF SE, Eastman Chemical Company, and Mil-Spec Industries Corporation. These companies lead the market by focusing on capacity expansion, technological innovations, and strategic partnerships to enhance their market presence. The market is concentrated, with a few large players holding a significant share, accounting for approximately 85%-90% of the market. Companies continue to invest in advanced manufacturing processes and product development to differentiate themselves. While the market is restricted by factors like proprietary production methods and stringent regulatory requirements, emerging opportunities in applications like UV-curable coatings, adhesives, and opto-electronics are creating competitive advantages. This dynamic allows companies to explore new growth avenues and maintain their competitive edge in the global TCD Alcohol DM market.
Shape Your Report to Specific Countries or Regions & Enjoy 30% Off!
Key Player Analysis
- BASF SE
- Mil-Spec Industries Corporation
- Tokyo Chemical Industry Co. Ltd.
- Merck KGaA
- Ernesto Ventos S.A.
- Synchem Inc.
- Eastman Chemical Company
- Indukern F&F
- Oxea Chemicals
- ExxonMobil Chemical
Recent Developments
- In June 2023, OQ Chemicals launched OxBalance TCD Alcohol DM, a biobased alternative produced from over 70% bio/biocircular feedstocks, certified by ISCC PLUS.
- In February 2022, OQ Chemicals commissioned an expanded production facility at its Oberhausen site in Germany, aimed at increasing the global supply of TCD Alcohol DM.
Report Coverage
The research report offers an in-depth analysis based on Purity, End User Industry, Application and Region. It details leading market players, providing an overview of their business, product offerings, investments, revenue streams, and key applications. Additionally, the report includes insights into the competitive environment, SWOT analysis, current market trends, as well as the primary drivers and constraints. Furthermore, it discusses various factors that have driven market expansion in recent years. The report also explores market dynamics, regulatory scenarios, and technological advancements that are shaping the industry. It assesses the impact of external factors and global economic changes on market growth. Lastly, it provides strategic recommendations for new entrants and established companies to navigate the complexities of the market.
Future Outlook
- Demand will increase as industries adopt UV‑cured coatings and adhesives more widely.
- Growth will be supported by rising automotive production, particularly in EVs, driving specialty material needs.
- Adoption of high‑purity grades will deepen as performance requirements in electronics and optics escalate.
- Manufacturers will expand production capacity to address anticipated supply short‑falls and regional demand surges.
- Markets in Asia Pacific will lead growth due to emerging packaging, printing and electronics industries.
- Sustainability requirements will shift formulations toward low‑VOC and high‑durability solutions that incorporate TCD Alcohol DM.
- Small and mid‑sized chemical producers will explore backward integration as patents expire, altering supply dynamics.
- Technological innovation will unlock new applications in opto‑electronics, advanced coatings and high‑end printing.
- Price pressures may ease as scale increases and raw material sourcing becomes more efficient.
- Regulatory tightening around chemical safety and environmental impact will compel suppliers to enhance compliance and transparency.


