
Market Overview:
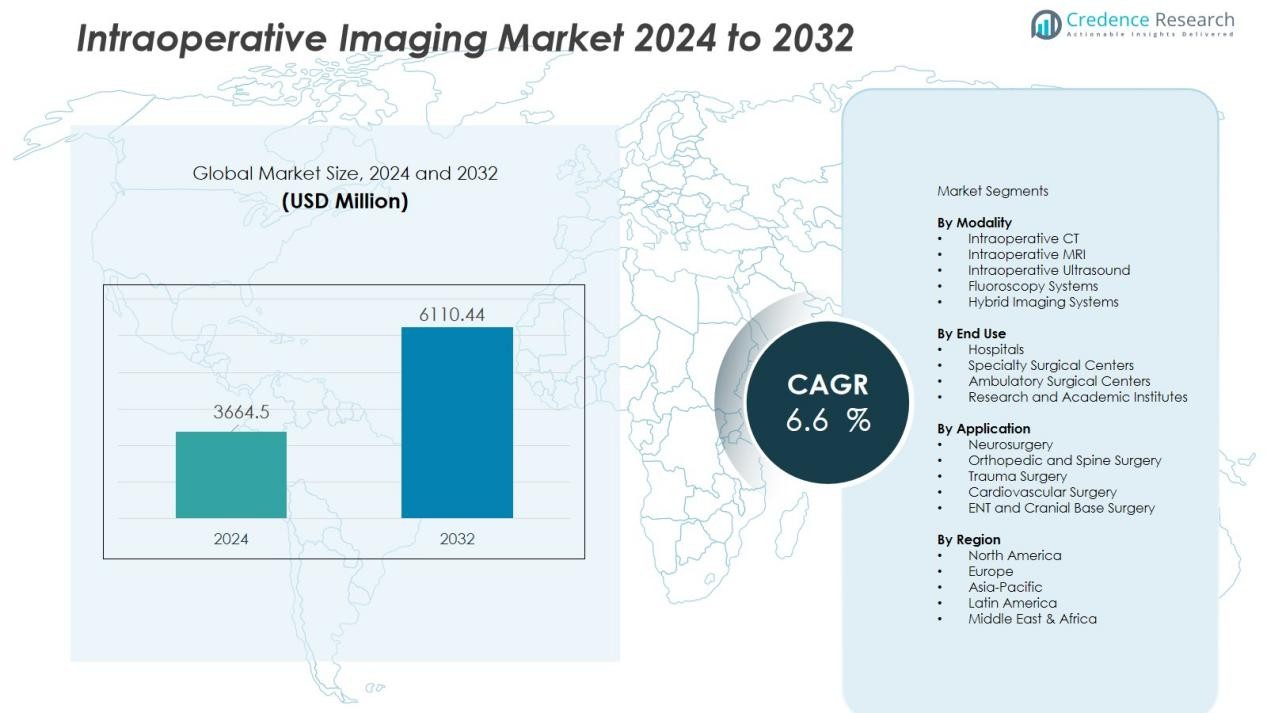
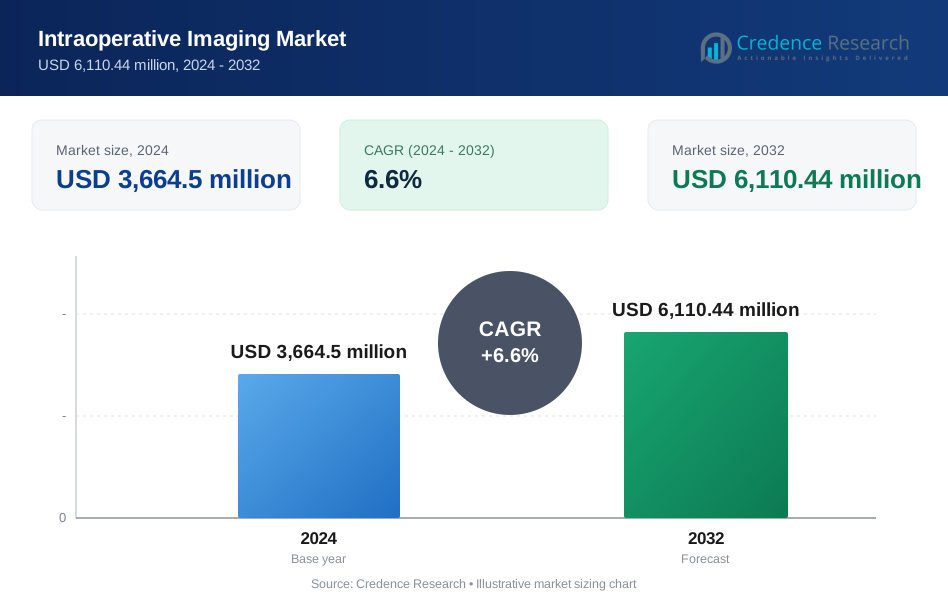
The intraoperative imaging market size was valued at USD 3664.5 million in 2024 and is anticipated to reach USD 6110.44 million by 2032, at a CAGR of 6.6 % during the forecast period.
| REPORT ATTRIBUTE | DETAILS |
|---|---|
| Historical Period | 2020-2023 |
| Base Year | 2024 |
| Forecast Period | 2025-2032 |
| Intraoperative Imaging Market Size 2024 | USD 3664.5 Million |
| Intraoperative Imaging Market, CAGR | 6.6 % |
| Intraoperative Imaging Market Size 2032 | USD 6110.44 Million |
Key market drivers revolve around technological enhancements and clinical needs. Surgeons increasingly rely on intraoperative CT, MRI, and ultrasound systems to improve navigation accuracy, reduce revision surgeries, and enhance patient outcomes. The shift toward hybrid operating rooms, combined with the integration of AI-enabled imaging platforms, strengthens decision-making precision. Growing prevalence of trauma, neurological disorders, and cardiovascular diseases further supports equipment adoption. Hospitals also invest in advanced imaging modalities to reduce procedural complications and align with value-based care requirements.
Regionally, North America maintains market leadership due to strong healthcare infrastructure, high surgical procedure volumes, and robust availability of advanced intraoperative imaging platforms. Europe follows with rising investments in hybrid ORs and favorable regulatory support for innovative imaging technologies. Asia-Pacific is poised for the fastest growth, supported by expanding healthcare modernization, increasing patient access to specialty surgeries, and growing hospital investments across China, India, and Southeast Asia.
Market Insights:
- The intraoperative imaging market is valued at USD 3664.5 million in 2024 and is projected to reach USD 6110.44 million by 2032, supported by a CAGR of 6.6% during the forecast period.
- Market expansion is driven by growing reliance on real-time CT, MRI, and ultrasound systems to enhance surgical precision, reduce revision procedures, and improve overall patient outcomes.
- Rising burden of neurological, orthopedic, and trauma cases boosts adoption of advanced imaging modalities that support accurate navigation, spine stabilization, and fracture reconstruction.
- Rapid integration of hybrid operating rooms and AI-enabled imaging platforms strengthens workflow efficiency, supports minimally invasive surgeries, and increases decision-making accuracy.
- North America leads the market due to strong surgical infrastructure, while Asia-Pacific records the fastest growth fueled by expanding healthcare modernization and increased hospital investments.
Market Drivers:
Rising Emphasis on Surgical Precision and Real-Time Visualization
The intraoperative imaging market gains strong traction due to the rising clinical focus on accuracy during complex procedures. Surgeons prefer systems that offer real-time anatomical visualization, which improves decision-making during critical stages of surgery. It reduces the risk of surgical revisions and enhances procedural safety. Hospitals adopt intraoperative MRI, CT, and advanced ultrasound platforms to support surgeon confidence and improve outcomes. Growing demand for minimally invasive surgeries continues to reinforce the requirement for dynamic imaging support.
- For Instance, Duke University's intraoperative optical coherence tomography (OCT) system is capable of achieving live 3D volumetric imaging at up to 10 volumes per second. In human surgeries using certain scan parameters, it operates at approximately 7 volumes per second.
Growing Burden of Neurological, Orthopedic, and Trauma Cases
The intraoperative imaging market benefits from the rising prevalence of neurological disorders, orthopedic injuries, and trauma cases that require precise intraoperative assessment. It supports complex interventions such as spine stabilization, neuro-navigation, and fracture reconstruction. Demand accelerates as healthcare providers focus on quality-of-care metrics and lower post-surgical complications. Advancements in navigation software, integrated imaging consoles, and motion-management systems further increase adoption. Hospitals aim to enhance treatment pathways for high-risk surgical segments.
- For instance, Medtronic's O-arm Imaging System combines high-quality CT imaging with automatic registration, reducing registration time significantly and enabling minimally invasive spine surgeries with enhanced accuracy.
Rapid Expansion of Hybrid Operating Rooms and Advanced Surgical Environments
The intraoperative imaging market advances due to rising investments in hybrid OR infrastructures. It supports multidisciplinary surgical workflows that require seamless integration of imaging, robotics, and navigation systems. Hospitals focus on strengthening intraoperative accuracy through multi-modality platforms that combine CT, MRI, and fluoroscopy capabilities. Growing preference for high-efficiency surgical suites accelerates vendor innovation. Demand broadens as hospitals align infrastructure upgrades with value-based care protocols.
Technological Improvements and Growing Use of AI-Based Imaging Solutions
The intraoperative imaging market evolves through rapid progress in AI-enabled reconstruction, automated segmentation, and image-guided decision support. It enhances surgical planning accuracy and supports faster interpretation during critical steps. Vendors develop compact, mobile, and lower-radiation systems to improve OR ergonomics. Increasing focus on workflow automation strengthens integration of imaging with surgical navigation platforms. Hospitals invest in advanced solutions that enhance efficiency and reduce procedure variability.
Market Trends:
Integration of AI, Robotics, and Multi-Modality Imaging in Advanced Surgical Workflows
The intraoperative imaging market moves toward deeper integration of AI-driven image interpretation, robotics-assisted navigation, and multi-modality visualization platforms. It strengthens surgical accuracy by supporting faster recognition of anatomical structures and improved alignment with planned trajectories. Hybrid ORs adopt platforms that combine CT, MRI, and fluoroscopy in a unified workflow to reduce time spent on patient repositioning. Vendors introduce compact designs that fit diverse surgical environments without compromising diagnostic clarity. Surgeons favor systems that provide dynamic imaging support for complex neurosurgical and orthopedic interventions. Hospitals accelerate upgrades to align with digital surgery ecosystems. Demand rises for imaging modalities that support low-dose protocols and near-instant reconstruction.
- For Instance, Companies such as RSIP Vision and Ortoma are developing AI-based platforms that transform standard 2D X-ray images, including fluoroscopic views, into clinical-grade 3D bone models for surgical planning.
Growing Shift Toward Mobile, Compact, and Workflow-Optimized Imaging Systems
The intraoperative imaging market shows a clear trend toward mobile and compact platforms that improve OR flexibility and reduce infrastructure burdens. It enables hospitals to deploy advanced imaging in diverse surgical departments without reliance on permanent installations. Vendors enhance mobility, battery efficiency, and wireless data transfer to strengthen workflow continuity. Hospitals prioritize systems that offer rapid setup, minimal footprint, and seamless integration with existing navigation tools. Surgeons require imaging solutions that support shorter procedure durations and consistent intraoperative decision-making. Product innovation focuses on intuitive interfaces that reduce training requirements. Demand increases for solutions that support personalized surgical pathways and real-time data visibility.
- For example, the GE HealthCare OEC 3D C-arm delivers high-definition 3D and 2D images with a 19 cm3 CT-like field of view intraoperatively in minutes, enabling rapid setup and integration with surgical navigation.
Market Challenges Analysis:
High Capital Costs and Complex Integration Requirements Restrain Technology Adoption
The intraoperative imaging market faces challenges linked to high upfront investment, which limits adoption in mid-scale hospitals and emerging economies. It requires significant spending on hybrid OR infrastructure, shielding, and specialized installation. Hospitals struggle to balance budget constraints with the need for advanced imaging upgrades. Integration with navigation systems, robotics, and existing IT frameworks increases technical complexity. Surgeons and staff often require extensive training before full operational use. Vendors must address interoperability gaps to support smoother deployment. Procurement delays slow market penetration across cost-sensitive regions.
Operational Constraints, Workflow Disruptions, and Maintenance Burdens Limit Efficiency
The intraoperative imaging market encounters concerns related to workflow interruptions during calibration, system movement, and image acquisition. It can extend surgical duration when equipment lacks optimal mobility or automation. Hospitals experience capacity pressure when maintenance cycles or technical errors delay OR availability. Radiation exposure concerns persist in CT-based platforms, prompting the need for strict safety protocols. Many facilities face staffing limitations that reduce consistent utilization of advanced systems. Vendors must resolve reliability issues to ensure stable performance in high-acuity environments. Growing procedural complexity increases pressure on imaging systems to deliver consistent accuracy throughout surgery.
Market Opportunities:
Expansion of AI-Enhanced Imaging and Personalized Surgical Ecosystems Creates Strong Growth Potential
The intraoperative imaging market gains new opportunities through rapid progress in AI-driven reconstruction, automated detection, and personalized surgical planning. It supports deeper integration of imaging data with robotic platforms and next-generation navigation tools. Hospitals seek solutions that shorten procedure time while improving real-time decision accuracy. Vendors can unlock value by developing interoperable systems that connect seamlessly with electronic surgical workflows. Demand rises for imaging platforms that deliver low-dose protocols without compromising clarity. Emerging advances in intelligent 3D modeling widen the scope for precision-focused interventions. Growing adoption of personalized surgery strengthens long-term equipment investments.
Rising Healthcare Modernization Across Emerging Markets Broadens Adoption Possibilities
The intraoperative imaging market benefits from expanding healthcare infrastructure in Asia-Pacific, Latin America, and the Middle East. It enables hospitals to invest in hybrid ORs, mobile imaging units, and high-performance visualization platforms. Governments prioritize surgical modernization to reduce treatment gaps and improve patient outcomes. Vendors can capitalize on strong demand for compact, cost-efficient systems with minimal installation barriers. Training partnerships and remote-support models create deeper market penetration. Rising surgical volumes in neurosurgery, orthopedics, and trauma care increase the need for real-time intraoperative imaging. Broader access to financing solutions strengthens adoption across resource-limited regions.
Market Segmentation Analysis:
By Modality
The intraoperative imaging market shows strong dominance of intraoperative CT due to its ability to deliver high-resolution images and clear bone detail during spine and trauma procedures. It supports surgical accuracy in complex reconstructions and helps surgeons verify implant placement. Intraoperative MRI gains steady demand in neurosurgery, driven by its superior soft-tissue visualization and value in tumor margin assessment. Ultrasound maintains broad adoption because it offers mobility, lower cost, and real-time scanning in diverse surgical settings. Hybrid platforms that combine multiple imaging capabilities gain traction in advanced OR environments. Demand for compact, low-dose systems grows in mid-scale hospitals that seek efficient upgrades.
- For instance, the intraoperative CT system developed by Siemens Healthineers achieved image registration accuracy of 0.576 ± 0.146 mm in orthopedic navigation, significantly enhancing surgical precision and implant placement verification.
By Application
The intraoperative imaging market records significant use in neurosurgery, where precise navigation and real-time visualization reduce the need for repeat interventions. It strengthens surgeon confidence during tumor resections and functional procedures. Orthopedic and spine surgery adopt imaging to confirm alignment, assess joint structures, and improve fixation outcomes. Trauma surgery relies on CT and ultrasound to support rapid assessment and accurate stabilization. Cardiovascular procedures also begin to integrate advanced imaging for improved intraoperative clarity. Expanding use across minimally invasive surgery increases equipment relevance.
- For instance, GE HealthCare's OEC 3D mobile C-arm provides high-resolution 3D imaging, which aids in achieving precise fracture stabilization. The use of such intraoperative 3D imaging tools helps surgeons immediately identify potential issues, allowing for immediate correction.
By End-use
The intraoperative imaging market sees hospitals leading due to strong investment capacity and higher procedure volumes. It aligns with hybrid OR expansion and rising demand for advanced visualization. Specialty centers adopt mobile and compact systems to improve efficiency in focused surgical disciplines. Ambulatory surgical centers invest in portable imaging units that support faster turnaround. Research institutes use advanced modalities to test emerging techniques and refine clinical protocols. Frequency of high-acuity procedures continues to shape end-user preferences.
Segmentations:
By Modality
- Intraoperative CT
- Intraoperative MRI
- Intraoperative Ultrasound
- Fluoroscopy Systems
- Hybrid Imaging Systems
By Application
- Neurosurgery
- Orthopedic and Spine Surgery
- Trauma Surgery
- Cardiovascular Surgery
- ENT and Cranial Base Surgery
By End-use
- Hospitals
- Specialty Surgical Centers
- Ambulatory Surgical Centers
- Research and Academic Institutes
By Region
- North America
- U.S.
- Canada
- Mexico
- Europe
- Germany
- France
- U.K.
- Italy
- Spain
- Rest of Europe
- Asia Pacific
- China
- Japan
- India
- South Korea
- South-east Asia
- Rest of Asia Pacific
- Latin America
- Brazil
- Argentina
- Rest of Latin America
- Middle East & Africa
- GCC Countries
- South Africa
- Rest of the Middle East and Africa
Regional Analysis:
Strong Market Leadership in North America Supported by Advanced Surgical Infrastructure
The intraoperative imaging market maintains a leading position in North America due to strong adoption of high-performance surgical technologies. It benefits from well-established hybrid OR networks, high surgical volumes, and consistent investment in precision-driven care. Hospitals integrate intraoperative CT, MRI, and advanced ultrasound systems to support complex neurosurgical and orthopedic procedures. Demand strengthens as providers prioritize real-time visualization to improve outcomes and reduce revision rates. Regulatory support for innovative imaging platforms widens product availability. Vendors gain opportunities through AI-enabled navigation and robotics integration. Training programs and robust reimbursement structures reinforce long-term growth potential.
Growing Investments and Technology Upgrades Accelerate Adoption Across Europe
The intraoperative imaging market records strong momentum in Europe due to structured surgical protocols and rising focus on quality-of-care optimization. It expands through government-backed healthcare modernization and wider acceptance of hybrid OR concepts. Hospitals invest in MRI and CT platforms that enhance visualization during tumor resections, spine stabilization, and complex trauma procedures. Strong emphasis on low-dose imaging and data standardization guides purchasing decisions. Clinical research networks support rapid evaluation of emerging technologies. Demand for portable and workflow-friendly systems increases across mid-sized hospitals. Adoption benefits from collaborative initiatives between imaging manufacturers and surgical device companies.
Rapid Healthcare Expansion Drives High Growth Prospects in Asia-Pacific
The intraoperative imaging market experiences the fastest growth in Asia-Pacific, driven by large patient populations and rising surgical capacity in China, India, Japan, and South Korea. It accelerates through expanding hospital infrastructure, higher demand for neurosurgical and orthopedic interventions, and growing investment in specialized surgical centers. Governments prioritize modernization to reduce diagnostic gaps and improve patient safety. Hospitals seek compact, cost-efficient imaging platforms that support diverse surgical workflows. Adoption increases as surgeons gain training in advanced intraoperative visualization techniques. Vendors strengthen presence through localized manufacturing and strategic partnerships. Rising preference for minimally invasive surgery widens long-term market potential.
Key Player Analysis:
- GE HealthCare
- Siemens Healthcare GmbH
- Medtronic plc
- Koninklijke Philips N.V.
- Canon Medical Systems Corporation
- Shimadzu Corporation (Medical Systems)
- Brainlab AG
- Ziehm Imaging GmbH
- IMRIS
- NeuroLogica Corp.
Competitive Analysis:
The intraoperative imaging market shows strong competition among global manufacturers that invest in advanced visualization technologies and integrated surgical platforms. Leading companies include GE HealthCare, Siemens Healthcare GmbH, Medtronic plc, Koninklijke Philips N.V., and Canon Medical Systems Corporation. It reflects a landscape driven by continuous innovation in hybrid OR solutions, AI-enabled imaging software, and interoperable navigation systems. Vendors focus on compact system design, low-dose imaging enhancements, and improved workflow automation to meet hospital demands. Strategic partnerships with surgical robotics companies strengthen product value and broaden clinical utility. Companies expand global reach through localized production, targeted training programs, and service-network development. Competitive intensity increases as hospitals prioritize reliability, precision, and long-term service support in procurement decisions.
Recent Developments:
- In July 2024, GE HealthCare announced an agreement to acquire Intelligent Ultrasound Group PLC’s clinical artificial intelligence software business for around $51 million, expanding its AI-driven ultrasound imaging portfolio.
- In December 2024, GE HealthCare began acquiring the remaining 50% stake in Nihon Med-Physics from Sumitomo Chemical.
Report Coverage:
The research report offers an in-depth analysis based on Modality, Application, End-use and Region. It details leading Market players, providing an overview of their business, product offerings, investments, revenue streams, and key applications. Additionally, the report includes insights into the competitive environment, SWOT analysis, current Market trends, as well as the primary drivers and constraints. Furthermore, it discusses various factors that have driven Market expansion in recent years. The report also explores Market dynamics, regulatory scenarios, and technological advancements that are shaping the industry. It assesses the impact of external factors and global economic changes on Market growth. Lastly, it provides strategic recommendations for new entrants and established companies to navigate the complexities of the Market.
Future Outlook:
- The intraoperative imaging market is set to gain momentum through deeper integration of AI-enabled visualization and automated interpretation tools.
- Hospitals aim to expand hybrid OR installations to support multidisciplinary surgical workflows.
- Demand will rise for compact, mobile, and lower-dose imaging systems that strengthen OR flexibility.
- Vendors will focus on seamless interoperability with robotics, navigation platforms, and digital surgery ecosystems.
- Surgeons will adopt advanced imaging to reduce revision procedures and enhance real-time decision accuracy.
- Healthcare systems in emerging markets will accelerate investments to modernize surgical infrastructure.
- Workflow-optimized imaging platforms will gain preference due to their ability to shorten procedure time.
- Training programs and remote-assist models will expand to improve surgeon familiarity with advanced systems.
- Product innovation will center on intuitive interfaces, faster reconstruction speeds, and stronger data integration.
- Long-term opportunities will expand as precision surgery becomes a standard requirement across specialties.
Request a Free Sample
Fill in your details and we'll send you a free sample report.
- Sample data tables & charts
- Research methodology
Need a Custom Version of This Report?
Tailor the scope, geography, or segments to your exact requirements.
- Custom geography or segment scope
- Direct access to our analyst team
Frequently Asked Questions
What is the current market size for the intraoperative imaging market, and what is its projected size in 2032?
At what Compound Annual Growth Rate is the intraoperative imaging market projected to grow between 2024 and 2032?
Which intraoperative imaging market segment held the largest share in 2024?
What are the primary factors fueling the growth of the intraoperative imaging market?
Who are the leading companies in the intraoperative imaging market?
Which region commanded the largest share of the intraoperative imaging market in 2024?
Table of Content
Chapter 1. Report Introduction
- 1.1 Report Description & Purpose
- 1.1.1 Report Title & Market Definition
- 1.1.2 Unique Selling Propositions (USP) & Key Differentiators
- 1.1.3 Value Proposition for Stakeholders
- 1.2 Research Objectives
- 1.2.1 Market Sizing Objectives (Volume & Revenue)
- 1.2.2 Segmentation Objectives
- 1.2.3 Competitive Intelligence Objectives
- 1.2.4 Forecast & Scenario Objectives
- 1.3 Report Scope
- 1.3.1 Intraoperative Imaging Scope – Types & Subtypes Covered
- 1.3.2 Geographic Scope – Regions & Countries Covered
- 1.3.3 Historical Period, Base Year & Forecast Period (2024; forecast to 2032)
- 1.3.4 Inclusions & Exclusions
- 1.4 HS Code & Classification Framework
- 1.5 Currency, Units & Pricing Basis
- 1.6 Target Stakeholders
- 1.7 Limitations & Assumptions
Chapter 2. Executive Summary
- 2.1 Global Intraoperative Imaging Market Snapshot
- 2.1.1 Market Size – Historical (2024) & Forecast (2024-2032) (2024: USD 3,664.5 million → 2032: USD 6,110.44 million)
- 2.1.2 Volume & Revenue – Global Totals
- 2.1.3 Key Market Highlights – Top Five Facts
- 2.2 Intraoperative Imaging Market Segmentation Snapshot
- 2.2.1 Market Split by Region – 2024 vs. 2032
- 2.3 Competitive Snapshot
- 2.3.1 Top 10 Players by Revenue Share – 2024
- 2.3.2 Top 10 Players by Volume Share – 2024
- 2.3.3 Recent Strategic Developments (18-Month Summary)
- 2.4 Key Investment Highlights & Strategic Conclusions
Chapter 3. Intraoperative Imaging Market Dynamics & Industry Analysis
- 3.1 Market Overview & Context
- 3.1.1 Intraoperative Imaging Market Position in the Broader Automotive Value Chain
- 3.1.2 OEM vs. Replacement Market Dynamics
- 3.1.3 Market Maturity & Development Stage by Region
- 3.2 Intraoperative Imaging Market Drivers
- 3.3 Intraoperative Imaging Market Restraints & Challenges
- 3.4 Intraoperative Imaging Market Opportunities
- 3.5 Porter's Five Forces Analysis
- 3.5.1 Threat of New Entrants
- 3.5.2 Bargaining Power of Suppliers
- 3.5.3 Bargaining Power of Buyers
- 3.5.4 Threat of Substitutes
- 3.5.5 Competitive Rivalry – Intensity Assessment
- 3.6 Intraoperative Imaging Value Chain Analysis
- 3.6.1 Upstream – Raw Material/Input Suppliers
- 3.6.1.1 Raw Material/Input 1
- 3.6.1.2 Raw Material/Input 2
- 3.6.1.3 Raw Material/Input 3
- 3.6.2 Midstream – Production/Manufacturing/Service Delivery
- 3.6.2.1 Production/Process Overview
- 3.6.2.2 Key Facility Locations & Capacity by Manufacturer
- 3.6.3 Downstream – Distribution & End Consumer
- 3.6.3.1 Primary Channel – B2B/OEM
- 3.6.3.2 Secondary Channels – Dealer, Retail, Online, Direct
- 3.6.4 Value Chain Profitability Analysis
- 3.6.1 Upstream – Raw Material/Input Suppliers
- 3.7 PESTEL Analysis
- 3.7.1 Political Factors
- 3.7.2 Economic Factors
- 3.7.3 Social Factors
- 3.7.4 Technological Factors
- 3.7.5 Environmental Factors
- 3.7.6 Legal Factors
- 3.8 Intraoperative Imaging Supply Chain Analysis
- 3.8.1 Raw Material/Input Supply Risk Assessment
- 3.8.2 Manufacturing Concentration Risk (Geographic Exposure)
- 3.8.3 Trade Disruption Impact Analysis
- 3.9 Regulatory & Policy Landscape
Note: The regulatory and policy landscape section covers regulations based on their applicability to the market, Intraoperative Imaging category, geography, and scope of the study. Only regulatory frameworks with a material impact on operations, compliance, trade, sustainability, or market access are analyzed in detail.
Chapter 4. Key Investment Pockets & Opportunity Analysis
- 4.1 Intraoperative Imaging Market Attractiveness Analysis
- 4.1.1 By Region – Investment Attractiveness Matrix (Volume × CAGR)
- 4.2 Absolute Revenue Growth Opportunity
- 4.2.1 By Region – Absolute USD Growth Through 2032
- 4.3 Incremental Volume Opportunity
- 4.3.1 By Region – Incremental Volume Through 2032
- 4.3.2 Segment – Incremental Volume
- 4.4 Emerging Submarket Opportunity Deep Dive (Subject to Applicability)
- 4.5 Emerging Market Opportunity Scorecards
- 4.5.1 United States
- 4.5.2 Europe
- 4.5.3 Asia
- 4.5.4 Middle East & Africa
Note: Emerging Market Opportunity Scorecards will be included based on relevance and strategic importance. Regions listed are indicative and may vary depending on data availability and market dynamics.
Chapter 5. Intraoperative Imaging Import-Export Analysis & Trade Flows
- 5.1 Global Trade Overview
- 5.1.1 Global Export Value by Country (2024)
- 5.1.2 Global Export Volume by Country (2024)
- 5.1.3 Global Import Value by Country (2024)
- 5.1.4 Global Import Volume by Country (2024)
- 5.1.5 Net Trade Balance by Country (2024)
- 5.2 Export Analysis – Segment
- 5.2.1 Type 1 (HS Code)
- 5.2.2 Type 2 (HS Code)
- 5.2.3 Type 3 (HS Code)
- 5.2.4 Type 4 (HS Code)
- 5.2.5 Type 5 (HS Code)
- 5.3 Import Analysis – Segment
- 5.3.1 Type 1 (HS Code)
- 5.3.2 Type 2 (HS Code)
- 5.3.3 Type 3 (HS Code)
- 5.3.4 Type 4 (HS Code)
- 5.3.5 Type 5 (HS Code)
- 5.4 Average Unit Trade Prices
- 5.4.1 Average Export Price – Segment & Country
- 5.4.2 Average Import Price – Segment & Source Country
- 5.4.3 Price Trends (2024)
- 5.5 Key Trade Route Analysis
- 5.5.1 Trade Route 1
- 5.5.2 Trade Route 2
- 5.5.3 Trade Route 3
- 5.5.4 Trade Route 4
- 5.5.5 Trade Route 5
- 5.6 Trade Policy Impact Assessment
- 5.6.1 US Anti-Dumping & Section 301 Tariffs
- 5.6.2 EU Customs Union Impact
- 5.6.3 Major Free Trade Agreements
- 5.6.4 USMCA Rules of Origin
Note: Trade policy analysis will be included only where relevant to the Intraoperative Imaging market.
Chapter 6. Competitive Landscape & Company Benchmarking
- 6.1 Intraoperative Imaging Market Concentration & Structure
- 6.1.1 Herfindahl-Hirschman Index (HHI) – vs. 2024
- 6.1.2 Tier 1, Tier 2 & Tier 3 Market Structure
- 6.1.3 Global, Regional & Local Player Dynamics
- 6.2 Intraoperative Imaging Market Share Analysis – 2024
- 6.2.1 Global Revenue Share by Company
- 6.2.2 Global Volume Share by Company
- 6.2.3 Regional Revenue Share
- 6.2.4 Market Share Evolution ( vs. 2024)
- 6.2.5 OEM Segment Share by Company
- 6.2.6 Replacement Segment Share by Company
- 6.3 Production/Delivery Capacity & Facility Analysis
- 6.3.1 Global Installed Capacity
- 6.3.2 Capacity Utilization Rates
- 6.3.3 Production/Output Volume
- 6.3.4 Facility Locations & Capacity Map
- 6.3.5 Planned Capacity Additions
- 6.4 Intraoperative Imaging Competitive Benchmarking Matrix
- 6.4.1 Revenue, Volume, CAGR & Profitability Comparison
- 6.4.2 Channel Revenue Mix
- 6.4.3 Geographic Revenue Exposure
- 6.4.4 R&D Intensity
- 6.4.5 Sustainability Maturity
- 6.5 Strategic Developments in Intraoperative Imaging (Last 24 Months)
- 6.5.1 Mergers, Acquisitions & Divestments
- 6.5.2 New Intraoperative Imaging Launches
- 6.5.3 Facility Expansions
- 6.5.4 Strategic Alliances, Joint Ventures & Partnerships
- 6.5.5 Distribution Expansion & Market Entry
- 6.5.6 Sustainability & ESG Initiatives
- 6.6 Competitive Strategy Mapping
- 6.6.1 Leader, Challenger, Follower & Niche Classification
- 6.6.2 Pricing Strategy Comparison
- 6.6.3 Channel Strategy Matrix
Note: Strategic developments are included based on their materiality and the availability of reliable information.
Chapter 7. Global Intraoperative Imaging Market – By Distribution Channel
- 7.1 Segment Overview
- 7.1.1 Volume & Revenue Split by Channel (2024 & 2032)
- 7.1.2 Channel Mix Evolution (2024-2032)
Chapter 8. Regional Market Analysis – Global Overview
- 8.1 Global Regional Overview
- 8.1.1 Regional Volume Share
- 8.1.2 Regional Revenue Share
- 8.1.3 Regional Volume by Region
- 8.1.4 Regional Revenue by Region
- 8.1.5 Regional Forecast Through 2032
- 8.2 Cross-Regional Segment Analysis
- 8.2.1 By Distribution Channel
- 8.2.2 By Brand/Price Tier
Chapter 9. North America Intraoperative Imaging Market
- 9.1 United States
- 9.2 Canada
- 9.3 Mexico
Chapter 10. Europe Intraoperative Imaging Market
- 10.1 Germany
- 10.2 France
- 10.3 Italy
- 10.4 United Kingdom
- 10.5 Spain
- 10.6 Poland
- 10.7 Russia
- 10.8 Netherlands
- 10.9 Belgium
- 10.10 Sweden
- 10.11 Denmark
- 10.12 Norway
- 10.13 Rest of Europe
Chapter 11. Asia Pacific Intraoperative Imaging Market
- 11.1 China
- 11.2 India
- 11.3 Japan
- 11.4 South Korea
- 11.5 Thailand
- 11.6 Indonesia
- 11.7 Vietnam
- 11.8 Malaysia
- 11.9 Australia
- 11.10 Rest of Asia Pacific
Chapter 12. Latin America Intraoperative Imaging Market
- 12.1 Brazil
- 12.2 Argentina
- 12.3 Colombia
- 12.4 Chile
- 12.5 Rest of Latin America
Chapter 13. Middle East Intraoperative Imaging Market
- 13.1 Saudi Arabia
- 13.2 United Arab Emirates
- 13.3 Turkey
- 13.4 Israel
- 13.5 Iran
- 13.6 Rest of the Middle East
Chapter 14. Africa Intraoperative Imaging Market
- 14.1 South Africa
- 14.2 Egypt
- 14.3 Nigeria
- 14.4 Morocco
- 14.5 Rest of Africa
Chapter 15. Intraoperative Imaging Company Profiles
- 15.1 [Company 01]
- 15.1.1 Company Overview
- 15.1.2 Key Management Personnel
- 15.1.3 Products & Services Portfolio
- 15.1.4 Financial Performance
- 15.1.5 Key Market Focus & Geographic Presence
- 15.1.6 Recent Developments & Strategic Initiatives
Note: The company profile list is preliminary and may change based on research findings, market developments, data availability, and client requirements.
Chapter 16. Appendices
- Appendix A – List of Abbreviations & Acronyms
- Appendix B – Industry Classification Code Reference – Full Series
- Appendix C – Production & Capacity Data Tables
- Appendix D – End-Use & Demand Base Tables
- Appendix E – Consumption & Replacement Rate Assumptions
- Appendix F – ASP Reference Tables
- Appendix G – Manufacturing & Facility Database
- Appendix H – Import-Export Data Tables
- Appendix I – Regulatory Summary Tables
- Appendix J – Primary Research Participant List (Anonymized)
- Appendix K – Primary Research Questionnaire Framework
- Appendix L – Data Sources & Bibliography
- Appendix M – Market Size Divergence & Source Comparison
Chapter 17. Research Methodology
- 17.1 Research Framework & Philosophy
- 17.2 Secondary Research – Sources, Hierarchy & Data Extraction
- 17.3 Data Modeling – Bottom-Up & Top-Down Market Sizing
- 17.4 Primary Research – Stakeholder Framework, LOI & Sample Sizes
- 17.5 Forecast Methodology – Regression, Scenario & Sensitivity Analysis
- 17.6 Quality Control – Four-Layer Validation Framework
- 17.7 Limitations & Standard Assumptions
- 17.8 Disclaimer
