Market Overview
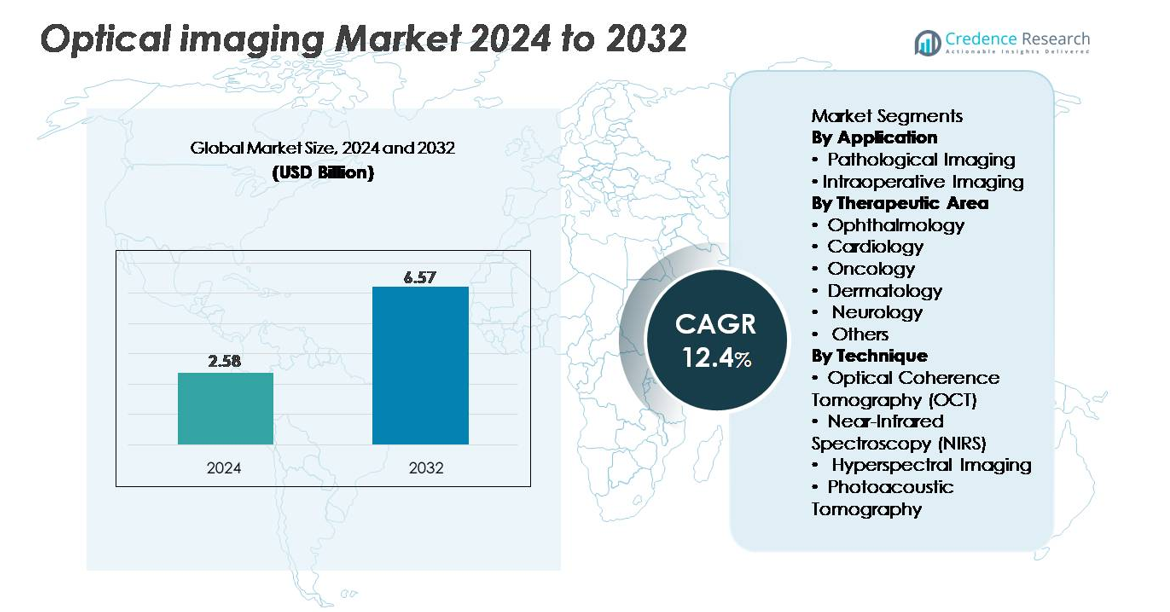
The optical imaging market was valued at USD 2.58 billion in 2024 and is anticipated to reach USD 6.57 billion by 2032, expanding at a CAGR of 12.4% during the forecast period (2025–2032).
| REPORT ATTRIBUTE |
DETAILS |
| Historical Period |
2020-2023 |
| Base Year |
2024 |
| Forecast Period |
2025-2032 |
| Optical Imaging Market Size 2024 |
USD 2.58 billion |
| Optical Imaging Market, CAGR |
12.4% |
| Optical Imaging Market Size 2032 |
USD 6.57 billion |
The optical imaging market is shaped by strong competition among leading players such as Heidelberg Engineering GmbH, Abbott Laboratories, Topcon Corporation, Canon Inc., Olympus Corporation, Carl Zeiss Meditec AG, Koninklijke Philips, St. Jude Medical Inc., and PerkinElmer Inc. These companies drive innovation through advancements in OCT systems, fluorescence-guided imaging, hyperspectral platforms, and AI-enabled diagnostic tools. North America leads the global market with a 35% share, supported by advanced clinical infrastructure, high adoption of ophthalmic imaging systems, and strong reimbursement frameworks. Europe and Asia-Pacific follow as key growth regions, each benefiting from expanding healthcare modernization and rising demand for non-invasive diagnostics.
Market Insights
- The optical imaging market was valued at USD 2.58 billion in 2024 and is projected to reach USD 6.57 billion by 2032, registering a 12.4% CAGR during the forecast period.
- Growing demand for non-invasive, high-resolution diagnostics in ophthalmology, oncology, cardiology, and neurology drives adoption, with pathological imaging holding the dominant application share and ophthalmology leading therapeutic use due to extensive OCT deployment.
- AI-enabled imaging analytics, fluorescence-guided surgery, photoacoustic platforms, and portable OCT systems are reshaping industry trends, creating opportunities for advanced multimodal and minimally invasive diagnostic solutions.
- The competitive landscape is shaped by leading players such as Heidelberg Engineering, Topcon, Abbott, Canon, Olympus, Carl Zeiss Meditec, Philips, St. Jude Medical, and PerkinElmer, each strengthening portfolios through innovation in OCT and intraoperative optical imaging systems.
- North America leads with a 35% share, followed by Europe at 28% and Asia-Pacific at 25%, reflecting strong adoption across advanced healthcare systems, while Latin America and the Middle East & Africa contribute smaller yet growing shares.
Access crucial information at unmatched prices!
Request your sample report today & start making informed decisions powered by Credence Research Inc.!
Download Sample
Market Segmentation Analysis:
By Application
Pathological imaging represents the dominant application segment in the optical imaging market, driven by its critical role in early disease detection, high-resolution tissue characterization, and integration into digital pathology workflows. Its leadership is reinforced by rising adoption of minimally invasive diagnostics and increased use of optical coherence technologies in histopathology validation. Intraoperative imaging continues to expand as surgeons deploy fluorescence-guided and real-time optical systems to improve surgical precision and margin assessment. Growth in this segment is supported by increasing demand for image-guided interventions and enhanced visualization tools designed to reduce procedural risks.
- For instance, Carl Zeiss Meditec’s LSM 980 with Airyscan 2 delivers lateral resolution near 120 nm, based on its super-resolution confocal mode. The system also supports high-speed imaging, reaching frame rates of about 47 fps in specific multiplex scanning modes. These features make the platform suitable for detailed subcellular fluorescence imaging in research labs.
By Therapeutic Area
Ophthalmology holds the largest share within therapeutic areas, supported by widespread use of optical coherence tomography in retinal diagnostics, glaucoma monitoring, and anterior segment assessment. Its dominance is further strengthened by the high global burden of age-related eye diseases and continuous upgrades in ophthalmic imaging platforms. Oncology is rapidly growing as optical imaging enables enhanced tumor visualization, microvascular assessment, and early lesion detection. Cardiology, dermatology, and neurology benefit from expanding applications in vascular mapping, skin lesion differentiation, and neural tissue monitoring, while the “others” category gains traction through emerging research-driven clinical applications.
- For instance, Heidelberg Engineering’s SPECTRALIS OCT with the OCT2 module provides a digital axial resolution of about 9 µm. The system also supports scan speeds of up to 85,000 A-scans per second. These features allow clear visualization of retinal layers for conditions such as AMD and diabetic eye disease.
By Technique
Optical Coherence Tomography (OCT) remains the dominant technique due to its superior depth-resolved imaging, micrometer-scale resolution, and strong integration into ophthalmology and cardiology diagnostics. Its leadership is reinforced by advancements in swept-source systems and high-speed scanning capabilities. Near-infrared spectroscopy expands steadily across metabolic monitoring and tissue perfusion assessment. Hyperspectral imaging gains momentum in precision diagnostics and surgical guidance, supported by its multispectral analysis capabilities. Photoacoustic tomography is emerging rapidly as hybrid imaging demand increases, offering deeper tissue visualization and functional insights that enhance preclinical research and oncology applications.
Key Growth Drivers
Rising Demand for Non-Invasive and High-Resolution Diagnostic Imaging
The shift toward minimally invasive diagnostics continues to accelerate demand for optical imaging solutions across clinical and research environments. Healthcare providers increasingly rely on modalities such as OCT, hyperspectral imaging, and photoacoustic tomography to capture microstructural detail without ionizing radiation. These systems offer superior spatial resolution, enabling earlier disease detection in ophthalmology, oncology, cardiology, and neurology. Growth is further stimulated by aging populations and increasing prevalence of chronic diseases that require routine imaging for monitoring and intervention planning. Integration of optical imaging into point-of-care devices also broadens accessibility in outpatient settings. Improved workflow efficiency, real-time visualization capabilities, and compatibility with digital health platforms strengthen adoption. As hospitals and diagnostic centers prioritize safer, faster, and more accurate imaging alternatives, optical imaging technologies gain prominence as essential tools for precision diagnostics and preventative care.
- For instance, Carl Zeiss Meditec’s CIRRUS 6000 OCT system operates at 100,000 A-scans per second and provides an axial resolution of about 5 µm in tissue. These capabilities support fast, high-definition retinal imaging. The system is widely used for early detection and monitoring of AMD, diabetic retinopathy, and glaucoma.
Expanding Adoption in Surgical Guidance and Image-Guided Interventions
Optical imaging plays an increasingly central role in enhancing surgical precision, particularly in oncology, neurosurgery, cardiovascular interventions, and minimally invasive procedures. Fluorescence-guided surgery, intraoperative OCT, and photoacoustic-based visualization improve real-time tissue differentiation and help surgeons achieve clear margins while minimizing damage to healthy structures. These advantages significantly reduce surgical risks, improve patient outcomes, and shorten recovery time. Growing investment in hybrid operating rooms and advanced surgical navigation platforms further accelerates adoption. The proliferation of robotic-assisted surgeries also drives demand for integrated optical imaging modules that deliver high-speed, high-resolution feedback. As healthcare systems prioritize value-based care and complication reduction, real-time optical guidance offers measurable clinical benefits. Continuous improvements in imaging depth, field-of-view, and device miniaturization expand applicability across multiple specialties, solidifying optical imaging as a core component of future operating rooms.
- For instance, The FLUOBEAM® LXfluorescence imaging system, manufactured by Fluoptics (now part of Getinge), provides real-time near-infrared (NIR) fluorescence imaging of tissue during surgical procedures. It utilizes a Class 1 laser excitation source and is noted for its high sensitivity and ability to operate in ambient light
Growth of Precision Medicine and Research Applications
Expanding applications in precision medicine, functional imaging, and translational research significantly boost demand for advanced optical imaging platforms. Researchers increasingly rely on hyperspectral, multiphoton, and photoacoustic systems to analyze molecular signatures, tissue metabolism, and real-time cellular behavior with high specificity. These capabilities support breakthroughs in biomarker discovery, drug development, and disease modeling. The rapid growth of regenerative medicine, 3D cell culture, and organ-on-chip technologies further increases reliance on optical modalities to monitor tissue engineering processes without destructive sampling. The non-contact, label-free nature of several optical techniques enhances adoption in longitudinal studies. Gene- and cell-based therapies also require precise imaging tools for evaluating treatment response. As pharmaceutical pipelines shift toward complex biological therapies, optical imaging strengthens its position as a critical analytical tool for high-resolution visualization, functional assessment, and mechanism-of-action validation.
Key Trends & Opportunities
Integration of AI, Machine Learning, and Computational Imaging
AI-driven image analysis presents one of the most transformative opportunities in the optical imaging market. Machine learning algorithms significantly enhance accuracy by automating image interpretation, detecting subtle abnormalities, and reducing variability in clinical assessments. In ophthalmology, AI-enabled OCT analysis supports early detection of diabetic retinopathy and macular degeneration. In oncology and dermatology, deep-learning models improve lesion classification, segmentation, and risk prediction. Computational imaging techniques such as super-resolution reconstruction, optical tomography enhancement, and spectral unmixing enable visualization beyond traditional physical limits. As cloud-based platforms and edge-computing devices gain traction, real-time automated reporting becomes feasible in a wide range of care settings. These advancements expand optical imaging’s diagnostic value while reducing clinician workload. The integration of AI with multimodal optical systems opens opportunities for personalized screening tools, predictive analytics, and fully automated workflows.
- For instance, Heidelberg Engineering’s Eye2Gene™ AI model was trained on 58,030 multimodal retinal scans from 2,451 genetically confirmed IRD patients and externally validated on 775 patients across five centers, enabling gene-level phenotyping from SPECTRALIS OCT, FAF, and IR images.
Miniaturization and the Shift Toward Portable and Wearable Imaging Devices
Advances in miniaturization are creating new market opportunities by enabling portable, handheld, and wearable optical imaging systems suitable for point-of-care environments. Compact OCT probes, wearable spectroscopy sensors, and lightweight hyperspectral devices support remote diagnostics, home-based monitoring, and mobile health programs. These innovations broaden access in rural regions and low-resource settings where full-scale imaging systems are not feasible. Miniaturized platforms also enable intraoperative use in tight anatomical spaces, expanding applications in ENT, neurosurgery, and microvascular procedures. Technological improvements in fiber optics, photonic chips, and battery-efficient light sources support continued size reduction. As decentralized healthcare models gain momentum globally, portable optical imaging emerges as a critical enabler of early detection, telemedicine, and continuity of care, offering strong long-term growth potential.
- For instance, the Notal Vision Home-OCT device (Scanly) which has been validated in two pivotal U.S. clinical trials operates with a compact scanning engine capable of acquiring 3D retinal volumes at 10,000 A-scans per second, allowing for self-imaging at home for AMD monitoring.
Key Challenges
Limited Imaging Depth and Technical Constraints Compared to Other Modalities
Despite significant advances, optical imaging technologies face inherent physical limitations that restrict their applicability in deep-tissue visualization. Light scattering and absorption in biological tissues reduce clarity and penetration depth, especially in applications requiring imaging beyond a few millimeters. These constraints make optical imaging less competitive than ultrasound, MRI, or CT for certain diagnostic tasks. Maintaining image quality while miniaturizing devices also presents challenges in signal-to-noise optimization and optical alignment. Additionally, differences in tissue optical properties complicate standardization and require sophisticated calibration. As the industry pushes toward broader clinical applications, overcoming depth and resolution trade-offs remains a key barrier to market expansion.
High System Costs and Reimbursement Limitations in Clinical Settings
Acquisition and maintenance costs remain a major adoption barrier, particularly for advanced OCT, hyperspectral, and photoacoustic systems. Many hospitals and outpatient facilities struggle to justify high capital expenditures without guaranteed reimbursement pathways. In several countries, reimbursement coverage for optical imaging procedures is incomplete or inconsistent, limiting clinical uptake outside ophthalmology. Budget constraints in emerging markets further delay adoption. Training requirements and workflow integration challenges also increase total cost of ownership. For widespread deployment, manufacturers must address affordability through modular designs, cost-efficient components, and improved compatibility with existing clinical equipment. Until economic barriers are reduced, optical imaging adoption will remain uneven across regions and care settings.
Regional Analysis
North America
North America holds the largest share at 35%, supported by its advanced healthcare ecosystem, strong clinical adoption of OCT, and significant investment in AI-enabled imaging platforms. The United States drives regional leadership through rapid integration of optical imaging in ophthalmology, oncology, and neurosurgical applications, along with substantial reimbursement coverage for diagnostic tests. High concentration of device manufacturers and research institutions accelerates product innovation and clinical validation. Growing demand for minimally invasive diagnostics, combined with expansion of ambulatory surgical centers, strengthens technology penetration. Continuous upgrades in imaging workflows and widespread digital pathology initiatives further reinforce North America’s dominant position.
Europe
Europe accounts for 28% of the global market, driven by strong adoption of optical imaging across ophthalmology, dermatology, and oncology screening programs. Germany, the U.K., and France lead regional demand through established clinical infrastructure and high utilization of OCT and hyperspectral imaging systems. Supportive regulatory pathways and collaborative biomedical research networks accelerate technology evaluation and deployment. Increased investment in early diagnosis initiatives, along with strong photonics research capabilities across the region, drives continuous innovation. Hospitals and specialty clinics increasingly adopt fluorescence-guided surgery and multimodal imaging platforms, reinforcing Europe’s position as the second-largest contributor to the global optical imaging market.
Asia-Pacific
Asia-Pacific holds 25% of the market and represents the fastest-growing region due to healthcare modernization, rising incidence of chronic diseases, and expanding diagnostic infrastructure. China, Japan, South Korea, and India account for a substantial share, driven by high adoption of OCT in ophthalmology and increasing use of optical imaging in cancer detection and surgical guidance. Japan remains a center for photonics innovation, while China rapidly expands domestic manufacturing capabilities. Growing medical tourism, increasing investments in precision medicine, and broader accessibility of minimally invasive diagnostics position APAC as a long-term growth engine for the optical imaging industry.
Latin America
Latin America captures 7% of the global market, supported by expanding access to advanced diagnostics and rising adoption of OCT and fluorescence-guided imaging in major urban centers. Brazil and Mexico lead regional uptake due to improving hospital capabilities and increasing investment in ophthalmology and oncology care. Although budget limitations and reimbursement constraints persist, growing private healthcare networks and partnerships with multinational device companies enhance market penetration. Awareness of early screening continues to rise, driving demand for cost-effective and mid-tier imaging platforms. Gradual healthcare modernization and imported technology adoption contribute to steady market expansion across the region.
Middle East & Africa
The Middle East & Africa region accounts for 5% of the global market, with growth concentrated in GCC countries due to rising healthcare investment and adoption of advanced diagnostic technologies. Saudi Arabia and the UAE lead demand with expanding specialty centers focused on ophthalmology and oncology. Infrastructure upgrades, clinical collaborations, and government-backed modernization programs support technology integration. In Africa, uptake remains limited but gradually improves through private healthcare growth and donor-funded diagnostic initiatives. Demand for portable, affordable optical imaging devices increases across developing markets, allowing MEA to maintain a growing yet smaller share of global adoption.
Market Segmentations:
By Application
- Pathological Imaging
- Intraoperative Imaging
By Therapeutic Area
- Ophthalmology
- Cardiology
- Oncology
- Dermatology
- Neurology
- Others
By Technique
- Optical Coherence Tomography (OCT)
- Near-Infrared Spectroscopy (NIRS)
- Hyperspectral Imaging
- Photoacoustic Tomography
By Geography
- North America
- Europe
- Germany
- France
- U.K.
- Italy
- Spain
- Rest of Europe
- Asia Pacific
- China
- Japan
- India
- South Korea
- South-east Asia
- Rest of Asia Pacific
- Latin America
- Brazil
- Argentina
- Rest of Latin America
- Middle East & Africa
- GCC Countries
- South Africa
- Rest of the Middle East and Africa
Competitive Landscape
The competitive landscape of the optical imaging market is shaped by a mix of global medical device manufacturers, photonics companies, and emerging innovators specializing in high-resolution diagnostic technologies. Established players focus on expanding portfolios in OCT, hyperspectral imaging, fluorescence-guided surgery, and photoacoustic platforms to strengthen their clinical footprint. Companies increasingly invest in AI-enabled image analysis, multimodal imaging integration, and accelerated regulatory approvals to enhance product differentiation. Strategic collaborations with ophthalmology, oncology, and neurosurgery centers support clinical validation and broaden application scope. Emerging firms drive innovation through miniaturized probes, portable imaging systems, and photonic chip–based architectures. Market competition also intensifies through mergers, acquisitions, and R&D programs targeting improved imaging depth, speed, and sensitivity. As healthcare providers prioritize accuracy, workflow efficiency, and real-time visualization, manufacturers with strong technological capabilities, global distribution networks, and scalable product designs maintain a distinct competitive advantage.
Shape Your Report to Specific Countries or Regions & Enjoy 30% Off!
Key Player Analysis
Recent Developments
- In October 2025, Abbott launched a new intravascular optical imaging system designed for improved coronary artery assessment during cardiac procedures
- In July 2025, Heidelberg announced a major milestone with the publication of its Eye2Gene™ AI-based multimodal imaging study, which demonstrates AI-powered phenotyping of inherited retinal diseases using the company’s SPECTRALIS imaging platform.
- In May 2025, the company Heidelberg Engineering GmbH showcased its latest ophthalmic imaging innovations at the 2025 Annual Meeting of ARVO 2025, unveiling new developments aimed at advancing both clinical practice and research-level imaging.
Report Coverage
The research report offers an in-depth analysis based on Application, Therapeutic Area, Technique and Geography. It details leading market players, providing an overview of their business, product offerings, investments, revenue streams, and key applications. Additionally, the report includes insights into the competitive environment, SWOT analysis, current market trends, as well as the primary drivers and constraints. Furthermore, it discusses various factors that have driven market expansion in recent years. The report also explores market dynamics, regulatory scenarios, and technological advancements that are shaping the industry. It assesses the impact of external factors and global economic changes on market growth. Lastly, it provides strategic recommendations for new entrants and established companies to navigate the complexities of the market.
Future Outlook
- Optical imaging technologies will increasingly integrate AI and machine learning for automated diagnosis and enhanced clinical decision support.
- Adoption of multimodal platforms combining OCT, fluorescence imaging, and photoacoustic methods will expand across surgical and diagnostic settings.
- Miniaturized and portable imaging systems will gain traction in point-of-care, home-based monitoring, and mobile healthcare environments.
- Growth in precision medicine will boost demand for high-resolution, real-time imaging tools for personalized treatment planning.
- Intraoperative optical imaging will see broader use in oncology, neurosurgery, and cardiovascular procedures to support precision-guided interventions.
- Expansion of clinical applications in dermatology, neurology, and cardiology will diversify revenue streams for manufacturers.
- Increased investments in photonics research will accelerate advancements in imaging depth, speed, and sensitivity.
- Cloud-connected imaging workflows will streamline data sharing, remote diagnostics, and telemedicine integration.
- Emerging markets in Asia-Pacific and Latin America will witness faster adoption due to expanding healthcare modernization.
- Competitive dynamics will intensify as leading players focus on hybrid imaging platforms, AI integration, and software-driven value enhancements.


