
Asia Pacific Diagnostic Imaging Devices Market Overview:
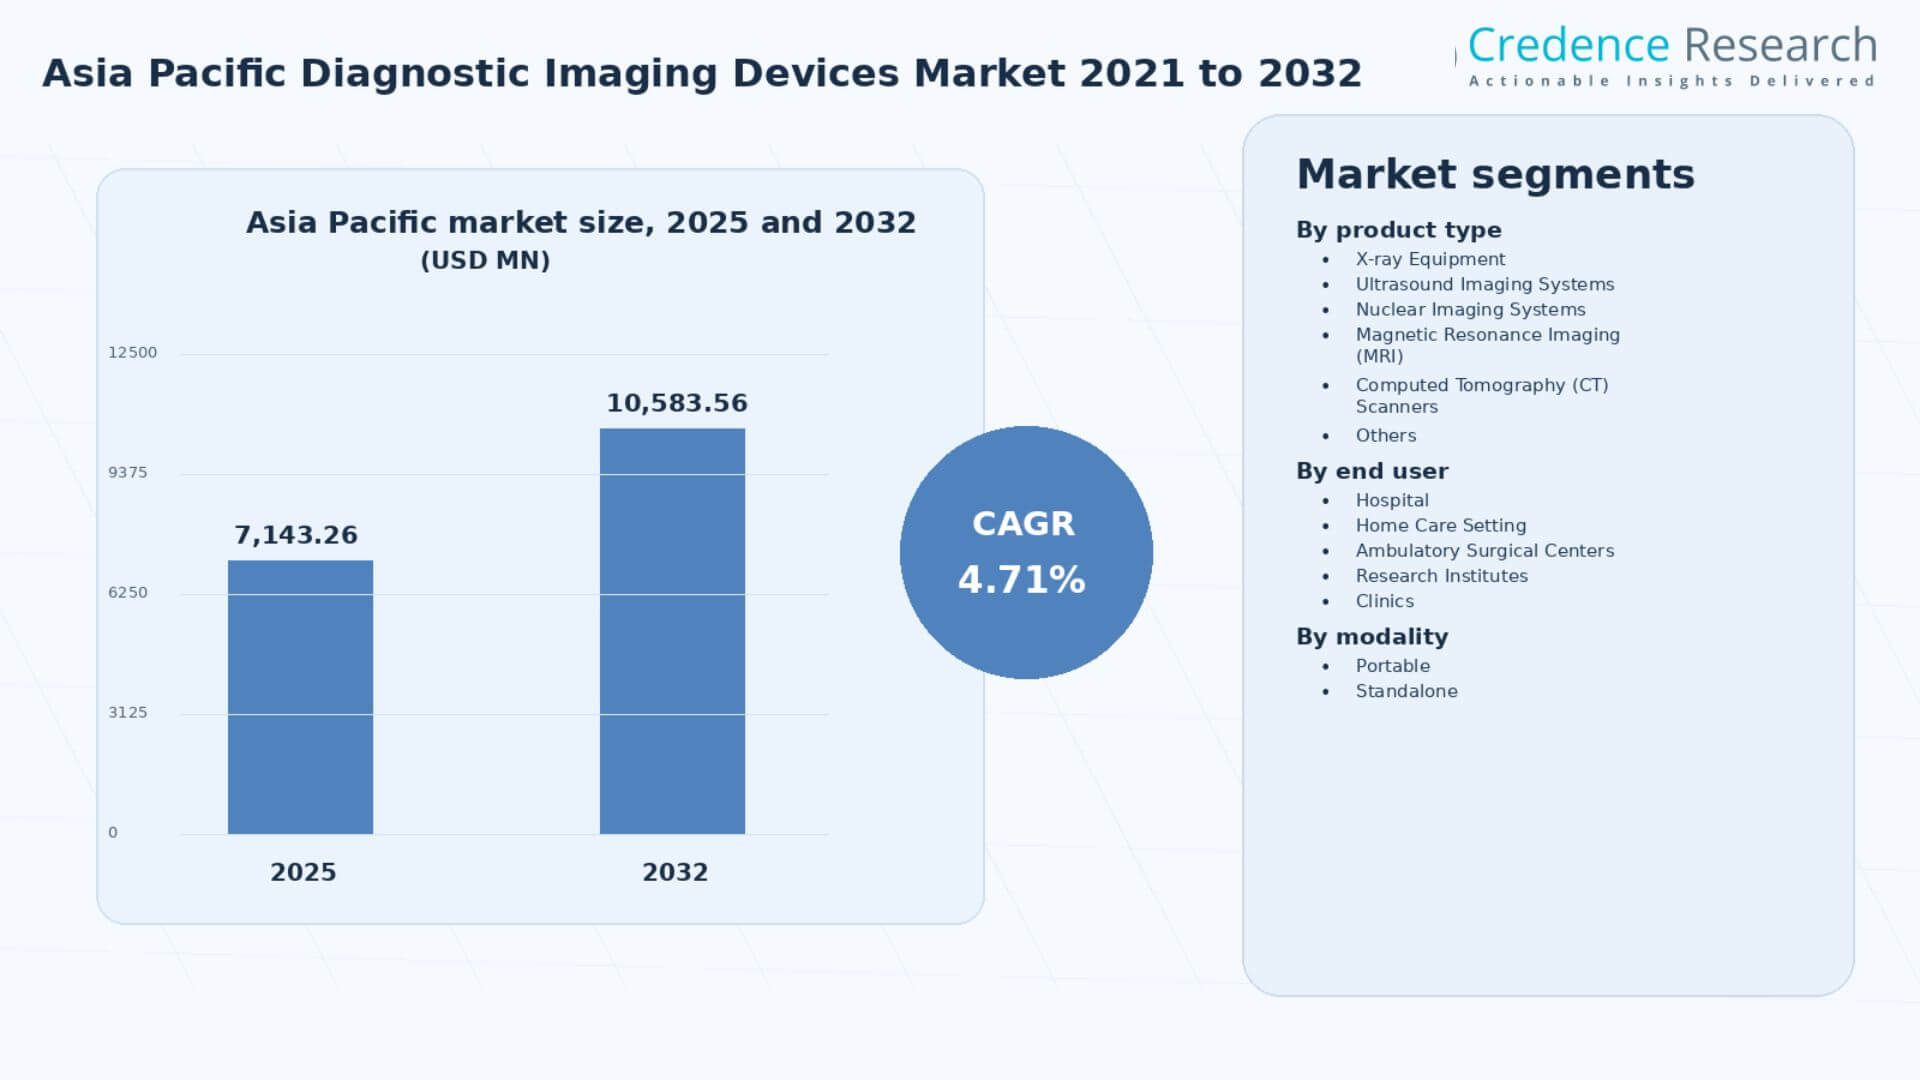
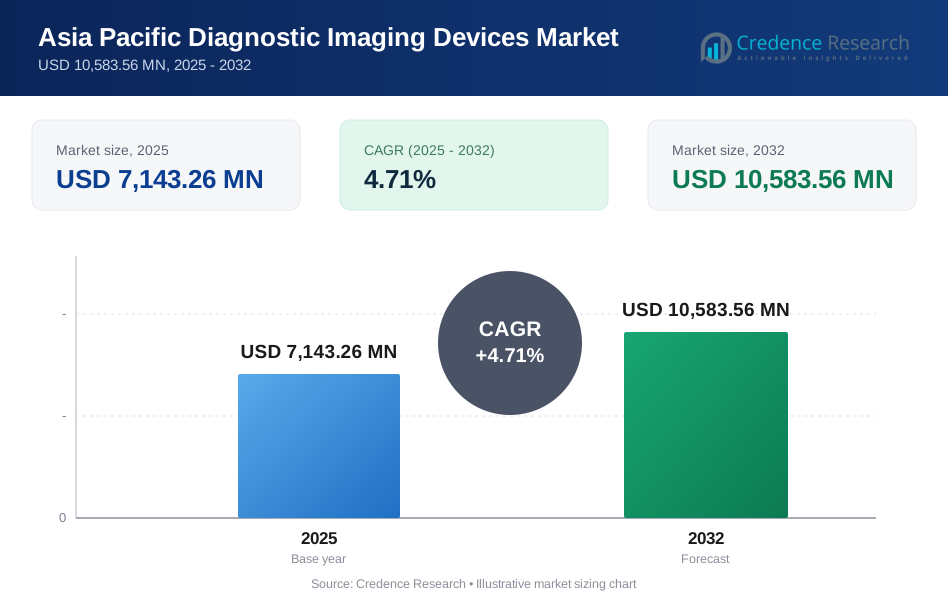
The Asia Pacific Diagnostic Imaging Devices Market size was valued at USD 5,593.99 MN in 2021 and reached USD 7,143.26 MN in 2025. It is anticipated to reach USD 10,583.56 MN by 2032, growing at a CAGR of 4.71% during the forecast period.
| REPORT ATTRIBUTE | DETAILS |
|---|---|
| Historical Period | 2021-2024 |
| Base Year | 2025 |
| Forecast Period | 2025-2032 |
| Asia Pacific Diagnostic Imaging Devices Market Size 2025 | USD 7,143.26 million |
| Asia Pacific Diagnostic Imaging Devices Market, CAGR | 4.71% |
| Asia Pacific Diagnostic Imaging Devices Market Size 2032 | USD 10,583.56 million |
Asia Pacific Diagnostic Imaging Devices Market Insights
- Market growth is supported by rising cancer diagnosis needs, hospital imaging upgrades, CT and MRI capacity expansion, ultrasound adoption, portable modality demand and AI-enabled imaging workflows.
- Computed Tomography (CT) Scanners hold a strong position because CT supports emergency care, oncology staging, trauma assessment, cardiovascular imaging and infectious disease evaluation.
- Ultrasound Imaging Systems are gaining momentum due to broad use in obstetrics, cardiology, abdominal imaging, point-of-care settings and outpatient clinics.
- Hospitals remain the leading end-user segment because advanced diagnostic imaging devices require radiology departments, trained operators, image storage systems, service contracts and reimbursement coordination.
Asia Pacific Diagnostic Imaging Devices Market Segment Insights
By product type
By product type, Computed Tomography (CT) Scanners held a strong position in 2025 because hospitals and diagnostic centers use CT for emergency diagnosis, oncology staging, stroke evaluation, trauma care, chest imaging and cardiovascular assessment. Magnetic Resonance Imaging (MRI) remains a high-value category due to strong use in neurology, oncology, orthopedics and cardiovascular imaging. X-ray Equipment remains a high-volume modality because it supports first-line screening, trauma assessment, chest imaging and outpatient diagnostics. Ultrasound Imaging Systems are expanding due to portability, real-time visualization, lower radiation concerns and broad use in maternal care, abdominal imaging and cardiology. Nuclear Imaging Systems remain important for oncology, cardiology and metabolic assessment. Others include mammography, fluoroscopy, hybrid imaging support and image-guided systems.
By end user
By end user, Hospital held the strongest position in 2025 because advanced imaging systems require dedicated radiology infrastructure, trained technologists, radiologists, shielding, installation support, service contracts and integration with hospital information systems. Clinics support X-ray, ultrasound and selected portable imaging demand due to outpatient diagnostics and primary care referrals. Ambulatory Surgical Centers are gaining relevance as outpatient procedures require intraoperative imaging, ultrasound guidance and C-arm support. Research Institutes use advanced imaging systems for clinical trials, AI development and biomedical research. Home Care Setting remains smaller but is gaining relevance through portable ultrasound, remote monitoring-linked imaging and post-acute care models.
By modality
By modality, Standalone held the strongest position in 2025 because MRI, CT, nuclear imaging and high-throughput X-ray systems require fixed installation, controlled rooms, shielding, power systems and service infrastructure. Standalone systems dominate hospitals, large clinics and diagnostic centers where scan volume and image quality requirements are high. Portable modality demand is rising because hospitals, emergency departments, intensive care units, rural facilities and mobile care providers need flexible imaging access. Portable ultrasound, mobile X-ray and mobile CT systems support faster bedside diagnosis, outreach care and imaging access in underserved locations. Growth will depend on affordability, battery performance, image quality, AI support and connectivity.
Key Market Drivers
Cancer burden and advanced imaging demand
Cancer burden and advanced imaging demand represent major growth drivers for the Asia Pacific Diagnostic Imaging Devices Market. Cancer diagnosis and treatment planning depend heavily on CT, MRI, ultrasound, X-ray, nuclear imaging and image-guided workflows. WHO estimated that the Western Pacific Region recorded close to 6.8 million new cancer cases in 2022, while the WHO South-East Asia Region recorded 2.37 million new cases and 1.53 million deaths in 2022. This large disease burden supports demand for Computed Tomography (CT) Scanners, Magnetic Resonance Imaging (MRI), Ultrasound Imaging Systems, Nuclear Imaging Systems and hospital-based diagnostic imaging services. Growth will remain strongest in countries expanding oncology centers, cancer screening, radiotherapy planning, molecular imaging and image-guided treatment pathways.
Medical technology access and imaging capacity expansion
Medical technology access and imaging capacity expansion support market growth because Asia Pacific health systems need more diagnostic equipment to reduce waiting times, improve geographic access and support early disease detection. OECD/WHO reported that CT scanners and MRI units help doctors diagnose internal organs and body structures, while too few units can create access problems in geographic proximity or waiting times. The same report notes wide regional gaps in medical technology availability, with higher-income markets showing greater equipment availability than many lower-resource Asia Pacific countries. This driver supports Standalone systems, Hospital end users, Clinics, X-ray Equipment, CT Scanners and MRI. Expansion will depend on public hospital investment, reimbursement, service networks and trained imaging workforce availability.
Infectious disease diagnosis and chest imaging needs
Infectious disease diagnosis and chest imaging needs sustain demand for X-ray Equipment, CT Scanners and portable imaging devices across Asia Pacific. TB, pneumonia and respiratory infections require diagnostic workflows that often include chest radiography or CT when clinically indicated. WHO reported that the South-East Asia Region continues to account for more than one in every three new TB cases worldwide and identified India, Bangladesh, Myanmar and Thailand among global high TB burden countries in the region. WHO also noted that the South-East Asia Region accounted for more than 45% of the global TB burden in 2023 and highlighted upfront chest X-ray screening within strategies to strengthen pediatric TB diagnosis. This driver supports X-ray Equipment, Portable modality, Clinics and Hospitals.
AI-enabled imaging and vendor innovation
AI-enabled imaging and vendor innovation are strengthening replacement demand and premium system adoption. Manufacturers are embedding AI into CT, MRI, X-ray and ultrasound systems to improve workflow speed, image quality, scan consistency and radiologist productivity. Siemens Healthineers showcased a broad diagnostic imaging portfolio at AOCR 2025 in Chennai, including virtually helium-free 1.5T MAGNETOM Flow MRI, SOMATOM Pro.Pulse CT, MULTIX Impact E digital X-ray systems and AI-powered ACUSON ultrasound systems. Philips launched its AI-enabled CT 5300 at AOCR 2025 and showcased AI-driven solutions across MRI, CT, ultrasound and enterprise informatics portfolios. This driver supports MRI, CT Scanners, Ultrasound Imaging Systems, X-ray Equipment, Hospitals and Research Institutes.
Hospital and diagnostic center investment in high-value imaging systems
Hospital and diagnostic center investment in high-value imaging systems is accelerating market growth as providers expand scan capacity, replace aging systems and improve diagnostic throughput. GE HealthCare reported 2025 revenue of USD 20.6 billion, up 4.8%, with growth driven by Imaging, Pharmaceutical Diagnostics and Advanced Visualization Solutions. It also reported Imaging organic revenue of USD 9.195 billion in 2025, up 3.8%. Siemens Healthineers reported 6.5% comparable revenue growth in Imaging for fiscal 2025 and adjusted EBIT margin of 20.6%, indicating sustained global imaging demand. These company trends support CT Scanners, MRI, Ultrasound Imaging Systems, Hospitals and standalone modality upgrades.
Key Trends and Opportunities
Portable imaging expands access beyond radiology departments
Portable imaging is expanding access beyond radiology departments as hospitals, emergency rooms, ICUs, ambulatory care settings and rural facilities seek faster bedside diagnosis. Portable ultrasound and mobile X-ray systems support high-frequency examinations, while mobile CT systems support emergency, ICU and neurology use cases. Samsung launched the R20 ultrasound system in India in 2025, positioning it as a next-generation system with AI-driven technologies, advanced hardware and improved ergonomics. Portable modality growth will depend on image quality, battery life, wireless connectivity, AI tools, training and affordability. This trend supports Home Care Setting, Clinics, Hospitals and Ambulatory Surgical Centers.
AI and workflow automation become system differentiators
AI and workflow automation are becoming key differentiators in diagnostic imaging devices. Imaging departments face rising scan volumes, radiologist workload pressure and the need for consistent image quality. AI-enabled scan planning, image reconstruction, lesion detection, report support and workflow prioritization can help hospitals increase throughput and reduce repeat scans. GE HealthCare introduced advanced imaging solutions powered by NVIDIA technology in 2025, including imaging concepts across MRI, X-ray and ultrasound with edge AI and accelerated computing platforms. This trend supports Research Institutes, Hospitals, CT Scanners, MRI and Ultrasound Imaging Systems.
Local and regional manufacturing strengthens equipment availability
Local and regional manufacturing is strengthening equipment availability as Asia Pacific countries seek cost-effective diagnostic imaging supply, faster service support and reduced import dependence. India developed its first indigenous MRI machine, with installation at AIIMS Delhi for trials planned in 2025, according to India’s public broadcaster DD News. United Imaging Healthcare reported that Asia Pacific regional revenue grew by more than 40% in 2025 and that the launch of the uSONIQUE ultrasound series completed its imaging portfolio. This trend supports Standalone systems, Portable systems, Clinics, Hospitals and regional service networks.
Premium ultrasound and CT platforms gain traction
Premium ultrasound and CT platforms are gaining traction because providers need faster exams, better image resolution, AI support and lower operational burden. Canon Medical introduced Aplio beyond in 2025 as a premium ultrasound solution for demanding, high-throughput clinical environments, with AI-enabled tools and a compact, silent housing. Canon’s 2025 press releases also highlighted continued CT portfolio development and MRI innovation, including real-time cardiac scanning without breath-holding. This trend supports Ultrasound Imaging Systems, CT Scanners, MRI and Hospitals. Vendors with strong service, training and financing support will gain advantage.
Key Market Challenges
High equipment cost and reimbursement pressure
High equipment cost and reimbursement pressure remain major challenges for the Asia Pacific Diagnostic Imaging Devices Market. MRI, CT scanners, nuclear imaging systems and advanced ultrasound systems require high upfront capital, installation spending, shielding, facility modification, maintenance contracts and trained staff. Lower-resource markets may struggle to justify investment without reimbursement support or sufficient scan volume. Hospitals and clinics must balance equipment upgrades with budget limits, staffing constraints and patient affordability. Cost pressure is especially important in emerging markets where imaging access gaps remain wide. Vendors must offer financing, managed equipment services, refurbished options and value-tier systems to expand adoption.
Radiologist and technologist workforce shortages
Radiologist and technologist workforce shortages can limit effective device utilization. Diagnostic imaging growth requires trained radiologists, sonographers, radiographers, physicists, biomedical engineers and service personnel. Advanced MRI, nuclear imaging, CT protocols and AI-enabled systems require training and quality control. Shortages are more severe outside major urban hospitals, limiting the impact of equipment installation in rural or secondary facilities. Portable imaging can improve access, but it still requires operator training and remote reporting support. Health systems must invest in workforce development, teleradiology networks and standardized imaging protocols.
Regulatory, procurement and service complexity
Regulatory, procurement and service complexity can delay imaging device adoption. Hospitals must manage product approvals, tenders, import duties, installation planning, service contracts, cybersecurity, software updates and lifecycle compliance. Japan’s government procurement notices in 2025 included X-ray CT imaging devices and MRI and diagnostic imaging support network systems, showing the formal procurement complexity around advanced imaging equipment. Service complexity is also high because imaging systems require uptime, calibration, spare parts, engineer access and cybersecurity support. Vendors with local service networks and clear lifecycle support will be better positioned.
Uneven access across urban and rural markets
Uneven access across urban and rural markets remains a structural challenge. Large hospitals in China, Japan, South Korea, Australia, Singapore and India’s metropolitan centers can adopt advanced MRI, CT, nuclear imaging and AI-enabled systems more quickly. Rural hospitals, public clinics and smaller diagnostic centers often face capital limitations, workforce shortages and lower utilization. OECD/WHO noted that too few CT and MRI units can create access problems related to geographic proximity and waiting times. Portable systems, hub-and-spoke reporting models and regional public procurement will be essential to reduce the access gap.
Regional Analysis
China
China represents a major market within the Asia Pacific Diagnostic Imaging Devices Market due to its large hospital system, strong public procurement, domestic imaging manufacturers and expanding oncology, cardiovascular and emergency care demand. CT Scanners, MRI, Ultrasound Imaging Systems and X-ray Equipment remain core product categories. Domestic players such as United Imaging and Neusoft compete with global vendors across hospitals and diagnostic centers. United Imaging reported more than 40% year-over-year revenue growth in Asia Pacific in 2025 and expanded its ultrasound portfolio with uSONIQUE, strengthening its regional imaging platform. Growth will depend on procurement policy, hospital budgets, localization, service capability and AI-enabled system adoption.
Japan
Japan is a mature diagnostic imaging market supported by advanced hospitals, high CT and MRI utilization, strong regulatory quality and early adoption of premium imaging systems. OECD/WHO reported that Japan has very high medical technology availability compared with many Asia Pacific peers, including 57 MRI units per million population in the region’s medical technology comparison. Hospitals dominate demand for MRI, CT, nuclear imaging and high-end ultrasound systems. Clinics also support ultrasound and X-ray demand. Growth will depend on replacement cycles, aging population needs, AI workflow adoption, reimbursement and compact high-productivity systems.
India
India is an expanding market supported by rising hospital investment, cancer diagnosis needs, TB screening, private diagnostic center growth and local manufacturing initiatives. X-ray Equipment and Ultrasound Imaging Systems remain important for broad access, while CT and MRI demand is growing in tertiary hospitals and private diagnostic chains. India’s development of its first indigenous MRI machine for AIIMS Delhi trials signals growing national focus on lowering costs and reducing import dependence. Siemens Healthineers and Philips also used AOCR 2025 in Chennai to showcase advanced MRI, CT, X-ray and ultrasound technologies. Growth will depend on affordability, local service, reimbursement and skilled workforce availability.
South Korea
South Korea represents a high-value market supported by advanced hospitals, strong medical technology adoption, domestic ultrasound expertise and digital health infrastructure. Ultrasound Imaging Systems, CT Scanners, MRI and monitoring-linked diagnostic workflows are important categories. Samsung Medison strengthens the country’s role in ultrasound innovation, and Samsung introduced the AI-enabled R20 ultrasound system in 2025. Hospitals and Clinics remain key end users, while Research Institutes support imaging AI, radiology software and device development. Growth will depend on replacement cycles, export-oriented device innovation, hospital technology upgrades and integration with AI-enabled radiology workflows.
Australia and New Zealand
Australia and New Zealand represent mature diagnostic imaging markets supported by public reimbursement, advanced hospitals, private imaging centers and regulated device access. Australia’s Department of Health published Diagnostic Imaging Medicare quarterly statistics for the March quarter 2025–26, showing ongoing government tracking of diagnostic imaging utilization and reimbursement activity. CT Scanners, MRI, Ultrasound Imaging Systems and X-ray Equipment remain important across hospitals, clinics and ambulatory care settings. Growth will depend on Medicare eligibility, private imaging network investment, workforce availability, rural access needs and replacement of older systems.
Southeast Asia
Southeast Asia offers long-term growth potential as hospitals, private diagnostic centers and public health systems expand imaging infrastructure. Singapore leads in premium imaging adoption, while Thailand, Malaysia, Indonesia, Vietnam and the Philippines are increasing demand for CT, MRI, X-ray, ultrasound and portable imaging at different speeds. WHO states that diagnostic devices, including imaging devices, are critical enablers of universal health coverage in the South-East Asia Region. Growth will depend on affordability, tendering, public hospital investment, service infrastructure, trained radiology workforce and mobile imaging access in underserved areas.
Report Attribute Details
| Report Attribute | Details |
| Historical Period | 2021–2024 |
| Base Year | 2025 |
| Forecast Period | 2025–2032 |
| Market Size in 2021 | USD 5,593.99 MN |
| Market Size in 2025 | USD 7,143.26 MN |
| Market Size in 2032 | USD 10,583.56 MN |
| CAGR | 4.71% |
| Segments Covered | Product Type, End User, Modality and Geography |
| Key Companies Covered | General Electric Company, Hitachi Ltd., Hologic, Inc., Koninklijke Philips N.V., Samsung Medison Co., Ltd., Shimadzu Medical Pvt. Ltd., CANON MEDICAL SYSTEM CORPORATION, ESAOTE SPA, Allengers, Siemens Healthcare Private Limited, Neusoft Corporation, NP JSC AMICO and Shanghai Lianying Medical Technology Co., Ltd. |
Asia Pacific Diagnostic Imaging Devices Market Segmentations
By Product Type
- X-ray Equipment
- Ultrasound Imaging Systems
- Nuclear Imaging Systems
- Magnetic Resonance Imaging (MRI)
- Computed Tomography (CT) Scanners
- Others
By End User
- Hospital • Home Care Setting • Ambulatory Surgical Centers • Research Institutes • Clinics
By Modality
- Portable
- Standalone
Key players
- General Electric Company
- Hitachi Ltd.
- Hologic, Inc.
- Koninklijke Philips N.V.
- Samsung Medison Co., Ltd.
- Shimadzu Medical Pvt. Ltd.
- CANON MEDICAL SYSTEM CORPORATION
- ESAOTE SPA
- Allengers
- Siemens Healthcare Private Limited
- Neusoft Corporation
- NP JSC AMICO
- Shanghai Lianying Medical Technology Co., Ltd.
Recent Developments
- In 2025, Siemens Healthineers showcased diagnostic imaging solutions at AOCR 2025 in Chennai, including MAGNETOM Flow MRI, SOMATOM Pro.Pulse CT, MULTIX Impact E digital X-ray systems and AI-powered ACUSON ultrasound systems.
- In 2025, Philips launched its AI-enabled CT 5300 at AOCR 2025 and showcased AI-driven MRI, CT, ultrasound and enterprise informatics solutions for the Indian subcontinent.
- In February 2025, Canon Medical introduced Aplio beyond, a premium ultrasound solution for demanding, high-throughput clinical environments with AI-enabled tools.
- In 2025, Samsung introduced the R20 Ultrasound System with AI-driven technologies and advanced hardware to improve ultrasound imaging performance and precision.
- In 2025, United Imaging Healthcare reported Asia Pacific revenue growth of more than 40% and launched the uSONIQUE ultrasound series, completing its imaging portfolio.
Report Coverage
The research report offers an in-depth analysis based on product type, end user, modality and geography. It details leading market players, providing an overview of their business positioning, diagnostic imaging portfolios, X-ray systems, ultrasound imaging systems, nuclear imaging systems, MRI systems, CT scanners, portable systems, standalone equipment, AI-enabled imaging tools and strategic relevance in the Asia Pacific Diagnostic Imaging Devices Market. The report includes insights into the competitive environment, market trends, growth drivers, restraints and opportunities. It also examines cancer burden, TB screening needs, hospital imaging upgrades, medical technology access gaps, AI-enabled imaging innovation, portable modality expansion, local manufacturing and procurement complexity as major factors shaping market development. The report assesses the impact of high equipment cost, reimbursement pressure, workforce shortages, installation requirements, regulatory complexity, service limitations and uneven rural access on market growth. It provides strategic recommendations for diagnostic imaging device manufacturers, hospitals, clinics, ambulatory surgical centers, research institutes, distributors, investors and new entrants seeking to navigate Asia Pacific’s diagnostic imaging devices ecosystem.
Future Outlook
- Demand for diagnostic imaging devices will continue to rise as Asia Pacific health systems expand early diagnosis, cancer care, emergency medicine and chronic disease management.
- CT Scanners will remain a major product category due to use in emergency care, oncology staging, trauma, stroke and respiratory disease evaluation.
- MRI will remain a high-value segment due to neurology, oncology, orthopedics and cardiovascular imaging demand.
- Ultrasound Imaging Systems will gain momentum through portability, lower radiation concerns, point-of-care use and AI-enabled workflow tools.
- X-ray Equipment will remain a high-volume modality because it supports first-line screening, chest imaging and outpatient diagnostics.
- Nuclear Imaging Systems will support oncology, cardiology and metabolic disease assessment in advanced hospitals.
- Hospitals will remain the leading end-user segment due to advanced infrastructure, radiology departments and high scan volumes.
- Clinics and Ambulatory Surgical Centers will gain relevance as imaging shifts closer to outpatient and procedural care settings.
- Portable modality will grow as hospitals, rural facilities and mobile care providers seek flexible bedside diagnostic access.
- Competition will increase as companies compete on AI capabilities, image quality, service uptime, financing models, regional manufacturing, compact design and training support.
Request a Free Sample
Fill in your details and we'll send you a free sample report.
- Sample data tables & charts
- Research methodology
Need a Custom Version of This Report?
Tailor the scope, geography, or segments to your exact requirements.
- Custom geography or segment scope
- Direct access to our analyst team
Frequently Asked Questions
What is the current market size for the Asia Pacific Diagnostic Imaging Devices Market and what is its projected size in 2032?
At what CAGR is the Asia Pacific Diagnostic Imaging Devices Market projected to grow?
Which product type segment is expected to hold strong demand?
Which modality leads the market?
Which end-user segment leads the market?
Who are the leading companies in the market?
Which countries are important in the Asia Pacific market?
Table of Content
Chapter 1. Report Introduction
- 1.1 Report Description & Purpose
- 1.1.1 Report Title & Market Definition
- 1.1.2 Unique Selling Propositions (USP) & Key Differentiators
- 1.1.3 Value Proposition for Stakeholders
- 1.2 Research Objectives
- 1.2.1 Market Sizing Objectives (Volume & Revenue)
- 1.2.2 Segmentation Objectives
- 1.2.3 Competitive Intelligence Objectives
- 1.2.4 Forecast & Scenario Objectives
- 1.3 Report Scope
- 1.3.1 Asia Pacific Diagnostic Imaging Devices Scope – Types & Subtypes Covered
- 1.3.2 Geographic Scope – Regions & Countries Covered
- 1.3.3 Historical Period, Base Year & Forecast Period (2025; forecast to 2032)
- 1.3.4 Inclusions & Exclusions
- 1.4 HS Code & Classification Framework
- 1.5 Currency, Units & Pricing Basis
- 1.6 Target Stakeholders
- 1.7 Limitations & Assumptions
Chapter 2. Executive Summary
- 2.1 Global Asia Pacific Diagnostic Imaging Devices Market Snapshot
- 2.1.1 Market Size – Historical (2025) & Forecast (2025-2032) (2025: USD 7,143.26 MN → 2032: USD 10,583.56 MN)
- 2.1.2 Volume & Revenue – Global Totals
- 2.1.3 Key Market Highlights – Top Five Facts
- 2.2 Asia Pacific Diagnostic Imaging Devices Market Segmentation Snapshot
- 2.2.1 Market Split by Region – 2025 vs. 2032
- 2.3 Competitive Snapshot
- 2.3.1 Top 10 Players by Revenue Share – 2025
- 2.3.2 Top 10 Players by Volume Share – 2025
- 2.3.3 Recent Strategic Developments (18-Month Summary)
- 2.4 Key Investment Highlights & Strategic Conclusions
Chapter 3. Asia Pacific Diagnostic Imaging Devices Market Dynamics & Industry Analysis
- 3.1 Market Overview & Context
- 3.1.1 Asia Pacific Diagnostic Imaging Devices Market Position in the Broader Automotive Value Chain
- 3.1.2 OEM vs. Replacement Market Dynamics
- 3.1.3 Market Maturity & Development Stage by Region
- 3.2 Asia Pacific Diagnostic Imaging Devices Market Drivers
- 3.3 Asia Pacific Diagnostic Imaging Devices Market Restraints & Challenges
- 3.4 Asia Pacific Diagnostic Imaging Devices Market Opportunities
- 3.5 Porter's Five Forces Analysis
- 3.5.1 Threat of New Entrants
- 3.5.2 Bargaining Power of Suppliers
- 3.5.3 Bargaining Power of Buyers
- 3.5.4 Threat of Substitutes
- 3.5.5 Competitive Rivalry – Intensity Assessment
- 3.6 Asia Pacific Diagnostic Imaging Devices Value Chain Analysis
- 3.6.1 Upstream – Raw Material/Input Suppliers
- 3.6.1.1 Raw Material/Input 1
- 3.6.1.2 Raw Material/Input 2
- 3.6.1.3 Raw Material/Input 3
- 3.6.2 Midstream – Production/Manufacturing/Service Delivery
- 3.6.2.1 Production/Process Overview
- 3.6.2.2 Key Facility Locations & Capacity by Manufacturer
- 3.6.3 Downstream – Distribution & End Consumer
- 3.6.3.1 Primary Channel – B2B/OEM
- 3.6.3.2 Secondary Channels – Dealer, Retail, Online, Direct
- 3.6.4 Value Chain Profitability Analysis
- 3.6.1 Upstream – Raw Material/Input Suppliers
- 3.7 PESTEL Analysis
- 3.7.1 Political Factors
- 3.7.2 Economic Factors
- 3.7.3 Social Factors
- 3.7.4 Technological Factors
- 3.7.5 Environmental Factors
- 3.7.6 Legal Factors
- 3.8 Asia Pacific Diagnostic Imaging Devices Supply Chain Analysis
- 3.8.1 Raw Material/Input Supply Risk Assessment
- 3.8.2 Manufacturing Concentration Risk (Geographic Exposure)
- 3.8.3 Trade Disruption Impact Analysis
- 3.9 Regulatory & Policy Landscape
Note: The regulatory and policy landscape section covers regulations based on their applicability to the market, Asia Pacific Diagnostic Imaging Devices category, geography, and scope of the study. Only regulatory frameworks with a material impact on operations, compliance, trade, sustainability, or market access are analyzed in detail.
Chapter 4. Key Investment Pockets & Opportunity Analysis
- 4.1 Asia Pacific Diagnostic Imaging Devices Market Attractiveness Analysis
- 4.1.1 By Region – Investment Attractiveness Matrix (Volume × CAGR)
- 4.2 Absolute Revenue Growth Opportunity
- 4.2.1 By Region – Absolute USD Growth Through 2032
- 4.3 Incremental Volume Opportunity
- 4.3.1 By Region – Incremental Volume Through 2032
- 4.3.2 Segment – Incremental Volume
- 4.4 Emerging Submarket Opportunity Deep Dive (Subject to Applicability)
- 4.5 Emerging Market Opportunity Scorecards
- 4.5.1 United States
- 4.5.2 Europe
- 4.5.3 Asia
- 4.5.4 Middle East & Africa
Note: Emerging Market Opportunity Scorecards will be included based on relevance and strategic importance. Regions listed are indicative and may vary depending on data availability and market dynamics.
Chapter 5. Asia Pacific Diagnostic Imaging Devices Import-Export Analysis & Trade Flows
- 5.1 Global Trade Overview
- 5.1.1 Global Export Value by Country (2025)
- 5.1.2 Global Export Volume by Country (2025)
- 5.1.3 Global Import Value by Country (2025)
- 5.1.4 Global Import Volume by Country (2025)
- 5.1.5 Net Trade Balance by Country (2025)
- 5.2 Export Analysis – Segment
- 5.2.1 Type 1 (HS Code)
- 5.2.2 Type 2 (HS Code)
- 5.2.3 Type 3 (HS Code)
- 5.2.4 Type 4 (HS Code)
- 5.2.5 Type 5 (HS Code)
- 5.3 Import Analysis – Segment
- 5.3.1 Type 1 (HS Code)
- 5.3.2 Type 2 (HS Code)
- 5.3.3 Type 3 (HS Code)
- 5.3.4 Type 4 (HS Code)
- 5.3.5 Type 5 (HS Code)
- 5.4 Average Unit Trade Prices
- 5.4.1 Average Export Price – Segment & Country
- 5.4.2 Average Import Price – Segment & Source Country
- 5.4.3 Price Trends (2025)
- 5.5 Key Trade Route Analysis
- 5.5.1 Trade Route 1
- 5.5.2 Trade Route 2
- 5.5.3 Trade Route 3
- 5.5.4 Trade Route 4
- 5.5.5 Trade Route 5
- 5.6 Trade Policy Impact Assessment
- 5.6.1 US Anti-Dumping & Section 301 Tariffs
- 5.6.2 EU Customs Union Impact
- 5.6.3 Major Free Trade Agreements
- 5.6.4 USMCA Rules of Origin
Note: Trade policy analysis will be included only where relevant to the Asia Pacific Diagnostic Imaging Devices market.
Chapter 6. Competitive Landscape & Company Benchmarking
- 6.1 Asia Pacific Diagnostic Imaging Devices Market Concentration & Structure
- 6.1.1 Herfindahl-Hirschman Index (HHI) – vs. 2025
- 6.1.2 Tier 1, Tier 2 & Tier 3 Market Structure
- 6.1.3 Global, Regional & Local Player Dynamics
- 6.2 Asia Pacific Diagnostic Imaging Devices Market Share Analysis – 2025
- 6.2.1 Global Revenue Share by Company
- 6.2.2 Global Volume Share by Company
- 6.2.3 Regional Revenue Share
- 6.2.4 Market Share Evolution ( vs. 2025)
- 6.2.5 OEM Segment Share by Company
- 6.2.6 Replacement Segment Share by Company
- 6.3 Production/Delivery Capacity & Facility Analysis
- 6.3.1 Global Installed Capacity
- 6.3.2 Capacity Utilization Rates
- 6.3.3 Production/Output Volume
- 6.3.4 Facility Locations & Capacity Map
- 6.3.5 Planned Capacity Additions
- 6.4 Asia Pacific Diagnostic Imaging Devices Competitive Benchmarking Matrix
- 6.4.1 Revenue, Volume, CAGR & Profitability Comparison
- 6.4.2 Channel Revenue Mix
- 6.4.3 Geographic Revenue Exposure
- 6.4.4 R&D Intensity
- 6.4.5 Sustainability Maturity
- 6.5 Strategic Developments in Asia Pacific Diagnostic Imaging Devices (Last 24 Months)
- 6.5.1 Mergers, Acquisitions & Divestments
- 6.5.2 New Asia Pacific Diagnostic Imaging Devices Launches
- 6.5.3 Facility Expansions
- 6.5.4 Strategic Alliances, Joint Ventures & Partnerships
- 6.5.5 Distribution Expansion & Market Entry
- 6.5.6 Sustainability & ESG Initiatives
- 6.6 Competitive Strategy Mapping
- 6.6.1 Leader, Challenger, Follower & Niche Classification
- 6.6.2 Pricing Strategy Comparison
- 6.6.3 Channel Strategy Matrix
Note: Strategic developments are included based on their materiality and the availability of reliable information.
Chapter 7. Global Asia Pacific Diagnostic Imaging Devices Market – By Distribution Channel
- 7.1 Segment Overview
- 7.1.1 Volume & Revenue Split by Channel (2025 & 2032)
- 7.1.2 Channel Mix Evolution (2025-2032)
Chapter 8. Regional Market Analysis – Global Overview
- 8.1 Global Regional Overview
- 8.1.1 Regional Volume Share
- 8.1.2 Regional Revenue Share
- 8.1.3 Regional Volume by Region
- 8.1.4 Regional Revenue by Region
- 8.1.5 Regional Forecast Through 2032
- 8.2 Cross-Regional Segment Analysis
- 8.2.1 By Distribution Channel
- 8.2.2 By Brand/Price Tier
Chapter 9. North America Asia Pacific Diagnostic Imaging Devices Market
- 9.1 United States
- 9.2 Canada
- 9.3 Mexico
Chapter 10. Europe Asia Pacific Diagnostic Imaging Devices Market
- 10.1 Germany
- 10.2 France
- 10.3 Italy
- 10.4 United Kingdom
- 10.5 Spain
- 10.6 Poland
- 10.7 Russia
- 10.8 Netherlands
- 10.9 Belgium
- 10.10 Sweden
- 10.11 Denmark
- 10.12 Norway
- 10.13 Rest of Europe
Chapter 11. Asia Pacific Asia Pacific Diagnostic Imaging Devices Market
- 11.1 China
- 11.2 India
- 11.3 Japan
- 11.4 South Korea
- 11.5 Thailand
- 11.6 Indonesia
- 11.7 Vietnam
- 11.8 Malaysia
- 11.9 Australia
- 11.10 Rest of Asia Pacific
Chapter 12. Latin America Asia Pacific Diagnostic Imaging Devices Market
- 12.1 Brazil
- 12.2 Argentina
- 12.3 Colombia
- 12.4 Chile
- 12.5 Rest of Latin America
Chapter 13. Middle East Asia Pacific Diagnostic Imaging Devices Market
- 13.1 Saudi Arabia
- 13.2 United Arab Emirates
- 13.3 Turkey
- 13.4 Israel
- 13.5 Iran
- 13.6 Rest of the Middle East
Chapter 14. Africa Asia Pacific Diagnostic Imaging Devices Market
- 14.1 South Africa
- 14.2 Egypt
- 14.3 Nigeria
- 14.4 Morocco
- 14.5 Rest of Africa
Chapter 15. Asia Pacific Diagnostic Imaging Devices Company Profiles
- 15.1 [Company 01]
- 15.1.1 Company Overview
- 15.1.2 Key Management Personnel
- 15.1.3 Products & Services Portfolio
- 15.1.4 Financial Performance
- 15.1.5 Key Market Focus & Geographic Presence
- 15.1.6 Recent Developments & Strategic Initiatives
Note: The company profile list is preliminary and may change based on research findings, market developments, data availability, and client requirements.
Chapter 16. Appendices
- Appendix A – List of Abbreviations & Acronyms
- Appendix B – Industry Classification Code Reference – Full Series
- Appendix C – Production & Capacity Data Tables
- Appendix D – End-Use & Demand Base Tables
- Appendix E – Consumption & Replacement Rate Assumptions
- Appendix F – ASP Reference Tables
- Appendix G – Manufacturing & Facility Database
- Appendix H – Import-Export Data Tables
- Appendix I – Regulatory Summary Tables
- Appendix J – Primary Research Participant List (Anonymized)
- Appendix K – Primary Research Questionnaire Framework
- Appendix L – Data Sources & Bibliography
- Appendix M – Market Size Divergence & Source Comparison
Chapter 17. Research Methodology
- 17.1 Research Framework & Philosophy
- 17.2 Secondary Research – Sources, Hierarchy & Data Extraction
- 17.3 Data Modeling – Bottom-Up & Top-Down Market Sizing
- 17.4 Primary Research – Stakeholder Framework, LOI & Sample Sizes
- 17.5 Forecast Methodology – Regression, Scenario & Sensitivity Analysis
- 17.6 Quality Control – Four-Layer Validation Framework
- 17.7 Limitations & Standard Assumptions
- 17.8 Disclaimer
