Market Overview
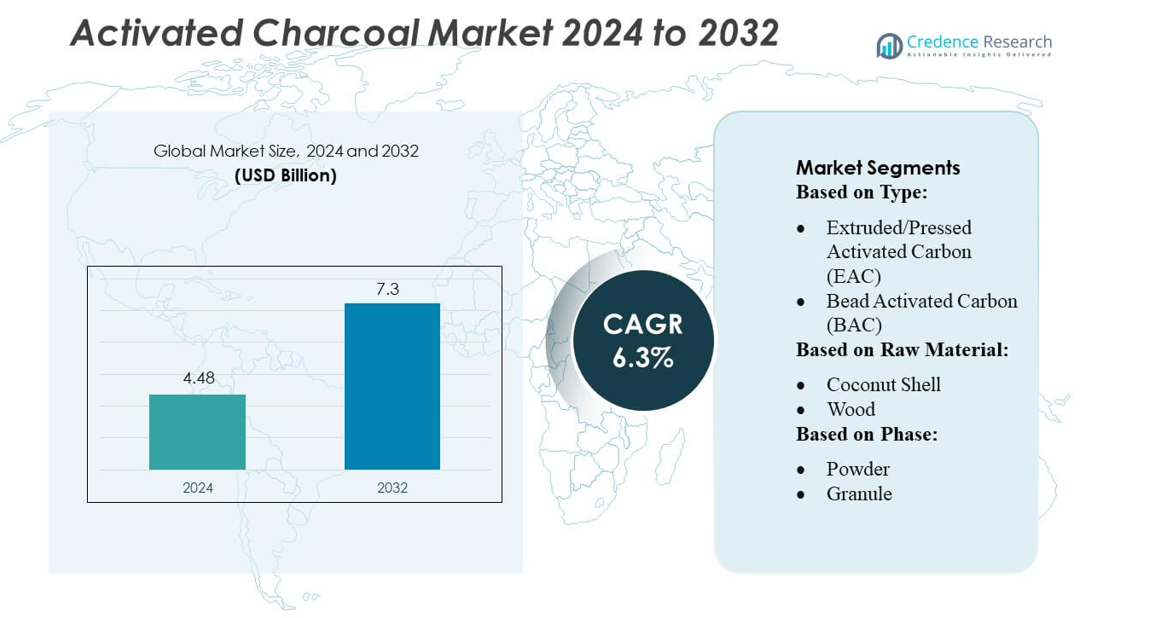
Activated Charcoal Market size was valued USD 4.48 billion in 2024 and is anticipated to reach USD 7.3 billion by 2032, at a CAGR of 6.3% during the forecast period.
| REPORT ATTRIBUTE |
DETAILS |
| Historical Period |
2020-2023 |
| Base Year |
2024 |
| Forecast Period |
2025-2032 |
| Activated Charcoal Market Size 2024 |
USD 4.48 billion |
| Activated Charcoal Market, CAGR |
6.3% |
| Activated Charcoal Market Size 2032 |
USD 7.3 billion |
The activated charcoal market include Kuraray Co., Ltd., Cabot Corporation, Calgon Carbon Corporation, Jacobi Carbons AB, Haycarb PLC, and Donau Carbon GmbH. These players strengthen their positions through broad product portfolios, strong distribution networks, and steady investments in advanced filtration technologies. Asia-Pacific remains the leading regional market, holding 46.8% of global share, driven by rapid industrial growth, rising water treatment needs, and expanding pharmaceutical and food-processing applications.
Market Insights
- The activated charcoal market was valued at USD 4.48 billion in 2024 and is projected to reach USD 7.3 billion by 2032, registering a CAGR of 6.3% during the forecast period.
- Growing demand for water and wastewater treatment, rising use in air purification systems, and expanding applications in pharmaceuticals and food processing continue to drive market growth.
- Increasing adoption of high-performance activated carbon grades and the shift toward sustainable, coconut-shell-based products represent key market trends supporting long-term expansion.
- The competitive landscape remains consolidated, with Kuraray, Cabot, Calgon Carbon, Jacobi Carbons, Haycarb, and Donau Carbon leading through strong product portfolios and global distribution networks, while price volatility of raw materials acts as a major restraint.
- Asia-Pacific dominates the market with 46.8% share, supported by industrial development, while coconut-shell-based activated carbon remains the leading segment due to high adsorption efficiency and growing preference in water treatment applications.
Access crucial information at unmatched prices!
Request your sample report today & start making informed decisions powered by Credence Research Inc.!
Download Sample
Market Segmentation Analysis:
By Type
The powdered activated carbon (PAC) segment dominates the Activated Charcoal Market, accounting for the largest share due to its extensive adoption in water purification, air treatment, and industrial effluent management. Coal-based PAC leads within this category, supported by its high adsorption capacity, cost-effectiveness, and wide availability for large-scale purification systems. Granular activated carbon (GAC) is witnessing steady demand, particularly coconut shell–based GAC, driven by its higher micro-porosity and suitability for drinking water filtration. Emerging segments such as extruded, bead, and impregnated activated carbon continue to gain traction in niche applications, including gas-phase treatment and mercury removal.
- For instance, Boyce Carbon’s water‑treatment grade GAC — under product codes like BWT 8×16, BWT 8×30, and BWT 12×40 — is specified with a surface area of about 1,100–1,150 m²/g (by BET method) and iodine adsorption number of around 1,050–1,100 mg/g, demonstrating very high adsorption potential for organic contaminants and micropollutants.
By Raw Material
Coal remains the dominant raw material segment, capturing the largest market share owing to its global availability, consistent pore structure, and suitability for manufacturing both PAC and GAC at scale. Bituminous coal, in particular, leads due to its high carbon content and efficient activation potential. Coconut shell–based activated carbon forms a fast-growing sub-segment, driven by increasing preference for renewable and high-hardness materials in food, beverage, and pharmaceutical applications. Wood- and peat-based materials serve specialized uses requiring specific pore-size distributions, while nutshell-derived carbons support sustainable, low-ash filtration solutions.
- For instance, CarboTech produces an extruded activated carbon — CarboTech DGF 4 — derived from bituminous coal that exhibits a BET surface area of 850 m²/g, an apparent density of 490 kg/m³ (±30), a CTC number not less than 50%, ash content around 10%, moisture content up to 8%, and a hardness of 97% — parameters that make it particularly effective for gas‑phase adsorption applications, especially for removal of organic trace gases.
By Phase
The powder phase holds the largest market share and remains the dominant segment, primarily because powdered activated carbon provides rapid adsorption kinetics and flexible dosing in municipal water treatment and industrial processes. Granular forms follow, supported by strong demand in fixed-bed filters and vapor-phase adsorption systems. Pelletized activated carbon is expanding in applications requiring controlled pressure drop and mechanical strength, particularly in air purification. Liquid-suspension activated carbon and carbon cloth represent smaller yet growing segments, driven by advancements in specialty filtration, medical uses, and high-performance environmental remediation solutions.
Key Growth Drivers
Rising Demand for Water and Wastewater Treatment
The activated charcoal market grows strongly as governments and industries prioritize water purification and wastewater management. Municipal utilities and manufacturing facilities increasingly adopt activated carbon filtration to meet stringent environmental regulations on contaminants such as organic chemicals, PFAS, and heavy metals. The material’s high adsorption efficiency and cost-effectiveness strengthen its adoption across large-scale filtration systems. Expanding industrialization in emerging economies further accelerates demand, positioning activated charcoal as a critical component in global water treatment infrastructure.
- For instance, Cabot’s granular activated carbon grades — such as HYDRODARCO® 4000 and NORIT® GAC 400 — are explicitly designed for removal of poly‑ and perfluoroalkyl substances (PFAS) including PFOA and PFOS from potable water.
Expansion of Pharmaceutical and Healthcare Applications
Pharmaceutical companies increasingly use activated charcoal in drug formulations, detoxification treatments, and poisoning management, creating a substantial growth driver. Rising concerns about gastrointestinal disorders, increasing OTC detox products, and greater awareness of toxin removal enhance product uptake. Hospitals and emergency care centers rely on activated charcoal due to its ability to adsorb a wide range of toxins effectively. The expanding pharmaceutical industry across Asia-Pacific and growing R&D investments in new medical-grade activated carbon further boost market growth.
- For instance, Jacobi’s water‑treatment focused GAC product under its AquaSorb™ line includes grades such as the “HS‑12×40” (coconut‑shell based) that specify a BET surface area of about 1,050 m²/g, a minimum iodine number of 1,000 mg/g, maximum ash content 2%, moisture (as packed) ≤ 5%, and ball‑pan hardness of at least 97%.
Growth in Food & Beverage and Air Purification Uses
Activated charcoal demand rises as the food and beverage industry adopts it for deodorization, decolorization, and purification processes. Increasing focus on food safety, sugar refining, and beverage filtration supports wider integration. Simultaneously, the air purification segment gains momentum due to rising urban pollution, indoor air quality concerns, and stricter emissions standards. Activated carbon filters, used in HVAC systems, industrial exhaust treatment, and consumer air purifiers, drive sustained market expansion across both residential and industrial sectors.
Key Trends & Opportunities
Advancements in Sustainable and Bio-based Activated Carbon
Manufacturers increasingly innovate with bio-based raw materials such as coconut shells, bamboo, and agricultural waste to meet sustainability goals. This shift aligns with global circular economy trends and reduces reliance on coal-based activated carbon. Sustainable production methods not only lower environmental footprints but also unlock new opportunities in eco-conscious applications like organic food processing and green consumer products. Companies adopting renewable feedstocks gain a competitive edge as environmental compliance and carbon-neutral targets become more stringent worldwide.
- For instance, Donau Carbon lists for coconut‑shell‑based activated carbon a BET surface area in the range of 700–1,100 m²/g, and a bulk density between 470–570 kg/m³ (particle size typically 2‑4 mm) — metrics that indicate a high internal surface area combined with a density conducive for gas‑phase adsorption.
Technological Innovations in Regeneration and Reactivation
Growing emphasis on cost efficiency and waste reduction drives innovations in activated carbon regeneration technologies. Advanced thermal reactivation, microwave regeneration, and chemical recovery methods improve adsorption cycles, enabling multiple reuse cycles and lowering total operational costs. These developments create opportunities for industrial users in water treatment, mining, and chemical processing to optimize filtration systems. Enhanced regeneration efficiency also supports the adoption of activated carbon in regions with high environmental standards, expanding long-term market potential.
- For instance, Kuraray states that using reactivated carbon (instead of producing virgin activated carbon) reduces CO₂ emissions by about 80%, while still restoring adsorption performance — including for challenging contaminants such as PFAS.
Increasing Adoption in Emerging Consumer Products
Activated charcoal is increasingly incorporated into personal care and wellness products such as skincare formulations, dental products, detox supplements, and cosmetics. Rising consumer interest in natural ingredients and toxin-removal benefits drives this trend. Brands leverage activated charcoal’s strong adsorption capability to position products as effective and safe for daily use. This broadening of application scope presents significant opportunities for manufacturers to tap into high-margin consumer markets, particularly in beauty and wellness sectors.
Key Challenges
Volatility in Raw Material Prices and Supply Constraints
Fluctuating availability of raw materials such as coal, coconut shells, and wood-based feedstocks creates supply instability and cost volatility. Seasonal variations, geopolitical disruptions, and procurement challenges in major producing regions affect production continuity. Manufacturers often face rising costs for processing and transportation, which reduces profit margins and limits pricing flexibility. These uncertainties make long-term planning difficult and may hinder adoption among cost-sensitive industries, especially in developing regions.
Competition from Alternative Filtration and Adsorption Technologies
The market faces pressure from emerging filtration technologies such as advanced membranes, ion-exchange resins, and synthetic adsorbents that offer specific advantages in certain applications. Some alternatives provide higher selectivity, lower maintenance, or longer operational life, challenging activated carbon’s dominance in key sectors. Industrial users increasingly evaluate these options for specialized filtration needs, potentially limiting future demand. To remain competitive, activated charcoal producers must invest in performance enhancements, product differentiation, and value-added solutions.
Regional Analysis
North America
North America holds a significant share of the activated charcoal market, accounting for an estimated 25–28% of global revenue. The region benefits from stringent water purification standards, strong adoption in industrial air filtration, and rising demand from the pharmaceutical and food & beverage sectors. Manufacturers actively expand production capacities to meet the growing need for high-performance activated carbon in emission control applications. The United States dominates regional consumption, supported by regulatory frameworks promoting sustainable environmental practices. Increasing investments in municipal treatment infrastructure and rising consumer awareness of detoxification products continue to reinforce market growth across North America.
Europe
Europe captures roughly 22–25% of the global activated charcoal market, driven by strict environmental regulations and advanced wastewater treatment systems across major economies. The region demonstrates strong demand from manufacturing industries, energy facilities, and the automotive sector where activated carbon supports emission control. Germany, France, and the United Kingdom lead adoption due to well-established industrial bases and sustainability initiatives. Growing consumer preference for natural filtration and purification solutions strengthens the market for coconut-shell and wood-based activated carbon. Ongoing investments in circular economy practices and carbon-capture technologies continue to position Europe as a stable and innovation-driven market.
Asia-Pacific
Asia-Pacific dominates the activated charcoal market with an estimated 40–45% share, supported by rapid industrialization, expanding urban populations, and heightened investments in water and air purification infrastructure. China, India, Japan, and Southeast Asian countries exhibit strong consumption across food processing, pharmaceuticals, and chemical purification. The region benefits from the abundant availability of coconut shells, making it a leading producer of high-quality activated carbon. Government initiatives focused on pollution reduction and clean water access further stimulate demand. Growing manufacturing output and increased adoption of activated carbon in industrial treatment systems reinforce Asia-Pacific’s position as the fastest-growing regional market.
Latin America
Latin America accounts for approximately 6–8% of the global activated charcoal market, with gradual but rising adoption driven by expanding industrial activities and growing emphasis on environmental compliance. Brazil and Mexico lead demand due to their large food processing, mining, and chemical manufacturing sectors. Investments in municipal water treatment and stricter regulations around industrial effluents support increased consumption of activated carbon. The region is also witnessing higher use of activated charcoal in healthcare and personal care products. Although market growth is moderate, improving regulatory frameworks and rising urbanization are expected to enhance regional demand over the forecast period.
Middle East & Africa
The Middle East & Africa region holds an estimated 5–7% share of the activated charcoal market, supported by growing water desalination activities, oil & gas processing, and industrial wastewater treatment. The Gulf countries demonstrate strong demand for activated carbon in gas purification and energy-sector applications. Meanwhile, African markets show rising adoption driven by urbanization and the need for safe drinking water solutions. Limited local production encourages import-dependent supply chains, creating opportunities for new manufacturers. As governments increasingly prioritize environmental sustainability and water management infrastructure, the region is expected to register steady and long-term market growth.
Market Segmentations:
By Type:
- Extruded/Pressed Activated Carbon (EAC)
- Bead Activated Carbon (BAC)
By Raw Material:
By Phase:
By Geography
- North America
- Europe
- Germany
- France
- U.K.
- Italy
- Spain
- Rest of Europe
- Asia Pacific
- China
- Japan
- India
- South Korea
- South-east Asia
- Rest of Asia Pacific
- Latin America
- Brazil
- Argentina
- Rest of Latin America
- Middle East & Africa
- GCC Countries
- South Africa
- Rest of the Middle East and Africa
Competitive Landscape
The competitive landscape of the activated charcoal market features leading players such as Kureha Corporation, Boyce Carbon, CarboTech AC GmbH, Haycarb (Pvt) Ltd., Cabot Corporation, Osaka Gas Chemical Co., Ltd., Jacobi Carbons Group, Donau Chemie AG, Kuraray Co., and CarbPure Technologies. the activated charcoal market remains highly fragmented, with companies focusing on technological upgrades, product quality enhancement, and capacity expansion to secure stronger market positions. Manufacturers increasingly emphasize sustainable production methods and the use of renewable raw materials to align with rising environmental regulations. Strategic initiatives such as mergers, acquisitions, and cross-regional partnerships are common as firms aim to broaden their global distribution networks and diversify application portfolios. Continuous innovation in pore structure optimization, adsorption efficiency, and performance customization enables suppliers to meet evolving requirements across industries such as water treatment, air purification, pharmaceuticals, and food processing. As demand accelerates, competition intensifies around cost-efficiency, supply reliability, and differentiated product offerings.
Shape Your Report to Specific Countries or Regions & Enjoy 30% Off!
Key Player Analysis
- Kureha Corporation
- Boyce Carbon
- CarboTech AC GmbH
- Haycarb (Pvt) Ltd.
- Cabot Corporation
- Osaka Gas Chemical Co., Ltd.
- Jacobi Carbons Group
- Donau Chemie AG
- Kuraray Co.
- CarbPure Technologies
Recent Developments
- In May 2024, Kuraray Co., Ltd. announced that its subsidiary, Calgon Carbon Corporation, will acquire the industrial reactivated carbon business of Sprint Environmental Services, expanding Gulf Coast capacity to manage rising PFAS-related media returns.
- In May 2024, Arq, Inc., an environmental technology company specializing in activated carbon products, announced it had secured its inaugural sales contract for Granular Activated Carbon (GAC). The contract marks a critical milestone for Arq, with the GAC product to be produced from the company’s proprietary feedstock, a purified bituminous coal waste, at its Red River facility in Louisiana.
- In March 2023, Cabot Corporation launched the EVOLVE technology program that is involved in advancing sustainable reinforcing carbons. The purpose of the new technology launch was to recover the carbon product from the end-life tiers to renew the waste and reduce the carbon content
Report Coverage
The research report offers an in-depth analysis based on Type, Raw Material, Phase and Geography. It details leading market players, providing an overview of their business, product offerings, investments, revenue streams, and key applications. Additionally, the report includes insights into the competitive environment, SWOT analysis, current market trends, as well as the primary drivers and constraints. Furthermore, it discusses various factors that have driven market expansion in recent years. The report also explores market dynamics, regulatory scenarios, and technological advancements that are shaping the industry. It assesses the impact of external factors and global economic changes on market growth. Lastly, it provides strategic recommendations for new entrants and established companies to navigate the complexities of the market.
Future Outlook
- The market will expand steadily as governments strengthen regulations on water purification and industrial emissions.
- Demand for activated charcoal will rise with increasing adoption of advanced wastewater treatment technologies.
- Manufacturers will invest more in sustainable and renewable raw materials to reduce environmental impact.
- Coconut-shell-based activated carbon will gain traction due to its efficiency and availability.
- Product innovation will accelerate as industries seek higher adsorption capacity and customized solutions.
- Healthcare and pharmaceutical applications will drive additional growth with rising focus on detoxification and purification.
- Air purification systems will see increased usage in urban areas, boosting market consumption.
- Strategic collaborations and acquisitions will shape competitive dynamics and global expansion efforts.
- Emerging economies will present significant opportunities as infrastructure development intensifies.
- Digitalization and automation in production processes will improve efficiency and enhance supply reliability.


