
Market Overview
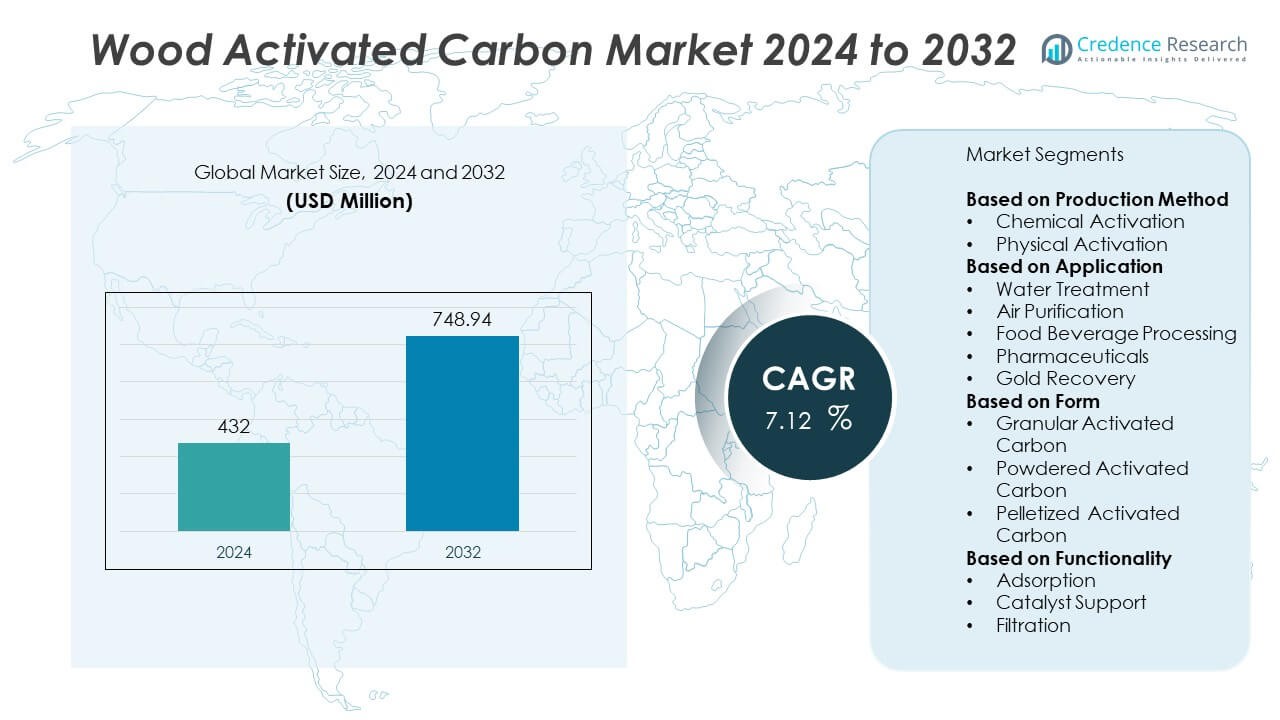
The Wood Activated Carbon Market was valued at USD 432 million in 2024 and is projected to reach USD 748.94 million by 2032, growing at a CAGR of 7.12% during the forecast period (2024–2032).
| REPORT ATTRIBUTE | DETAILS |
|---|---|
| Historical Period | 2020-2024 |
| Base Year | 2024 |
| Forecast Period | 2025-2032 |
| Wood Activated Carbon Market Size 2024 | USD 432 Million |
| Wood Activated Carbon Market , CAGR | 7.12% |
| Wood Activated Carbon Market Size 2032 | USD 748.94 Million |
The Wood Activated Carbon Market is driven by rising demand for sustainable filtration solutions in water treatment, air purification, and food processing industries. Governments and industries are adopting wood-based carbon due to its high adsorption efficiency and renewable origin. Strict environmental regulations and increasing focus on public health fuel market expansion. Technological advancements in activation methods and the shift toward natural ingredients in cosmetics and personal care further support growth. The Wood Activated Carbon Market shows strong regional presence across Asia Pacific, North America, and Europe, with Asia Pacific leading in both production and consumption due to abundant raw material availability and rising industrial demand. North America demonstrates stable growth supported by stringent environmental regulations and advanced applications in water and air purification. Europe continues to adopt wood-based carbon driven by sustainability goals and regulatory compliance, while Latin America and the Middle East & Africa are emerging markets benefiting from urbanization and infrastructure development. Key players in the global market include Calgon Carbon Corporation, known for its extensive portfolio in activated carbon solutions, and Jacobi Carbons, which offers high-quality wood-based products across diverse industries.
Market Insights
- The Wood Activated Carbon Market was valued at USD 432 million in 2024 and is projected to reach USD 748.94 million by 2032, growing at a CAGR of 7.12% during the forecast period.
- The market is gaining traction due to increasing demand for water and air purification across municipal, industrial, and residential sectors, supported by regulatory mandates and rising environmental concerns.
- A clear trend toward sustainable and renewable materials is reshaping the industry, with manufacturers focusing on eco-friendly production methods and natural feedstock sourcing.
- Companies such as Calgon Carbon Corporation, Jacobi Carbons, Haycarb PLC, and Cabot Corporation are leading the competitive landscape through global distribution, innovation, and strong customer relationships.
- High production costs and limited feedstock availability remain key restraints, affecting scalability and pricing flexibility for smaller manufacturers.
- Asia Pacific dominates the market due to its expanding industrial base, strong regulatory push for clean technologies, and availability of raw materials, while North America and Europe follow with demand driven by advanced infrastructure and sustainability policies.
- The market is also seeing growth in niche applications such as cosmetics, food processing, and pharmaceuticals, where wood-based activated carbon is valued for its purity and natural origin.
Market Drivers
Rising Demand for Water Purification Solutions Across Municipal and Industrial Sectors
The Wood Activated Carbon Market is experiencing strong growth due to increasing demand for water purification across municipal and industrial applications. Governments are investing in water treatment infrastructure to meet clean water standards and support population growth. Industrial sectors, including chemicals and pharmaceuticals, are also deploying activated carbon systems to comply with environmental regulations. The high surface area and porous structure of wood-based carbon make it ideal for removing contaminants from water. It provides an efficient and renewable solution to address concerns over water pollution. Its application in portable and point-of-use water filters is also expanding in urban and rural areas.
- For instance, Calgon Carbon Corporation upgraded its Pearlington plant in Mississippi to double its virgin activated carbon production capacity, adding a second line that increased total output to over 90,718 metric tons annually, primarily to meet rising demand for PFAS removal in water purification.
Strong Adoption in Air Purification Driven by Environmental and Health Concerns
Strict environmental regulations and growing awareness of air quality are driving adoption of air purification technologies, supporting the Wood Activated Carbon Market. Industries facing emission norms are incorporating activated carbon systems to trap harmful gases and volatile organic compounds. The demand for cleaner indoor air in residential and commercial spaces is also rising. It plays a critical role in HVAC systems, automotive cabin filters, and industrial exhausts. Consumers prefer wood-based carbon due to its sustainable source and efficient performance in odor and toxin removal. Its role in mitigating airborne health risks is becoming increasingly valuable.
- For instance, Jacobi Carbons supplies over 26,000 metric tons of air treatment grade activated carbon annually for applications including industrial VOC control and cabin air filtration. Their EcoSorb™ wood-based series is widely used for removing over 95 mg/m³ of VOCs in chemical processing exhaust systems.
Expanding Application in Food and Beverage Processing Enhances Market Value
The food and beverage industry continues to expand its use of wood-based activated carbon for decolorization, deodorization, and purification processes. The Wood Activated Carbon Market benefits from rising consumer demand for high-purity ingredients and processed food safety. Beverage companies use it to remove impurities from liquids, including juices, syrups, and alcoholic products. Regulatory compliance and quality control standards require manufacturers to adopt efficient purification methods. It offers a natural and non-toxic option for meeting product purity benchmarks. Its compatibility with a variety of processing systems increases its appeal among producers.
Regulatory Pressure and Pharmaceutical Growth Sustain Long-Term Market Expansion
Rising pharmaceutical output and regulatory oversight of waste management support the growth of the Wood Activated Carbon Market. Pharmaceutical manufacturers use activated carbon to purify raw materials, intermediates, and wastewater. Environmental agencies continue to tighten discharge norms, requiring effective treatment solutions. It enables compliance by removing organic pollutants and trace chemicals from effluents. The renewable nature of wood-derived carbon aligns with sustainability goals within the sector. Its role in controlled substance filtration and solvent recovery also contributes to rising demand.
Market Trends
Shift Toward Sustainable Raw Materials and Circular Economy Practices
The Wood Activated Carbon Market is witnessing a clear trend toward sustainability, with manufacturers shifting to renewable and eco-friendly raw materials. Wood-based carbon, derived from sawdust, wood chips, and other biomass waste, aligns well with circular economy principles. Companies are investing in sourcing strategies that minimize deforestation and promote responsible forestry. It supports carbon-neutral initiatives and offers a lower environmental footprint compared to coal-based alternatives. Brands are also marketing wood-derived carbon products with sustainability labels to meet customer preferences. This trend is reshaping supply chains and production processes across the industry.
- For instance, Haycarb PLC reported that its “Haritha Angara” program helped them procure 79,000 metric tons of raw material in 2023 solely from renewable and eco-certified sources, supporting their target to achieve 100% sustainable feedstock sourcing across all production units by 2025. The company’s biomass-based input strategy prevented the release of over 48,500 metric tons of CO₂ equivalents in emissions during that year.
Technological Advancements in Activation and Processing Techniques
New technologies in activation methods and processing efficiency are influencing growth and competitiveness in the Wood Activated Carbon Market. Innovations in steam and chemical activation processes have improved pore structure, surface area, and adsorption efficiency. Automation and digital monitoring tools are being deployed to optimize output and reduce waste. It helps producers meet specific requirements across water, air, and food purification applications. These advancements are making high-grade carbon products more accessible to small and mid-sized industries. The trend is driving product differentiation and supporting custom applications across sectors.
- For instance, Haycarb PLC produces its Eco‑Friendly RWAC wood‑based activated carbon with surface areas up to 1,800 m²/g, featuring micronized particle sizing at d50 ~ 6 µm to enhance adsorption kinetics. Their proprietary regeneration process restores 97 % of original adsorption capacity in spent carbon, enabling multiple reuse cycles and reducing material waste.
Rising Use in Personal Care and Cosmetic Applications Expands Market Scope
Consumer interest in natural and toxin-free personal care products is driving the inclusion of wood-based activated carbon in cosmetics and skincare. The Wood Activated Carbon Market benefits from growing use in facial masks, exfoliators, and deodorants where detoxifying properties are valued. Brands are incorporating it for its natural origin, gentle action, and ability to remove impurities. It offers a marketable alternative to synthetic ingredients, particularly in clean beauty formulations. Regulatory bodies are supporting this shift through ingredient approvals and safety certifications. The cosmetic segment is emerging as a key non-industrial growth area.
Growth in Emerging Economies Driven by Infrastructure and Industrial Expansion
Developing regions in Asia Pacific, Latin America, and Africa are contributing to the expansion of the Wood Activated Carbon Market. Urbanization and industrial growth are creating demand for water and air purification systems. Infrastructure projects in water treatment and sanitation are creating long-term opportunities for activated carbon suppliers. It is being adopted across public and private initiatives to meet environmental and health targets. Local production facilities are expanding to meet regional needs and reduce reliance on imports. These markets present strong potential due to supportive policies and rising environmental awareness.
Market Challenges Analysis
High Production Costs and Limited Feedstock Availability Restrain Scalability
The Wood Activated Carbon Market faces challenges related to the high costs associated with production and raw material procurement. Manufacturing requires precise activation processes that demand significant energy input, impacting overall operating expenses. Limited availability of high-quality, sustainable wood feedstock further constrains supply, particularly in regions with strict forestry regulations. It places pressure on manufacturers to balance cost-efficiency with environmental responsibility. Competition from lower-cost coal- and coconut-based carbon alternatives also affects pricing flexibility. These factors collectively limit the scalability of production and slow the pace of market penetration in cost-sensitive regions.
Regulatory Complexity and Performance Consistency Present Operational Hurdles
Stringent environmental and safety regulations across multiple end-use industries create operational complexities for manufacturers in the Wood Activated Carbon Market. Companies must comply with varying standards for emissions, product purity, and waste disposal across regions. It requires continuous investment in testing, certification, and process adjustments to ensure regulatory alignment. Maintaining consistent performance across different batches also proves difficult due to natural variations in wood feedstock. Variability in adsorption efficiency or pore structure can affect product reliability and end-user trust. These challenges impact supply chain stability and hinder long-term contract opportunities.
Market Opportunities
Expanding Demand from Emerging Economies Supports Market Penetration
Rapid industrialization and urban infrastructure development in emerging economies present significant opportunities for the Wood Activated Carbon Market. Countries in Asia Pacific, Latin America, and Africa are investing in water treatment, waste management, and air purification systems. It meets rising demand for cost-effective and sustainable solutions to address pollution and public health concerns. Governments are allocating budgets for clean water access and emission control, creating new avenues for suppliers. Growing environmental awareness and regulatory alignment with global standards support market entry. Local partnerships and regional manufacturing can further enhance presence and reduce import dependence.
Diversification into High-Value Applications Strengthens Revenue Potential
Opportunities exist in expanding the use of wood-based activated carbon across specialized industries such as pharmaceuticals, electronics, and cosmetics. The Wood Activated Carbon Market can benefit from demand for ultra-pure filtration in high-value manufacturing processes. It offers a renewable and high-performance option that aligns with the clean-label trend in consumer products. Increasing focus on natural ingredients in personal care and food processing adds momentum to product adoption. Customization of pore size and surface chemistry enables manufacturers to target niche applications. This diversification supports value creation and helps reduce dependency on traditional industrial segments.
Market Segmentation Analysis:
By Production Method
The Wood Activated Carbon Market is segmented by production method into chemical activation and physical activation. Chemical activation dominates due to its ability to produce higher surface area carbon using lower activation temperatures and shorter processing time. It is preferred in applications requiring superior adsorption efficiency, such as pharmaceuticals and water treatment. Physical activation, using steam or carbon dioxide, remains relevant for environmentally conscious processes. It appeals to industries emphasizing minimal chemical use and aligns with regulatory preferences in certain regions. The choice of activation method directly influences cost, performance, and application suitability.
- For instance, Norit (Cabot Corporation) uses chemical activation with KOH or H₃PO₄ to manufacture wood-derived carbons achieving BET surface areas exceeding 2,000 m²/g, while their steam-activated lines consistently reach BET surface areas between 900 and 1,200 m²/g-a clear distinction between high-surface chemical activation and traditional physical methods
By Application
The market is segmented into water treatment, air purification, food and beverage processing, pharmaceuticals, and gold recovery. Water treatment holds the largest share due to growing demand from municipal and industrial sectors for clean and safe water. It effectively removes organic compounds, chlorine, and other contaminants, supporting public health goals. Air purification is gaining traction in residential, commercial, and industrial environments, driven by pollution concerns and regulatory compliance. The food and beverage segment uses activated carbon for decolorization and impurity removal, enhancing product quality and safety. In pharmaceuticals, it enables solvent recovery and ingredient purification, while in gold recovery, it serves as a critical component for adsorption of gold from cyanide solutions.
- For instance, Calgon Carbon’s Acticarbone® wood carbon-produced via steam activation in Landes pine-features iodine numbers typically above 600 mg/g, aligning with industrial quality standards for water-treatment applications
By Form
The market is segmented into granular activated carbon (GAC), powdered activated carbon (PAC), and pelletized activated carbon. GAC leads the segment due to its widespread use in water and air treatment systems that require reactivation and regeneration. It offers low-pressure drop and long operating life. PAC is used in batch processes and applications requiring quick dispersion and rapid adsorption, such as food processing and pharmaceuticals. Pelletized carbon, known for its mechanical strength and uniform shape, is preferred in gas-phase filtration and high-temperature applications. It allows flexibility in handling and minimizes dust generation during use.
Segments:
Based on Production Method
- Chemical Activation
- Physical Activation
Based on Application
- Water Treatment
- Air Purification
- Food Beverage Processing
- Pharmaceuticals
- Gold Recovery
Based on Form
- Granular Activated Carbon
- Powdered Activated Carbon
- Pelletized Activated Carbon
Based on Functionality
- Adsorption
- Catalyst Support
- Filtration
Based on the Geography:
- North America
- U.S.
- Canada
- Mexico
- Europe
- UK
- France
- Germany
- Italy
- Spain
- Russia
- Belgium
- Netherlands
- Austria
- Sweden
- Poland
- Denmark
- Switzerland
- Rest of Europe
- Asia Pacific
- China
- Japan
- South Korea
- India
- Australia
- Thailand
- Indonesia
- Vietnam
- Malaysia
- Philippines
- Taiwan
- Rest of Asia Pacific
- Latin America
- Brazil
- Argentina
- Peru
- Chile
- Colombia
- Rest of Latin America
- Middle East
- UAE
- KSA
- Israel
- Turkey
- Iran
- Rest of Middle East
- Africa
- Egypt
- Nigeria
- Algeria
- Morocco
- Rest of Africa
Regional Analysis
Asia Pacific
Asia Pacific holds the largest share in the Wood Activated Carbon Market, accounting for approximately 41% of the global market. This dominance stems from strong demand across water purification, air filtration, and food processing industries in countries such as China, India, Japan, and South Korea. Rapid industrialization and urban population growth have increased pressure on municipal water systems, driving the need for advanced filtration solutions. Governments across the region are enforcing stricter environmental standards, pushing industries to adopt wood-based activated carbon as a sustainable and efficient purification material. In China, aggressive investments in wastewater treatment and air pollution control significantly boost product consumption. India follows with increased deployment of activated carbon in pharmaceuticals and food and beverage processing. The region also benefits from abundant raw materials like wood chips and sawdust, which support cost-effective local production. These factors continue to strengthen the region’s leadership in global supply and demand.
North America
North America accounts for around 24% of the global Wood Activated Carbon Market, driven by advanced infrastructure, stringent environmental regulations, and a mature end-user base. The United States represents the largest contributor in the region, where the product is widely used in industrial wastewater treatment, air purification, and pharmaceutical processing. The Environmental Protection Agency (EPA) enforces regulations that mandate the use of activated carbon technologies to reduce contaminants from industrial emissions and effluents. It finds strong demand in applications like mercury removal from power plant emissions and municipal water filtration. Canada and Mexico also show growing adoption across food processing and gold recovery. The presence of several leading manufacturers and innovation in production technologies contribute to stable supply and expanding application scope in North America.
Europe
Europe holds a 18% share in the Wood Activated Carbon Market and is characterized by growing emphasis on sustainability and environmental responsibility. Countries such as Germany, France, the UK, and Italy are leading adopters of wood-based activated carbon for air and water purification. Strict EU regulations concerning air quality, industrial emissions, and drinking water safety drive market growth. European industries and municipal bodies are increasingly shifting to eco-friendly purification materials, positioning wood-based carbon as a preferred choice over fossil-based alternatives. The food and beverage industry, particularly in Germany and France, is adopting it for decolorization and purification processes. Regional research and development initiatives focused on bio-based materials further support innovation and product improvement across this market.
Latin America
Latin America captures around 9% of the global Wood Activated Carbon Market. The region is witnessing increasing demand for clean water and air, driven by industrial expansion and growing urbanization. Brazil, Mexico, and Argentina are leading consumers, where the market benefits from the availability of natural wood sources and rising public health concerns. Investments in infrastructure and environmental projects support the adoption of activated carbon in municipal and industrial sectors. Food and beverage processing and pharmaceutical applications also contribute to market growth in this region. Although still developing, the Latin American market shows strong potential for future expansion.
Middle East & Africa
The Middle East & Africa region holds a 8% share in the global Wood Activated Carbon Market. While demand is currently modest, the market shows potential due to rising investments in water desalination, oil and gas processing, and industrial purification. Countries like Saudi Arabia, the UAE, and South Africa are increasing their use of activated carbon in water treatment plants and industrial applications. Scarcity of freshwater and growing dependence on desalination make water purification a critical concern. The pharmaceutical and mining sectors are also beginning to integrate wood-based carbon solutions, encouraged by regional sustainability goals and global partnerships. Although the base is smaller, it is poised for gradual, sustained growth.
Key Player Analysis
- Calgon Carbon Corporation
- Angelini Chemicals
- Haycarb PLC
- Cabot Corporation
- Chemische Fabrik D. E. Scharfbillig GmbH
- Ada Carbon Solutions
- Jacobi Carbons
- Ingevity Corporation
- Evoqua Water Technologies
- Osaka Gas Chemicals Co. Ltd.
- CarboTech AC GmbH
- Silcarbon Aktivkohle GmbH
Competitive Analysis
The Wood Activated Carbon Market is highly competitive, with key players including Calgon Carbon Corporation, Jacobi Carbons, Haycarb PLC, Cabot Corporation, Ingevity Corporation, Evoqua Water Technologies, Osaka Gas Chemicals Co. Ltd., and Silcarbon Aktivkohle GmbH. These companies maintain strong global positions through product innovation, strategic acquisitions, and a focus on sustainability. Their competitive edge lies in offering high-performance, application-specific solutions that meet the growing demand for environmentally responsible purification systems. Leading manufacturers prioritize research and development to enhance adsorption efficiency and adapt to evolving industry standards. They also invest in expanding their production capabilities and supply chain resilience to serve diverse markets such as water treatment, air purification, food processing, and pharmaceuticals. Sustainability remains a central theme, with players adopting renewable raw materials and energy-efficient activation methods. The competitive environment encourages continuous product refinement and regional expansion, as companies seek to align with environmental regulations and secure long-term partnerships with industrial and municipal clients.
Recent Developments
- In 2025, Haycarb has been focusing on sustainability initiatives with its “Haritha Angara” program, aimed at making all raw material supply for activated carbon 100% eco-friendly by 2025. They have also been investing in technology to develop activated carbons not only for traditional uses but also for energy storage solutions.
- In July 2024, Calgon Carbon completed a significant expansion at its Pearlington, Mississippi facility, adding a second production line for virgin activated carbon. This expansion increases their total annual production capacity to over 200 million pounds, aiming to address the global demand for activated carbon, particularly in water purification to combat PFAS contaminants.
- In 2023, Cabot Corporation introduced a new line of wood-based activated carbon products specifically designed for the food and beverage industry. These products aim to improve purification efficiency and ensure compliance with rigorous safety standards within the food and beverage sector.
- In October 2023, ADA Carbon Solutions announced a $251 million expansion of its Red River Parish facility in Louisiana. The expansion will introduce a new process to convert purified coal waste into granular activated carbon, mainly for water purification and environmental cleanup. Construction is slated to begin in November 2023, with completion expected by the end of 2026.
Market Concentration & Characteristics
The Wood Activated Carbon Market exhibits moderate to high market concentration, with a few major players holding significant global share. It features characteristics such as vertically integrated operations, sustainable raw material sourcing, and application-specific product development. The market is shaped by consistent demand from end-use industries including water treatment, air purification, food processing, and pharmaceuticals. It benefits from long-term contracts and repeat procurement cycles, especially in municipal and industrial sectors that require ongoing filtration solutions. The market favors manufacturers that can offer both standard and customized grades with reliable quality and supply continuity. Regulatory compliance and sustainability performance are critical differentiators, influencing buyer preferences and procurement decisions. It remains innovation-driven, with players focusing on improving adsorption efficiency, product purity, and environmental impact. The ability to manage raw material costs and invest in energy-efficient production methods supports competitive advantage in this market. It also reflects strong customer loyalty, supported by performance consistency and technical expertise.
Report Coverage
The research report offers an in-depth analysis based on Production Method, Application, Form, Functionality and Geography. It details leading market players, providing an overview of their business, product offerings, investments, revenue streams, and key applications. Additionally, the report includes insights into the competitive environment, SWOT analysis, current market trends, as well as the primary drivers and constraints. Furthermore, it discusses various factors that have driven market expansion in recent years. The report also explores market dynamics, regulatory scenarios, and technological advancements that are shaping the industry. It assesses the impact of external factors and global economic changes on market growth. Lastly, it provides strategic recommendations for new entrants and established companies to navigate the complexities of the market.
Future Outlook
- The market will continue to grow steadily due to rising demand for clean water and air across urban and industrial areas.
- Regulatory pressure on emissions and wastewater treatment will drive adoption in developed and developing regions.
- Sustainability initiatives will increase the preference for wood-based carbon over coal-based alternatives.
- Technological advancements will improve activation processes, enhancing product efficiency and consistency.
- Emerging applications in cosmetics, pharmaceuticals, and food processing will expand the market scope.
- Manufacturers will invest in expanding production capacity and sourcing sustainable raw materials.
- Strategic partnerships and acquisitions will strengthen global distribution networks.
- Asia Pacific will remain a key production and consumption hub due to industrial expansion and resource availability.
- Product customization and application-specific grades will become more important for competitive differentiation.
- Innovation in packaging and delivery formats will improve ease of use and handling in end-use industries.

Request a Free Sample
Fill in your details and we'll send you a free sample report.
- Sample data tables & charts
- Research methodology
Market Dynamics
Stringent Environmental Regulations
Governments and regulatory bodies are enforcing stricter standards for water and air quality, compelling industries and municipalities to adopt advanced filtration solutions like wood activated carbon to meet compliance and reduce emissions.
Sustainability and Renewable Sourcing
The shift toward sustainable, renewable materials is driving demand for wood-based activated carbon, as it offers a lower environmental footprint and aligns with corporate and governmental sustainability initiatives compared to coal-based alternatives.
Technological Advancements in Activation Processes
Innovations in chemical and physical activation methods have improved the adsorption efficiency, surface area, and reusability of wood activated carbon, making it more attractive for high-performance applications in water, air, and food purification.
Expansion in High-Purity and Specialty Applications
Growing use of wood activated carbon in pharmaceuticals, cosmetics, and food processing - where purity, safety, and natural origin are critical - broadens the market beyond traditional industrial uses and supports premium pricing.
Industrialization and Infrastructure Growth in Emerging Markets
Rapid urbanization and industrial expansion in Asia Pacific, Latin America, and Africa are increasing the need for effective water and air purification systems, boosting demand for wood activated carbon in these regions.
Need a Custom Version of This Report?
Tailor the scope, geography, or segments to your exact requirements.
- Custom geography or segment scope
- Direct access to our analyst team
Frequently Asked Questions
What is the current market size for Wood Activated Carbon, and what is its projected size in 2032?
At what Compound Annual Growth Rate is the Wood Activated Carbon market projected to grow between 2025 and 2032?
Which Wood Activated Carbon market segment held the largest share in 2024?
What are the primary factors fueling the growth of the Wood Activated Carbon market?
Who are the leading companies in the Wood Activated Carbon market?
Which region commanded the largest share of the Wood Activated Carbon market in 2024?
Table of Content
Chapter 1 Market Segmentation
- 1.1 Segmentation Framework
- 1.1.1 Product and Service Classification
- 1.1.2 Application and End-Use Classification
- 1.1.3 Technology and Solution Classification
- 1.1.4 Customer and Distribution Channel Classification
- 1.1.5 Geographic Segmentation
- 1.1.6 Market Segment Definitions and Boundaries
- 1.2 By Form
- 1.2.1 Granular Activated Carbon (GAC)
- 1.2.2 Powdered Activated Carbon (PAC)
- 1.2.3 Pelletized Activated Carbon
- 1.3 By Application
- 1.3.1 Water Treatment
- 1.3.2 Air Purification
- 1.3.3 Food & Beverage Processing
- 1.3.4 Pharmaceuticals
- 1.3.5 Gold Recovery
- 1.4 By Functionality
- 1.4.1 Adsorption
- 1.4.2 Catalyst Support
- 1.4.3 Filtration
- 1.5 By Production Method
- 1.5.1 Chemical Activation
- 1.5.2 Physical Activation
Chapter 2 Introduction
- 2.1 Report Objectives and Scope
- 2.2 Product Definition and Industry Terminology
- 2.3 Market Inclusions and Exclusions
- 2.4 Research Process
- 2.4.1 Primary Research and Expert Interviews
- 2.4.2 Secondary Research and Source Review
- 2.4.3 Top-Down and Bottom-Up Estimation
- 2.4.4 Data Triangulation and Verification
- 2.5 Market Size Measurement Basis
- 2.5.1 2024: USD 432 million → 2032: USD 748.94 million
- 2.6 Historical and Forecast Reference Periods
- 2.6.1 Base Year: 2024
- 2.6.2 Forecast Period: 2024-2032
- 2.7 Research Assumptions and Limitations
Chapter 3 Executive Summary
- 3.1 Market Snapshot and Key Findings
- 3.2 Base-Year Market Size, 2024
- 3.3 Forecast Market Size, 2032
- 3.4 Revenue and Volume Growth Outlook
- 3.5 Key Demand and Supply Indicators
- 3.6 Leading Market Segments
- 3.7 Fastest-Growing Market Opportunities
- 3.8 Regional Performance Highlights
- 3.9 Technology and Industry Transformation
- 3.10 Competitive Landscape Summary
- 3.11 Analyst View and Strategic Implications
Chapter 4 Global Wood Activated Carbon Market Trends and Developments
- 4.1 Historical Industry Development
- 4.2 Recent Market Trends and Developments
- 4.3 Demand and Customer Behavior Trends
- 4.4 Technology and Product Innovation
- 4.5 Artificial Intelligence, Automation and Digitalization
- 4.6 Local Manufacturing and Supply Chain Realignment
- 4.7 Industry Partnerships, Mergers and Acquisitions
- 4.8 Sustainability and Circular Economy Developments
- 4.9 Government and Private Sector Investment Trends
- 4.10 Emerging Business Models and Commercialization
- 4.11 Industry Developments and Announcements
Chapter 5 Global Wood Activated Carbon Market Production, Supply and Demand Analysis
- 5.1 Demand Trend and Consumption Analysis
- 5.2 Demand Forecast, 2024-2032
- 5.3 Production and Output Trend
- 5.4 Production and Output Forecast, 2024-2032
- 5.5 Installed Capacity and Capacity Utilization
- 5.6 Company-Wise Production Plants and Statistics
- 5.6.1 Installed Production Capacity
- 5.6.2 Actual Production
- 5.6.3 Planned Capacity and Expansion Targets
- 5.7 Supply Chain Structure and Procurement Trends
- 5.8 Supply-Demand Gap and Bottlenecks
- 5.9 Import Dependence and Sourcing Structure
- 5.10 Contract Manufacturing and Outsourcing
- 5.11 Regional Supply and Demand Concentration
Chapter 6 Global Wood Activated Carbon Market Pricing Analysis
- 6.1 Pricing Structure and Measurement
- 6.2 Historical Pricing Trends
- 6.3 Pricing Outlook, 2024-2032
- 6.4 Average Selling Price and Unit Economics
- 6.5 Pricing by Product and Market Segment
- 6.6 Geographic Pricing Differences
- 6.7 Key Input, Energy, Labor and Logistics Costs
- 6.8 Contract Pricing and Purchasing Models
- 6.9 Pricing Sensitivity and Competitive Positioning
- 6.10 Price, Margin and Profitability Implications
Chapter 7 Global Wood Activated Carbon Market Dynamics
- 7.1 Market Growth Drivers
- 7.1.1 Demand-Side Drivers
- 7.1.2 Technology and Innovation Drivers
- 7.1.3 Infrastructure and Investment Drivers
- 7.1.4 Regulatory and Policy Drivers
- 7.2 Market Restraints
- 7.2.1 Cost and Affordability Constraints
- 7.2.2 Technology and Adoption Barriers
- 7.2.3 Supply Chain and Operational Constraints
- 7.3 Market Challenges
- 7.3.1 Competitive Pressure and Margin Erosion
- 7.3.2 Skills, Infrastructure and Implementation Gaps
- 7.4 Emerging Market Opportunities
- 7.5 Market Dynamics Impact and Time-Horizon Assessment
Chapter 8 Global Wood Activated Carbon Value Chain Analysis
- 8.1 Industry Value Chain Overview
- 8.2 Upstream Suppliers and Critical Inputs
- 8.3 Technology and Component Providers
- 8.4 Manufacturing or Service Delivery
- 8.5 Distribution, Channel Partners and Integrators
- 8.6 Downstream Applications and End Users
- 8.7 Value Addition and Profit Pools
- 8.8 Vertical Integration and Outsourcing
- 8.9 Supplier Concentration and Risk
- 8.10 Supply Chain Localization and Resilience
Chapter 9 Global Wood Activated Carbon Market Regulations and Policies
- 9.1 Relevant Laws, Standards and Compliance Frameworks
- 9.2 Product, Service, Safety and Quality Requirements
- 9.3 Government Policies, Incentives and Subsidies
- 9.4 Imports, Exports and Trade Barriers
- 9.5 Public Procurement and Local Content Requirements
- 9.6 Environmental and Sustainability Compliance
- 9.7 Upcoming Policy Changes and Market Implications
Chapter 10 Global Wood Activated Carbon Market Hotspots and Opportunities
- 10.1 Market Opportunity Mapping and Growth Hotspots
- 10.2 High-Growth Applications and Customer Groups
- 10.3 Underserved Markets and White-Space Opportunities
- 10.4 Emerging Technology and Product Opportunities
- 10.5 New Capacity and Investment Hotspots
- 10.6 Market Entry and Expansion Opportunities
- 10.7 Distribution and Partnership Opportunities
- 10.8 Near-Term and Long-Term Commercial Potential
- 10.9 Opportunity Attractiveness and Execution Risks
Chapter 11 Global Wood Activated Carbon Market Outlook, 2024-2032
- 11.1 Market Size and Analysis
- 11.1.1 Revenue (Market Measurement: 2024: USD 432 million → 2032: USD 748.94 million)
- 11.1.2 Market Volume and Quantity Sold
- 11.1.3 Historical Market Size
- 11.1.4 Base-Year Market Size, 2024
- 11.2 Market Forecast, 2024-2032
- 11.2.1 Revenue Forecast to 2032
- 11.2.2 Volume Forecast to 2032
- 11.2.3 CAGR and Year-on-Year Growth
- 11.2.4 Incremental Revenue Opportunity
- 11.3 Forecast Assumptions and Scenario Analysis
- 11.3.1 Base-Case Forecast
- 11.3.2 Optimistic and Conservative Scenarios
- 11.3.3 Technology, Pricing and Policy Sensitivities
- 11.4 Market Attractiveness and Growth Outlook
Chapter 12 Global Wood Activated Carbon Market Segmentation and Outlook
- 12.1 Segmentation Summary and Market Shares, 2024
- 12.2 Largest and Fastest-Growing Segments
- 12.3 By Form - Market Size and Forecast, 2024-2032
- 12.3.1 Segment Definition and Scope
- 12.3.2 Historical Market Size
- 12.3.3 Revenue Forecast, 2024-2032
- 12.3.4 Volume Forecast, 2024-2032
- 12.3.5 Base-Year Market Share, 2024
- 12.3.6 Segment CAGR and Growth Drivers
- 12.3.7 Subsegment Market Size and Forecast
- 12.3.7.1 Granular Activated Carbon (GAC)
- 12.3.7.2 Powdered Activated Carbon (PAC)
- 12.3.7.3 Pelletized Activated Carbon
- 12.3.8 Subsegment Pricing and Adoption Trends
- 12.3.9 Leading Suppliers and Competition
- 12.3.10 Regional Demand and Opportunities
- 12.4 By Application - Market Size and Forecast, 2024-2032
- 12.4.1 Segment Definition and Scope
- 12.4.2 Historical Market Size
- 12.4.3 Revenue Forecast, 2024-2032
- 12.4.4 Volume Forecast, 2024-2032
- 12.4.5 Base-Year Market Share, 2024
- 12.4.6 Segment CAGR and Growth Drivers
- 12.4.7 Subsegment Market Size and Forecast
- 12.4.7.1 Water Treatment
- 12.4.7.2 Air Purification
- 12.4.7.3 Food & Beverage Processing
- 12.4.7.4 Pharmaceuticals
- 12.4.7.5 Gold Recovery
- 12.4.8 Subsegment Pricing and Adoption Trends
- 12.4.9 Leading Suppliers and Competition
- 12.4.10 Regional Demand and Opportunities
- 12.5 By Functionality - Market Size and Forecast, 2024-2032
- 12.5.1 Segment Definition and Scope
- 12.5.2 Historical Market Size
- 12.5.3 Revenue Forecast, 2024-2032
- 12.5.4 Volume Forecast, 2024-2032
- 12.5.5 Base-Year Market Share, 2024
- 12.5.6 Segment CAGR and Growth Drivers
- 12.5.7 Subsegment Market Size and Forecast
- 12.5.7.1 Adsorption
- 12.5.7.2 Catalyst Support
- 12.5.7.3 Filtration
- 12.5.8 Subsegment Pricing and Adoption Trends
- 12.5.9 Leading Suppliers and Competition
- 12.5.10 Regional Demand and Opportunities
- 12.6 By Production Method - Market Size and Forecast, 2024-2032
- 12.6.1 Segment Definition and Scope
- 12.6.2 Historical Market Size
- 12.6.3 Revenue Forecast, 2024-2032
- 12.6.4 Volume Forecast, 2024-2032
- 12.6.5 Base-Year Market Share, 2024
- 12.6.6 Segment CAGR and Growth Drivers
- 12.6.7 Subsegment Market Size and Forecast
- 12.6.7.1 Chemical Activation
- 12.6.7.2 Physical Activation
- 12.6.8 Subsegment Pricing and Adoption Trends
- 12.6.9 Leading Suppliers and Competition
- 12.6.10 Regional Demand and Opportunities
- 12.7 Segment Growth Comparison
- 12.8 Segment Attractiveness and Priority Matrix
Chapter 13 Global Wood Activated Carbon End-Use and Application Market Outlook
- 13.1 End-Use Industry and Customer Demand Structure
- 13.2 Leading Applications and Customer Groups
- 13.3 End-Use Market Size, Share and Forecast
- 13.4 Major End-Use Industry Deep Dives
- 13.4.1 Customer Requirements and Use Cases
- 13.4.2 Demand and Replacement Cycles
- 13.4.3 Technical and Regulatory Considerations
- 13.4.4 Purchasing and Procurement Models
- 13.4.5 Leading Vendors and Distribution Channels
- 13.4.6 Forecast and Commercial Opportunities
- 13.5 Emerging Applications and Cross-Segment Demand
- 13.6 End-Use Industry Investment Priorities
Chapter 14 Global Wood Activated Carbon Geographic Market Outlook, 2024-2032
- 14.1 Regional Market Size and Share, 2024
- 14.2 Regional Market Forecast, 2024-2032
- 14.3 Regional Pricing, Production and Demand Differences
- 14.4 North America
- 14.4.1 United States
- 14.4.2 Canada
- 14.4.3 Mexico
- 14.5 Europe
- 14.5.1 Germany
- 14.5.2 France
- 14.5.3 Italy
- 14.5.4 United Kingdom
- 14.5.5 Spain
- 14.5.6 Poland
- 14.5.7 Russia
- 14.5.8 Netherlands
- 14.5.9 Belgium
- 14.5.10 Sweden
- 14.5.11 Denmark
- 14.5.12 Norway
- 14.5.13 Rest of Europe
- 14.6 Asia Pacific
- 14.6.1 China
- 14.6.2 India
- 14.6.3 Japan
- 14.6.4 South Korea
- 14.6.5 Thailand
- 14.6.6 Indonesia
- 14.6.7 Vietnam
- 14.6.8 Malaysia
- 14.6.9 Australia
- 14.6.10 Rest of Asia Pacific
- 14.7 Latin America
- 14.7.1 Brazil
- 14.7.2 Argentina
- 14.7.3 Colombia
- 14.7.4 Chile
- 14.7.5 Rest of Latin America
- 14.8 Middle East
- 14.8.1 Saudi Arabia
- 14.8.2 United Arab Emirates
- 14.8.3 Turkey
- 14.8.4 Israel
- 14.8.5 Iran
- 14.8.6 Rest of the Middle East
- 14.9 Africa
- 14.9.1 South Africa
- 14.9.2 Egypt
- 14.9.3 Nigeria
- 14.9.4 Morocco
- 14.9.5 Rest of Africa
- 14.10 Regional Investment, Policy and Supply Chain Differences
- 14.11 Regional Competitive Landscape
- 14.12 Geographic Growth Hotspots
Chapter 15 Global Wood Activated Carbon Technology, Innovation and Sustainability Outlook
- 15.1 Technology Landscape and Maturity
- 15.2 Product, Process and Service Innovation
- 15.3 AI, Automation and Digital Tools in the Industry
- 15.4 Technology Adoption and Performance Benchmarking
- 15.5 Innovation Pipeline and R&D Investment
- 15.6 Patent and Intellectual Property Trends
- 15.7 Energy Efficiency and Resource Management
- 15.8 Sustainability, Recycling and Circularity
- 15.9 Technology Roadmap, 2024-2032
- 15.10 Risks of Obsolescence and Technology Substitution
Chapter 16 Global Wood Activated Carbon Market Key Strategic Imperatives
- 16.1 Growth and Market Entry Priorities
- 16.2 High-Return Products and Segments
- 16.3 Pricing, Profitability and Cost Optimization
- 16.4 Technology Investment and Product Differentiation
- 16.5 Supply Chain Localization and Resilience
- 16.6 Distribution and Customer Acquisition
- 16.7 Partnership, Acquisition and Capacity Strategy
- 16.8 Regional Expansion Priorities
- 16.9 Short-, Medium- and Long-Term Actions
Chapter 17 Competition Outlook
- 17.1 Industry Competition Characteristics
- 17.2 Market Structure and Concentration
- 17.3 Market Share and Competitive Positioning, 2024
- 17.4 Company-Wise Revenue and Product Benchmarking
- 17.5 Production and Service Capacity Benchmarking
- 17.6 Technology, Pricing and Differentiation
- 17.7 Regional Footprint and Distribution Strength
- 17.8 Mergers, Acquisitions and Strategic Alliances
- 17.9 New Entrants and Competitive Threats
- 17.10 Porter's Five Forces and Industry Attractiveness
- 17.11 Competitive Outlook, 2024-2032
Chapter 18 Company Profiles
- 18.1 Company Coverage and Selection Criteria
- 18.2 Calgon Carbon Corporation
- 18.2.1 Business Description
- 18.2.2 Company Ownership and Geographic Presence
- 18.2.3 Product and Service Portfolio
- 18.2.4 Manufacturing and Operating Footprint
- 18.2.5 Production Capacity and Expansion Plans
- 18.2.6 Financial Performance and Investment
- 18.2.7 Market Share and Competitive Position
- 18.2.8 Technology and Innovation Capabilities
- 18.2.9 Strategic Alliances or Partnerships
- 18.2.10 Recent Developments
- 18.2.11 Growth Strategy and Outlook
- 18.3 Jacobi Carbons
- 18.4 Haycarb PLC
- 18.5 Cabot Corporation
- 18.6 Ingevity Corporation
- 18.7 Evoqua Water Technologies
- 18.8 Osaka Gas Chemicals Co. Ltd.
- 18.9 Silcarbon Aktivkohle GmbH
- 18.10 CarboTech AC GmbH
- 18.11 ADA Carbon Solutions
- 18.12 Other Relevant Market Participants
Note: Every listed company is profiled on the structure shown under the first company. The company list is preliminary and may change based on research findings, market developments, data availability and client requirements.
Chapter 19 Disclaimer
- 19.1 Research and Forecast Disclaimer
- 19.2 Data Source and Estimation Limitations
Note: The depth of individual sections depends on data availability for this market. Volume, capacity, trade and other unit-based metrics are included where applicable.

