CHAPTER NO. 1 : INTRODUCTION 18
1.1. Report Description 18
1.1.1. Purpose of the Report 18
1.1.2. USP & Key Offerings 18
1.2. Key Benefits for Stakeholders 18
1.3. Target Audience 19
1.4. Report Scope 19
CHAPTER NO. 2 : EXECUTIVE SUMMARY 22
2.1. Aluminum Caps & Closures Market Snapshot 22
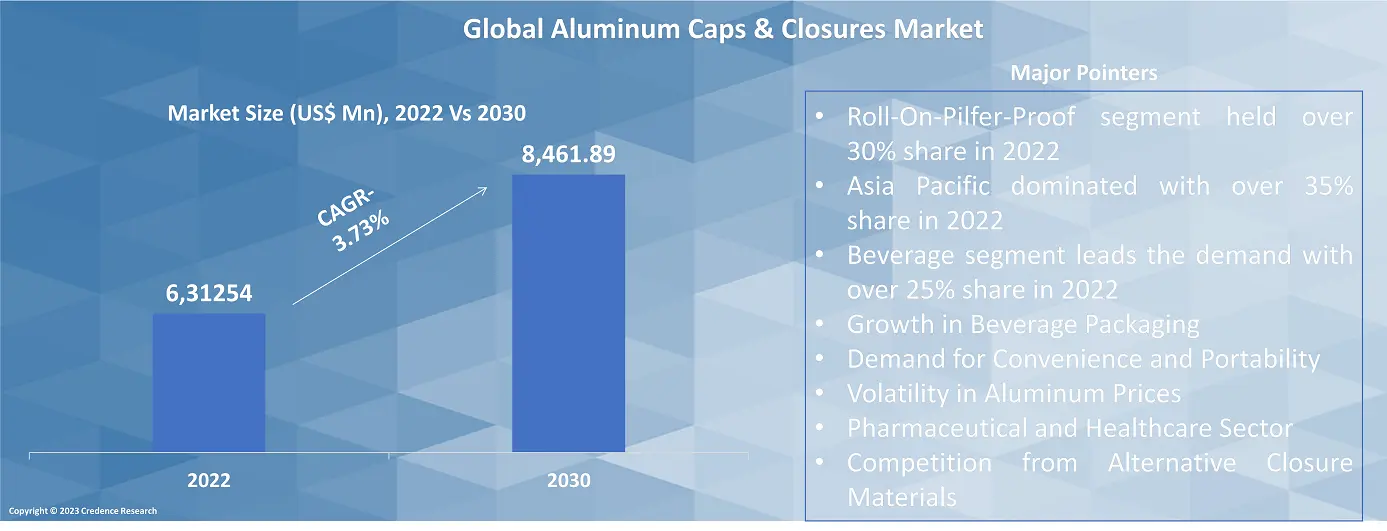
2.2. Global Aluminum Caps & Closures Market, 2017 – 2030 (K Units) (USD Million) 24
2.1. Insights from Primary Respondents 24
CHAPTER NO. 3 : COVID 19 IMPACT ANALYSIS 25
3.1. Impact Assessment of COVID-19 Pandemic, By Region 25
CHAPTER NO. 4 : ALUMINUM CAPS & CLOSURES MARKET – INDUSTRY ANALYSIS 26
4.1. Introduction 26
4.2. Market Drivers 27
4.2.1. Growth in Beverage Packaging 27
4.2.2. Demand for Convenience and Portability 28
4.3. Market Restraints 28
4.3.1. Restraining Factor Analysis 28
4.4. Market Opportunities 29
4.4.1. Market Opportunity Analysis 29
4.5. Porter’s Five Forces Analysis 29
4.6. Value Chain Analysis 30
CHAPTER NO. 5 : KEY INVESTMENT POCKETS ANALYSIS 31
5.1. Top Investment Pockets 31
5.1.1.1. Aluminum Caps & Closures Market Attractiveness Analysis, By Type 31
5.1.1.2. Aluminum Caps & Closures Market Attractiveness Analysis, By Application 31
5.2. Product Life Cycle Analysis 32
5.3. Incremental Revenue Growth Opportunity, 2023 – 2030 33
5.3.1. Type 33
5.3.2. Application 33
CHAPTER NO. 6 : IMPORT EXPORT ANALYSIS 34
6.1. Import Analysis by Region 34
6.1.1. Global Aluminum Caps & Closures Market Import Volume, By Region, 2017 – 2022 (K Units) 34
6.2. Export Analysis by Region 34
6.2.1. Global Aluminum Caps & Closures Market Export Volume, By Region, 2017 – 2022 (K Units) 34
CHAPTER NO. 7 : DEMAND SUPPLY ANALYSIS 35
7.1. Demand Analysis by Region 35
7.1.1. Global Aluminum Caps & Closures Market Demand Volume, By Region, 2017 – 2022 (K Units) 35
7.2. Supply Analysis by Region 35
7.2.1. Global Aluminum Caps & Closures Market Supply Volume, By Region, 2017 – 2022 (K Units) 35
CHAPTER NO. 8 : MARKET POSITIONING OF KEY PLAYERS 36
8.1. Company Market Share Analysis –2020 and 2022 36
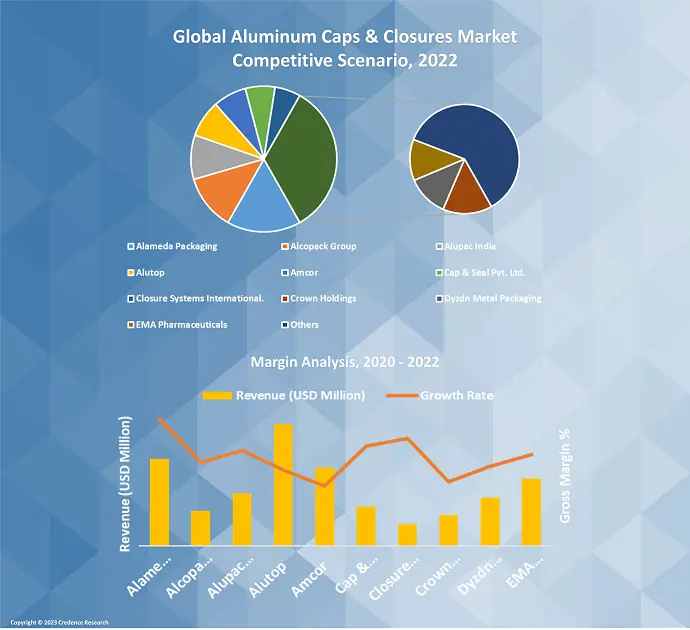
8.1.1. Global Aluminum Caps & Closures Market: Company Market Share, 2022 36
8.1.2. Global Aluminum Caps & Closures Market: Company Market Share, 2022 36
8.1. Global Aluminum Caps & Closures Market Company Volume Market Share, 2022 37
8.2. Global Aluminum Caps & Closures Market Company Revenue Market Share, 2022 38
8.3. Market Position of Key Players 2022 39
8.3.1. Market Position of Key Players, 2022 39
8.4. Strategic Developments 40
8.4.1. Acquisitions & Mergers 40
8.4.2. New Product Launch 40
8.4.3. Regional Expansion 40
CHAPTER NO. 9 : ALUMINUM CAPS & CLOSURES MARKET – BY TYPE SEGMENT ANALYSIS 41
9.1. Aluminum Caps & Closures Market Overview, by Type Segment 41
9.1.1. Global Aluminum Caps & Closures Market Volume Share, By Type, 2022 & 2030 42
9.1.2. Global Aluminum Caps & Closures Market Revenue Share, By Type, 2022 & 2030 42
9.2. Roll-On-Pilfer-Proof 43
9.2.1. Global Roll-On-Pilfer-Proof Aluminum Caps & Closures Market Volume, By Region, 2017 – 2022 (K Units) 43
9.2.2. Global Roll-On-Pilfer-Proof Aluminum Caps & Closures Market Revenue, By Region, 2017 – 2022 (USD Million) 44
9.3. Easy open ends 45
9.3.1. Global Easy open ends Aluminum Caps & Closures Market Volume, By Region, 2017 – 2022 (K Units) 45
9.3.2. Global Roll-On-Pilfer-Proof Aluminum Caps & Closures Market Revenue, By Region, 2017 – 2022 (USD Million) 46
9.4. Non-refillable closures 47
9.4.1. Global Non-refillable closures Aluminum Caps & Closures Market Volume, By Region, 2017 – 2022 (K Units) 47
9.4.2. Global Non-refillable closures Aluminum Caps & Closures Market Revenue, By Region, 2017 – 2022 (USD Million) 48
9.5. Others 49
9.5.1. Global Others Aluminum Caps & Closures Market Volume, By Region, 2017 – 2022 (K Units) 49
9.5.2. Global Others Aluminum Caps & Closures Market Revenue, By Region, 2017 – 2022 (USD Million) 50
CHAPTER NO. 10 : ALUMINUM CAPS & CLOSURES MARKET – BY APPLICATION SEGMENT ANALYSIS 53
10.1. Aluminum Caps & Closures Market Overview, by Application Segment 53
10.1.1. Global Aluminum Caps & Closures Market Volume Share, By Application, 2022 & 2030 54
10.1.2. Global Aluminum Caps & Closures Market Revenue Share, By Application, 2022 & 2030 54
10.2. Beverage 55
10.2.1. Global Aluminum Caps & Closures for Beverage Market Volume, By Region, 2017 – 2022 (K Units) 55
10.2.2. Global Aluminum Caps & Closures for Beverage Market Revenue, By Region, 2017 – 2022 (USD Million) 56
10.3. Pharmaceutical 57
10.3.1. Global Aluminum Caps & Closures for Pharmaceutical Market Volume, By Region, 2017 – 2022 (K Units) 57
10.3.2. Global Aluminum Caps & Closures for Pharmaceutical Market Revenue, By Region, 2017 – 2022 (USD Million) 58
10.4. Food 59
10.4.1. Global Aluminum Caps & Closures for Food Market Volume, By Region, 2017 – 2022 (K Units) 59
10.4.2. Global Aluminum Caps & Closures for Food Market Revenue, By Region, 2017 – 2022 (USD Million) 60
10.5. Home & personal care 61
10.5.1. Global Aluminum Caps & Closures for Home & personal care Market Volume, By Region, 2017 – 2022 (K Units) 61
10.5.2. Global Aluminum Caps & Closures for Home & personal care Market Revenue, By Region, 2017 – 2022 (USD Million) 62
10.6. Others 63
10.6.1. Global Aluminum Caps & Closures for Others Market Volume, By Region, 2017 – 2022 (K Units) 63
10.6.2. Global Aluminum Caps & Closures for Others Market Revenue, By Region, 2017 – 2022 (USD Million) 64
CHAPTER NO. 11 : ALUMINUM CAPS & CLOSURES MARKET – REGIONAL ANALYSIS 65
11.1. Aluminum Caps & Closures Market Overview, by Region Segment 65
11.1.1. Global Aluminum Caps & Closures Market Volume Share, By Region, 2022 & 2030 66
11.1.2. Global Aluminum Caps & Closures Market Revenue Share, By Region, 2022 & 2030 66
11.1.3. Global Aluminum Caps & Closures Market Volume, By Region, 2017 – 2022 (K Units) 67
11.1.4. Global Aluminum Caps & Closures Market Revenue, By Region, 2017 – 2022 (USD Million) 68
11.1.5. Global Aluminum Caps & Closures Market Volume, By Type, 2017 – 2022 (K Units) 69
11.1.6. Global Aluminum Caps & Closures Market Revenue, By Type, 2017 – 2022 (USD Million) 70
11.1.7. Global Aluminum Caps & Closures Market Volume, By Application, 2017 – 2022 (K Units) 71
11.1.8. Global Aluminum Caps & Closures Market Revenue, By Application, 2017 – 2022 (USD Million) 72
11.2. North America 73
11.2.1. North America Aluminum Caps & Closures Market Volume, By Country, 2017 – 2022 (K Units) 74
11.2.2. North America Aluminum Caps & Closures Market Revenue, By Country, 2017 – 2022 (USD Million) 74
11.2.2.1. North America Aluminum Caps & Closures Market Volume, By Type, 2017 – 2022 (K Units) 75
11.2.3. North America Aluminum Caps & Closures Market Revenue, By Type, 2017 – 2022 (USD Million) 76
11.2.4. North America Aluminum Caps & Closures Market Volume, By Application, 2017 – 2022 (K Units) 77
11.2.5. North America Aluminum Caps & Closures Market Revenue, By Application, 2017 – 2022 (USD Million) 78
11.2.6. U.S. 79
11.2.7. Canada 79
11.2.8. Mexico 79
11.3. Europe 80
11.3.1. Europe Aluminum Caps & Closures Market Volume, By Country, 2017 – 2022 (K Units) 81
11.3.2. Europe Aluminum Caps & Closures Market Revenue, By Country, 2017 – 2022 (USD Million) 82
11.3.3. Europe Aluminum Caps & Closures Market Volume, By Type, 2017 – 2022 (K Units) 83
11.3.4. Europe Aluminum Caps & Closures Market Revenue, By Type, 2017 – 2022 (USD Million) 84
11.3.5. Europe Aluminum Caps & Closures Market Volume, By Application, 2017 – 2022 (K Units) 85
11.3.6. Europe Aluminum Caps & Closures Market Revenue, By Application, 2017 – 2022 (USD Million) 86
11.3.7. UK 87
11.3.8. France 87
11.3.9. Germany 87
11.3.10. Italy 87
11.3.11. Spain 87
11.3.12. Russia 87
11.3.13. BENELUX 87
11.3.14. Sweden 87
11.3.15. Denmark 87
11.3.16. Poland 87
11.3.17. Austria 87
11.3.18. Rest of Europe 87
11.4. Asia Pacific 88
11.4.1. Asia Pacific Aluminum Caps & Closures Market Volume, By Country, 2017 – 2022 (K Units) 89
11.4.2. Asia Pacific Aluminum Caps & Closures Market Revenue, By Country, 2017 – 2022 (USD Million) 90
11.4.3. Asia Pacific Aluminum Caps & Closures Market Volume, By Type, 2017 – 2022 (K Units) 91
11.4.4. Asia Pacific Aluminum Caps & Closures Market Revenue, By Type, 2017 – 2022 (USD Million) 92
11.4.5. Asia Pacific Aluminum Caps & Closures Market Volume, By Application, 2017 – 2022 (K Units) 93
11.4.6. Asia Pacific Aluminum Caps & Closures Market Revenue, By Application, 2017 – 2022 (USD Million) 94
11.4.7. China 95
11.4.8. Japan 95
11.4.9. South Korea 95
11.4.10. India 95
11.4.11. Thailand 95
11.4.12. Indonesia 95
11.4.13. Vietnam 95
11.4.14. Malaysia 95
11.4.15. Philippines 95
11.4.16. Taiwan 95
11.4.17. Rest of Asia Pacific 95
11.5. Latin America 96
11.5.1. Latin America Aluminum Caps & Closures Market Volume, By Country, 2017 – 2022 (K Units) 97
11.5.2. Latin America Aluminum Caps & Closures Market Revenue, By Country, 2017 – 2022 (USD Million) 98
11.5.3. Latin America Aluminum Caps & Closures Market Volume, By Type, 2017 – 2022 (K Units) 99
11.5.4. Latin America Aluminum Caps & Closures Market Revenue, By Type, 2017 – 2022 (USD Million) 100
11.5.5. Latin America Aluminum Caps & Closures Market Volume, By Application, 2017 – 2022 (K Units) 101
11.5.6. Latin America Aluminum Caps & Closures Market Revenue, By Application, 2017 – 2022 (USD Million) 102
11.5.7. Brazil 103
11.5.8. Argentina 103
11.5.9. Colombia 103
11.5.10. Chile 103
11.5.11. Peru 103
11.5.12. Rest of Latin America 103
11.6. The Middle-East 104
11.6.1. Middle East Aluminum Caps & Closures Market Volume, By Country, 2017 – 2022 (K Units) 105
11.6.2. Middle East Aluminum Caps & Closures Market Revenue, By Country, 2017 – 2022 (USD Million) 106
11.6.3. Middle East Aluminum Caps & Closures Market Volume, By Type, 2017 – 2022 (K Units) 107
11.6.4. Middle East Aluminum Caps & Closures Market Revenue, By Type, 2017 – 2022 (USD Million) 108
11.6.5. Middle East Aluminum Caps & Closures Market Volume, By Application, 2017 – 2022 (K Units) 109
11.6.6. Middle East Aluminum Caps & Closures Market Revenue, By Application, 2017 – 2022 (USD Million) 110
11.6.7. GCC Countries 111
11.6.8. Israel 111
11.6.9. Turkey 111
11.6.10. Iran 111
11.6.11. Rest of Middle East & Africa 111
11.7. Africa 112
11.7.1. Africa Aluminum Caps & Closures Market Volume, By Country, 2017 – 2022 (K Units) 113
11.7.2. Africa Aluminum Caps & Closures Market Revenue, By Country, 2017 – 2022 (USD Million) 114
11.7.3. Africa Aluminum Caps & Closures Market Volume, By Type, 2017 – 2022 (K Units) 115
11.7.4. Africa Aluminum Caps & Closures Market Revenue, By Type, 2017 – 2022 (USD Million) 116
11.7.5. Africa Aluminum Caps & Closures Market Volume, By Application, 2017 – 2022 (K Units) 117
11.7.6. Africa Aluminum Caps & Closures Market Revenue, By Application, 2017 – 2022 (USD Million) 118
11.7.7. South Africa 119
11.7.8. Egypt 119
11.7.9. Nigeria 119
11.7.10. Algeria 119
11.7.11. Morocco 119
11.7.12. Rest of Africa 119
CHAPTER NO. 12 : COMPANY PROFILES 120
12.1. Alameda Packaging 120
12.1.1. Company Overview 120
12.1.2. Product Portfolio 120
12.1.3. Financial Overview 120
12.2. Alcopack Group 121
12.3. Alupac India 121
12.4. Alutop 121
12.5. Amcor 121
12.6. Cap & Seal Pvt. Ltd. 121
12.7. Closure Systems International. 121
12.8. Crown Holdings 121
12.9. Dyzdn Metal Packaging 121
12.10. EMA Pharmaceuticals 121
12.11. Federfin Tech S.R.L 121
12.12. Guala Closure 121
12.13. Helicap Closures 121
12.14. Herti JSC 121
CHAPTER NO. 13 : RESEARCH METHODOLOGY 122
13.1. Research Methodology 122
13.2. Phase I – Secondary Research 123
13.3. Phase II – Data Modeling 123
13.3.1. Company Share Analysis Model 124
13.3.2. Revenue Based Modeling 124
13.4. Phase III – Primary Research 125
13.5. Research Limitations 126
13.5.1. Assumptions 126
List of Figures
FIG NO. 1. Global Aluminum Caps & Closures Market Volume & Revenue, 2017 – 2030 (K Units) (USD Million) 24
FIG NO. 2. Porter’s Five Forces Analysis for Global Aluminum Caps & Closures Market 29
FIG NO. 3. Value Chain Analysis for Global Aluminum Caps & Closures Market 30
FIG NO. 4. Market Attractiveness Analysis, By Type 31
FIG NO. 5. Market Attractiveness Analysis, By Application 31
FIG NO. 6. Product Life Cycle Analysis 32
FIG NO. 7. Incremental Revenue Growth Opportunity by Type 33
FIG NO. 8. Incremental Revenue Growth Opportunity by Application 33
FIG NO. 9. Company Share Analysis, 2020 36
FIG NO. 10. Company Share Analysis, 2022 36
FIG NO. 11. Aluminum Caps & Closures Market – Company Volume Market Share, 2022 37
FIG NO. 12. Aluminum Caps & Closures Market – Company Revenue Market Share, 2022 38
FIG NO. 13. Market Position of Key Players, 2022 39
FIG NO. 14. Global Aluminum Caps & Closures Market Volume Share, By Type, 2022 & 2030 42
FIG NO. 15. Global Aluminum Caps & Closures Market Revenue Share, By Type, 2022 & 2030 42
FIG NO. 16. Global Aluminum Caps & Closures Market for Roll-On-Pilfer-Proof, Volume & Revenue (K Units) (USD Million) 2017 – 2030 43
FIG NO. 17. Global Aluminum Caps & Closures Market for Easy open ends, Volume & Revenue (K Units) (USD Million) 2017 – 2030 45
FIG NO. 18. Global Aluminum Caps & Closures Market for Non-refillable closures, Volume & Revenue (K Units) (USD Million) 2017 – 2030 47
FIG NO. 19. Global Aluminum Caps & Closures Market for Others, Volume & Revenue (K Units) (USD Million) 2017 – 2030 49
FIG NO. 20. Global Aluminum Caps & Closures Market for Type 5, Volume & Revenue (K Units) (USD Million) 2017 – 2030 51
FIG NO. 21. Global Aluminum Caps & Closures Market Volume Share, By Application, 2022 & 2030 54
FIG NO. 22. Global Aluminum Caps & Closures Market Revenue Share, By Application, 2022 & 2030 54
FIG NO. 23. Global Aluminum Caps & Closures Market for Beverage, Volume & Revenue (K Units) (USD Million) 2017 – 2030 55
FIG NO. 24. Global Aluminum Caps & Closures Market for Pharmaceutical, Volume & Revenue (K Units) (USD Million) 2017 – 2030 57
FIG NO. 25. Global Aluminum Caps & Closures Market for Food, Volume & Revenue (K Units) (USD Million) 2017 – 2030 59
FIG NO. 26. Global Aluminum Caps & Closures Market for Home & personal care, Volume & Revenue (K Units) (USD Million) 2017 – 2030 61
FIG NO. 27. Global Aluminum Caps & Closures Market for Others, Volume & Revenue (K Units) (USD Million) 2017 – 2030 63
FIG NO. 28. Global Aluminum Caps & Closures Market Volume Share, By Region, 2022 & 2030 66
FIG NO. 29. Global Aluminum Caps & Closures Market Revenue Share, By Region, 2022 & 2030 66
FIG NO. 30. North America Aluminum Caps & Closures Market Volume & Revenue, 2017 – 2022 (K Units) (USD Million) 73
FIG NO. 31. Europe Aluminum Caps & Closures Market Volume & Revenue, 2017 – 2022 (K Units) (USD Million) 80
FIG NO. 32. Asia Pacific Aluminum Caps & Closures Market Volume & Revenue, 2017 – 2022 (K Units) (USD Million) 88
FIG NO. 33. Latin America Aluminum Caps & Closures Market Volume & Revenue, 2017 – 2022 (K Units) (USD Million) 96
FIG NO. 34. The Middle-East Aluminum Caps & Closures Market Volume & Revenue, 2017 – 2022 (K Units) (USD Million) 104
FIG NO. 35. Africa Aluminum Caps & Closures Market Volume & Revenue, 2017 – 2022 (K Units) (USD Million) 112
FIG NO. 36. Research Methodology – Detailed View 122
FIG NO. 37. Research Methodology 123
List of Tables
TABLE NO. 1. : Global Aluminum Caps & Closures Market: Snapshot 20
TABLE NO. 2. : Drivers for the Aluminum Caps & Closures Market: Impact Analysis 25
TABLE NO. 3. : Restraints for the Aluminum Caps & Closures Market: Impact Analysis 26
TABLE NO. 4. : Global Aluminum Caps & Closures Market Import Volume, By End-user, 2017 – 2022 (K Units) 32
TABLE NO. 5. : Global Aluminum Caps & Closures Market Export Volume, By End-user, 2017 – 2022 (K Units) 32
TABLE NO. 6. : Global Aluminum Caps & Closures Market Demand Volume, By End-user, 2017 – 2022 (K Units) 33
TABLE NO. 7. : Global Aluminum Caps & Closures Market Supply Volume, By End-user, 2017 – 2022 (K Units) 33
TABLE NO. 8. : Global Roll-On-Pilfer-Proof Aluminum Caps & Closures Market Volume, By Region, 2017 – 2022 (K Units) 41
TABLE NO. 9. : Global Roll-On-Pilfer-Proof Aluminum Caps & Closures Market Volume, By Region, 2023– 2030 (K Units) 41
TABLE NO. 10. : Global Roll-On-Pilfer-Proof Aluminum Caps & Closures Market Revenue, By Region, 2017 – 2022 (USD Million) 42
TABLE NO. 11. : Global Roll-On-Pilfer-Proof Aluminum Caps & Closures Market Revenue, By Region, 2023– 2030 (USD Million) 42
TABLE NO. 12. : Global Easy open ends Aluminum Caps & Closures Market Volume, By Region, 2017 – 2022 (K Units) 43
TABLE NO. 13. : Global Easy open ends Aluminum Caps & Closures Market Volume, By Region, 2023– 2030 (K Units) 43
TABLE NO. 14. : Global Roll-On-Pilfer-Proof Aluminum Caps & Closures Market Revenue, By Region, 2017 – 2022 (USD Million) 44
TABLE NO. 15. : Global Roll-On-Pilfer-Proof Aluminum Caps & Closures Market Revenue, By Region, 2023– 2030 (USD Million) 44
TABLE NO. 16. : Global Non-refillable closures Aluminum Caps & Closures Market Volume, By Region, 2017 – 2022 (K Units) 45
TABLE NO. 17. : Global Non-refillable closures Aluminum Caps & Closures Market Volume, By Region, 2023– 2030 (K Units) 45
TABLE NO. 18. : Global Non-refillable closures Aluminum Caps & Closures Market Revenue, By Region, 2017 – 2022 (USD Million) 46
TABLE NO. 19. : Global Non-refillable closures Aluminum Caps & Closures Market Revenue, By Region, 2023– 2030 (USD Million) 46
TABLE NO. 20. : Global Others Aluminum Caps & Closures Market Revenue, By Region, 2017 – 2022 (USD Million) 47
TABLE NO. 21. : Global Others Aluminum Caps & Closures Market Volume, By Region, 2023– 2030 (K Units) 47
TABLE NO. 22. : Global Others Aluminum Caps & Closures Market Revenue, By Region, 2017 – 2022 (USD Million) 48
TABLE NO. 23. : Global Others Aluminum Caps & Closures Market Revenue, By Region, 2023– 2030 (USD Million) 48
TABLE NO. 24. : Global Type 5 Aluminum Caps & Closures Market Volume, By Region, 2017 – 2022 (K Units) 49
TABLE NO. 25. : Global Type 5 Aluminum Caps & Closures Market Volume, By Region, 2023– 2030 (K Units) 49
TABLE NO. 26. : Global Type 5 Aluminum Caps & Closures Market Revenue, By Region, 2017 – 2022 (USD Million) 50
TABLE NO. 27. : Global Type 5 Aluminum Caps & Closures Market Revenue, By Region, 2023– 2030 (USD Million) 50
TABLE NO. 28. : Global Aluminum Caps & Closures for Beverage Market Volume, By Region, 2017 – 2022 (K Units) 53
TABLE NO. 29. : Global Aluminum Caps & Closures for Beverage Market Volume, By Region, 2023– 2030 (K Units) 53
TABLE NO. 30. : Global Aluminum Caps & Closures for Beverage Market Revenue, By Region, 2017 – 2022 (USD Million) 54
TABLE NO. 31. : Global Aluminum Caps & Closures for Beverage Market Revenue, By Region, 2023– 2030 (USD Million) 54
TABLE NO. 32. : Global Aluminum Caps & Closures for Pharmaceutical Market Volume, By Region, 2017 – 2022 (K Units) 55
TABLE NO. 33. : Global Aluminum Caps & Closures for Pharmaceutical Market Volume, By Region, 2023– 2030 (K Units) 55
TABLE NO. 34. : Global Aluminum Caps & Closures for Pharmaceutical Market Revenue, By Region, 2017 – 2022 (USD Million) 56
TABLE NO. 35. : Global Aluminum Caps & Closures for Pharmaceutical Market Revenue, By Region, 2023– 2030 (USD Million) 56
TABLE NO. 36. : Global Aluminum Caps & Closures for Food Market Volume, By Region, 2017 – 2022 (K Units) 57
TABLE NO. 37. : Global Aluminum Caps & Closures for Food Market Volume, By Region, 2023– 2030 (K Units) 57
TABLE NO. 38. : Global Aluminum Caps & Closures for Food Market Revenue, By Region, 2017 – 2022 (USD Million) 58
TABLE NO. 39. : Global Aluminum Caps & Closures for Food Market Revenue, By Region, 2023– 2030 (USD Million) 58
TABLE NO. 40. : Global Aluminum Caps & Closures for Home & personal care Market Volume, By Region, 2017 – 2022 (K Units) 59
TABLE NO. 41. : Global Aluminum Caps & Closures for Home & personal care Market Volume, By Region, 2023– 2030 (K Units) 59
TABLE NO. 42. : Global Aluminum Caps & Closures for Home & personal care Market Revenue, By Region, 2017 – 2022 (USD Million) 60
TABLE NO. 43. : Global Aluminum Caps & Closures for Home & personal care Market Revenue, By Region, 2023– 2030 (USD Million) 60
TABLE NO. 44. : Global Aluminum Caps & Closures for Others Market Volume, By Region, 2017 – 2022 (K Units) 61
TABLE NO. 45. : Global Aluminum Caps & Closures for Others Market Volume, By Region, 2023– 2030 (K Units) 61
TABLE NO. 46. : Global Aluminum Caps & Closures for Others Market Revenue, By Region, 2017 – 2022 (USD Million) 62
TABLE NO. 47. : Global Aluminum Caps & Closures for Others Market Revenue, By Region, 2023– 2030 (USD Million) 62
TABLE NO. 48. : Global Aluminum Caps & Closures Market Volume, By Region, 2017 – 2022 (K Units) 65
TABLE NO. 49. : Global Aluminum Caps & Closures Market Volume, By Region, 2023– 2030 (K Units) 65
TABLE NO. 50. : Global Aluminum Caps & Closures Market Revenue, By Region, 2017 – 2022 (USD Million) 66
TABLE NO. 51. : Global Aluminum Caps & Closures Market Revenue, By Region, 2023– 2030 (USD Million) 66
TABLE NO. 52. : Global Aluminum Caps & Closures Market Volume, By Type, 2017 – 2022 (K Units) 67
TABLE NO. 53. : Global Aluminum Caps & Closures Market Volume, By Type, 2023– 2030 (K Units) 67
TABLE NO. 54. : Global Aluminum Caps & Closures Market Revenue, By Type, 2017 – 2022 (USD Million) 68
TABLE NO. 55. : Global Aluminum Caps & Closures Market Revenue, By Type, 2023– 2030 (USD Million) 68
TABLE NO. 56. : Global Aluminum Caps & Closures Market Volume, By Application, 2017 – 2022 (K Units) 69
TABLE NO. 57. : Global Aluminum Caps & Closures Market Volume, By Application, 2023– 2030 (K Units) 69
TABLE NO. 58. : Global Aluminum Caps & Closures Market Revenue, By Application, 2017 – 2022 (USD Million) 70
TABLE NO. 59. : Global Aluminum Caps & Closures Market Revenue, By Application, 2023– 2030 (USD Million) 70
TABLE NO. 60. : North America Aluminum Caps & Closures Market Volume, By Country, 2017 – 2022 (K Units) 72
TABLE NO. 61. : North America Aluminum Caps & Closures Market Volume, By Country, 2023– 2030 (K Units) 72
TABLE NO. 62. : North America Aluminum Caps & Closures Market Revenue, By Country, 2017 – 2022 (USD Million) 72
TABLE NO. 63. : North America Aluminum Caps & Closures Market Revenue, By Country, 2023– 2030 (USD Million) 72
TABLE NO. 64. : North America Aluminum Caps & Closures Market Volume, By Type, 2017 – 2022 (K Units) 73
TABLE NO. 65. : North America Aluminum Caps & Closures Market Volume, By Type, 2023– 2030 (K Units) 73
TABLE NO. 66. : North America Aluminum Caps & Closures Market Revenue, By Type, 2017 – 2022 (USD Million) 74
TABLE NO. 67. : North America Aluminum Caps & Closures Market Revenue, By Type, 2023– 2030 (USD Million) 74
TABLE NO. 68. : North America Aluminum Caps & Closures Market Volume, By Application, 2017 – 2022 (K Units) 75
TABLE NO. 69. : North America Aluminum Caps & Closures Market Volume, By Application, 2023– 2030 (K Units) 75
TABLE NO. 70. : North America Aluminum Caps & Closures Market Revenue, By Application, 2017 – 2022 (USD Million) 76
TABLE NO. 71. : North America Aluminum Caps & Closures Market Revenue, By Application, 2023– 2030 (USD Million) 76
TABLE NO. 72. : Europe Aluminum Caps & Closures Market Volume, By Country, 2017 – 2022 (K Units) 79
TABLE NO. 73. : Europe Aluminum Caps & Closures Market Volume, By Country, 2023– 2030 (K Units) 79
TABLE NO. 74. : Europe Aluminum Caps & Closures Market Revenue, By Country, 2017 – 2022 (USD Million) 80
TABLE NO. 75. : Europe Aluminum Caps & Closures Market Revenue, By Country, 2023– 2030 (USD Million) 80
TABLE NO. 76. : Europe Aluminum Caps & Closures Market Volume, By Type, 2017 – 2022 (K Units) 81
TABLE NO. 77. : Europe Aluminum Caps & Closures Market Volume, By Type, 2023– 2030 (K Units) 81
TABLE NO. 78. : Europe Aluminum Caps & Closures Market Revenue, By Type, 2017 – 2022 (USD Million) 82
TABLE NO. 79. : Europe Aluminum Caps & Closures Market Revenue, By Type, 2023– 2030 (USD Million) 82
TABLE NO. 80. : Europe Aluminum Caps & Closures Market Volume, By Application, 2017 – 2022 (K Units) 83
TABLE NO. 81. : Europe Aluminum Caps & Closures Market Volume, By Application, 2023– 2030 (K Units) 83
TABLE NO. 82. : Europe Aluminum Caps & Closures Market Revenue, By Application, 2017 – 2022 (USD Million) 84
TABLE NO. 83. : Europe Aluminum Caps & Closures Market Revenue, By Application, 2023– 2030 (USD Million) 84
TABLE NO. 84. : Asia Pacific Aluminum Caps & Closures Market Volume, By Country, 2017 – 2022 (K Units) 87
TABLE NO. 85. : Asia Pacific Aluminum Caps & Closures Market Volume, By Country, 2023– 2030 (K Units) 87
TABLE NO. 86. : Asia Pacific Aluminum Caps & Closures Market Revenue, By Country, 2017 – 2022 (USD Million) 88
TABLE NO. 87. : Asia Pacific Aluminum Caps & Closures Market Revenue, By Country, 2023– 2030 (USD Million) 88
TABLE NO. 88. : Asia Pacific Aluminum Caps & Closures Market Volume, By Type, 2017 – 2022 (K Units) 89
TABLE NO. 89. : Asia Pacific Aluminum Caps & Closures Market Volume, By Type, 2023– 2030 (K Units) 89
TABLE NO. 90. : Asia Pacific Aluminum Caps & Closures Market Revenue, By Type, 2017 – 2022 (USD Million) 90
TABLE NO. 91. : Asia Pacific Aluminum Caps & Closures Market Revenue, By Type, 2023– 2030 (USD Million) 90
TABLE NO. 92. : Asia Pacific Aluminum Caps & Closures Market Volume, By Application, 2017 – 2022 (K Units) 91
TABLE NO. 93. : Asia Pacific Aluminum Caps & Closures Market Volume, By Application, 2023– 2030 (K Units) 91
TABLE NO. 94. : Asia Pacific Aluminum Caps & Closures Market Revenue, By Application, 2017 – 2022 (USD Million) 92
TABLE NO. 95. : Asia Pacific Aluminum Caps & Closures Market Revenue, By Application, 2023– 2030 (USD Million) 92
TABLE NO. 96. : Latin America Aluminum Caps & Closures Market Volume, By Country, 2017 – 2022 (K Units) 95
TABLE NO. 97. : Latin America Aluminum Caps & Closures Market Volume, By Country, 2023– 2030 (K Units) 95
TABLE NO. 98. : Latin America Aluminum Caps & Closures Market Revenue, By Country, 2017 – 2022 (USD Million) 96
TABLE NO. 99. : Latin America Aluminum Caps & Closures Market Revenue, By Country, 2023– 2030 (USD Million) 96
TABLE NO. 100. : Latin America Aluminum Caps & Closures Market Volume, By Type, 2017 – 2022 (K Units) 97
TABLE NO. 101. : Latin America Aluminum Caps & Closures Market Volume, By Type, 2023– 2030 (K Units) 97
TABLE NO. 102. : Latin America Aluminum Caps & Closures Market Revenue, By Type, 2017 – 2022 (USD Million) 98
TABLE NO. 103. : Latin America Aluminum Caps & Closures Market Revenue, By Type, 2023– 2030 (USD Million) 98
TABLE NO. 104. : Latin America Aluminum Caps & Closures Market Volume, By Application, 2017 – 2022 (K Units) 99
TABLE NO. 105. : Latin America Aluminum Caps & Closures Market Volume, By Application, 2023– 2030 (K Units) 99
TABLE NO. 106. : Latin America Aluminum Caps & Closures Market Revenue, By Application, 2017 – 2022 (USD Million) 100
TABLE NO. 107. : Latin America Aluminum Caps & Closures Market Revenue, By Application, 2023– 2030 (USD Million) 100
TABLE NO. 108. : Middle East Aluminum Caps & Closures Market Volume, By Country, 2017 – 2022 (K Units) 103
TABLE NO. 109. : Middle East Aluminum Caps & Closures Market Volume, By Country, 2023– 2030 (K Units) 103
TABLE NO. 110. : Middle East Aluminum Caps & Closures Market Revenue, By Country, 2017 – 2022 (USD Million) 104
TABLE NO. 111. : Middle East Aluminum Caps & Closures Market Revenue, By Country, 2023– 2030 (USD Million) 104
TABLE NO. 112. : Middle East Aluminum Caps & Closures Market Volume, By Type, 2017 – 2022 (K Units) 105
TABLE NO. 113. : Middle East Aluminum Caps & Closures Market Volume, By Type, 2023– 2030 (K Units) 105
TABLE NO. 114. : Middle East Aluminum Caps & Closures Market Revenue, By Type, 2017 – 2022 (USD Million) 106
TABLE NO. 115. : Middle East Aluminum Caps & Closures Market Revenue, By Type, 2023– 2030 (USD Million) 106
TABLE NO. 116. : Middle East Aluminum Caps & Closures Market Volume, By Application, 2017 – 2022 (K Units) 107
TABLE NO. 117. : Middle East Aluminum Caps & Closures Market Volume, By Application, 2023– 2030 (K Units) 107
TABLE NO. 118. : Middle East Aluminum Caps & Closures Market Revenue, By Application, 2017 – 2022 (USD Million) 108
TABLE NO. 119. : Middle East Aluminum Caps & Closures Market Revenue, By Application, 2023– 2030 (USD Million) 108
TABLE NO. 120. : Africa Aluminum Caps & Closures Market Volume, By Country, 2017 – 2022 (K Units) 111
TABLE NO. 121. : Africa Aluminum Caps & Closures Market Volume, By Country, 2023– 2030 (K Units) 111
TABLE NO. 122. : Africa Aluminum Caps & Closures Market Revenue, By Country, 2017 – 2022 (USD Million) 112
TABLE NO. 123. : Africa Aluminum Caps & Closures Market Revenue, By Country, 2023– 2030 (USD Million) 112
TABLE NO. 124. : Africa Aluminum Caps & Closures Market Volume, By Type, 2017 – 2022 (K Units) 113
TABLE NO. 125. : Africa Aluminum Caps & Closures Market Volume, By Type, 2023– 2030 (K Units) 113
TABLE NO. 126. : Africa Aluminum Caps & Closures Market Revenue, By Type, 2017 – 2022 (USD Million) 114
TABLE NO. 127. : Africa Aluminum Caps & Closures Market Revenue, By Type, 2023– 2030 (USD Million) 114
TABLE NO. 128. : Africa Aluminum Caps & Closures Market Volume, By Application, 2017 – 2022 (K Units) 115
TABLE NO. 129. : Africa Aluminum Caps & Closures Market Volume, By Application, 2023– 2030 (K Units) 115
TABLE NO. 130. : Africa Aluminum Caps & Closures Market Revenue, By Application, 2017 – 2022 (USD Million) 116
TABLE NO. 131. : Africa Aluminum Caps & Closures Market Revenue, By Application, 2023– 2030 (USD Million) 116