Artificial Island Construction Market Overview:
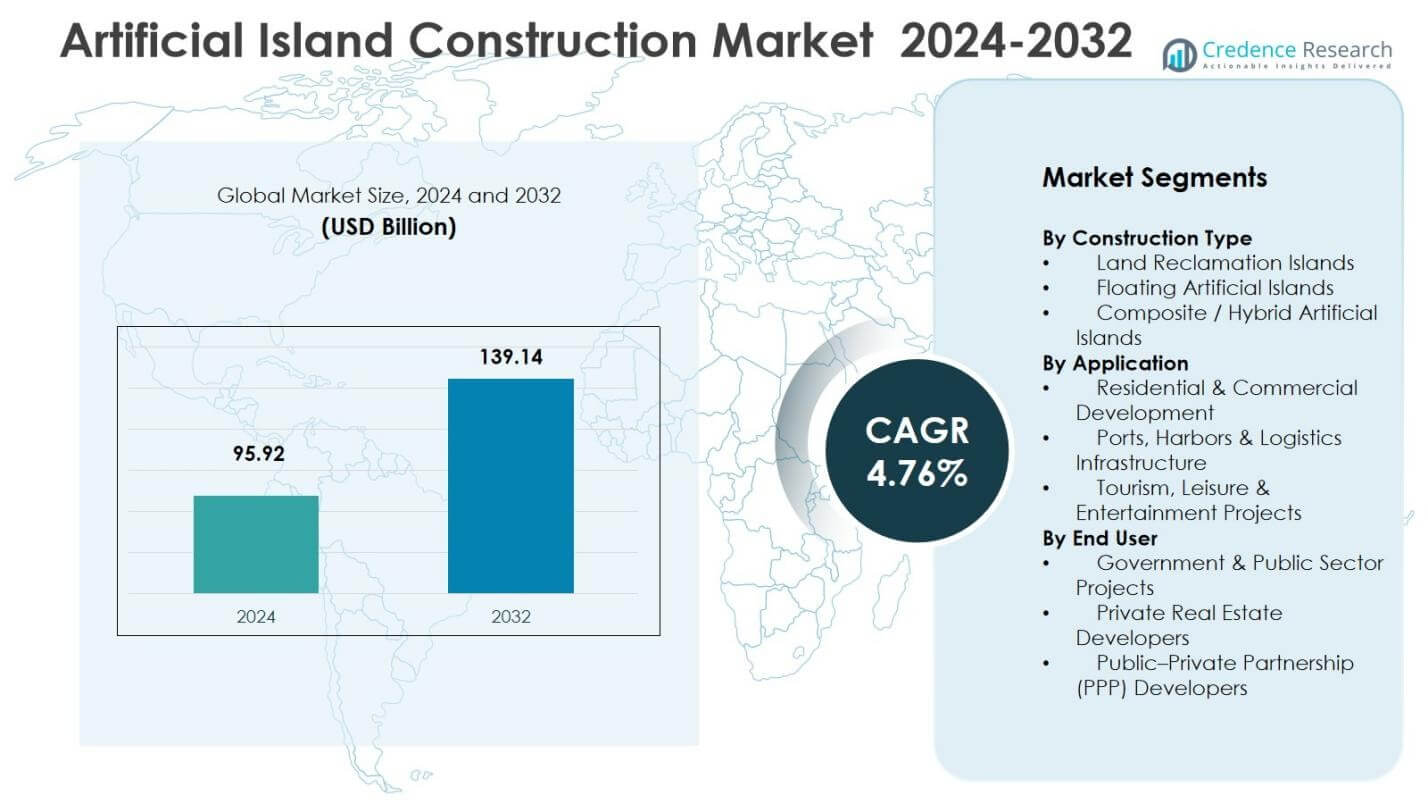
The artificial island construction market was valued at USD 95.92 billion in 2024 and is anticipated to reach USD 139.14 billion by 2032, at a CAGR of 4.76% during the forecast period.
| REPORT ATTRIBUTE |
DETAILS |
| Historical Period |
2020-2023 |
| Base Year |
2024 |
| Forecast Period |
2025-2032 |
| Artificial Island Construction Market Size 2024 |
USD 95.92 Billion |
| Artificial Island Construction Market, CAGR |
4.76% |
| Artificial Island Construction Market Size 2032 |
USD 139.14 Billion |
Artificial Island Construction Market Insights
- The market is driven by rising coastal urban expansion, large-scale port infrastructure development and tourism-led megaprojects, with land reclamation islands holding a 64.2% share in 2024 due to strong adoption in real estate, logistics and maritime development initiatives.
- Market trends reflect increasing focus on sustainability-aligned reclamation, hybrid and floating island concepts and technology-enabled offshore urban districts, while ports, harbors and logistics infrastructure leads applications with a 46.7% share supported by expanding maritime trade and trans-shipment hubs.
- The market structure is shaped by marine engineering leaders and global developers focusing on large-scale offshore programs, with government and public sector projects accounting for a 55.9% share as state-funded coastal infrastructure programs drive long-term investments.
- Asia-Pacific leads with a 41.8% share due to strong investment in coastal expansion and industrial port development, followed by the Middle East and Africa with a 28.5% share driven by tourism islands and luxury coastal real estate megaprojects.
Artificial Island Construction Market segmentation analysis
By construction type
The artificial island construction market by construction type is dominated by land reclamation islands, which accounted for a 64.2% share in 2024. This dominance is driven by large-scale coastal expansion, urban real estate development and strategic infrastructure projects in regions such as the Middle East and Asia. Land reclamation offers structural stability, long-term asset value and suitability for residential, commercial and tourism-focused megaprojects. Floating artificial islands and composite/hybrid artificial islands are gaining traction due to sustainability initiatives and offshore energy developments, but they remain secondary in adoption compared to reclamation-based island construction.
- Nakheel’s Palm Jumeirah in Dubai reclaimed 560 hectares of land using 94 million cubic meters of sand from 2001 to 2003, creating a palm-shaped island for luxury villas and hotels.
Access crucial information at unmatched prices!
Request your sample report today & start making informed decisions powered by Credence Research Inc.!
Download Sample
By application
Ports, harbors and logistics infrastructure emerged as the leading application segment with a 46.7% share in 2024, supported by rising maritime trade capacity expansion, deep-sea port development and trans-shipment hub projects. Governments and private developers prioritize artificial islands for port extensions, cargo terminals and naval infrastructure due to cost-effective land creation and strategic regional positioning. Residential and commercial development follows, driven by luxury waterfront real estate and urban expansion, while tourism, leisure and entertainment projects gain momentum through integrated resort islands and hospitality-led investment initiatives.
- Khalifa Port in Abu Dhabi expanded via an artificial island located 4.6 kilometers offshore, extending the quay wall from 2.3 kilometers to 12.5 kilometers as part of a USD1.1 billion project by AD Ports Group to support container shipping lines.
By end user
Government and public sector projects held the dominant position with a 55.9% share in 2024, reflecting strong involvement of state authorities in maritime infrastructure, defense installations, coastal planning and national development initiatives. Public investment ensures regulatory control, environmental compliance and long-horizon funding for large-scale island construction. Private real estate developers contribute significantly through premium mixed-use and tourism-driven island projects, while public-private partnership developers support capital-intensive ventures by combining state backing with private financing efficiency and technological expertise, particularly in port and coastal urban expansion programs.
Key growth drivers
Coastal urban expansion and land scarcity
Rapid coastal urbanization and limited availability of developable shoreline land significantly drive the artificial island construction market. Governments and private developers increasingly adopt artificial islands to extend coastal cities, support real estate development and expand urban infrastructure without encroaching on mainland ecosystems. High-value projects in tourism hubs, commercial waterfronts and luxury residential districts reinforce demand, particularly in the Middle East and Southeast Asia. Strategic initiatives to develop maritime trade corridors, smart coastal cities and mixed-use urban districts further accelerate investment momentum, making artificial islands a viable solution for land-constrained coastal economies.
- NEOM plans Oxagon as an octagonal port city with the world’s largest floating structure protruding into the Red Sea, featuring water-filled squares, canals, a cruise terminal and logistics hubs.
Port infrastructure development and maritime trade growth
Rising global maritime trade and expansion of deep-sea port infrastructure act as major catalysts for market growth. Artificial islands enable the creation of new cargo terminals, naval bases, logistics hubs and offshore industrial facilities where natural coastal space is insufficient. Governments prioritize artificial land formation to enhance trans-shipment capacity, improve naval positioning and strengthen global trade connectivity. The increasing adoption of port-linked economic zones, offshore storage yards and logistics clusters on reclaimed islands strengthens long-term development pipelines and supports sustained investment in large-scale marine engineering and coastal infrastructure.
- IL&FS Engineering and Construction Co. developed a 335-meter multipurpose berth at Dighi Port in Maharashtra, India, under a 179.84 crore rupee contract. The project includes a 50-acre backup yard and utilities to support bulk, break-bulk and project cargo handling.
Tourism-led megaprojects and destination development
Large-scale tourism, leisure and entertainment-driven investments strongly influence the artificial island construction market. Countries seeking to diversify economic growth invest in destination islands featuring resorts, theme parks, marinas, luxury residences and hospitality zones. Artificial islands provide iconic branding opportunities and attract high-value tourism, international investors and real estate buyers. Government-backed tourism transformation programs, waterfront lifestyle developments and integrated coastal resort districts promote continuous project development. Growing emphasis on experiential tourism, premium waterfront living and international real estate investment reinforces demand across emerging coastal economies.
Key trends and opportunities
Adoption of sustainable and eco-engineered island designs
A major trend shaping the market is the shift toward environmentally conscious and eco-engineered artificial island construction. Developers increasingly incorporate marine-friendly dredging techniques, coastal habitat restoration, renewable energy systems and climate-resilient structural designs. Opportunities emerge in floating island concepts, hybrid-composite platforms and circular shore protection systems that reduce erosion and ecological disruption. Governments and investors favor sustainability-aligned projects to comply with environmental regulations and international climate commitments. Growing focus on blue-economy initiatives, sustainable waterfront development and nature-integrated coastal infrastructure creates significant opportunities for technology-driven and environmentally responsible island engineering.
- Peberholm, constructed as part of the Øresund Bridge project between Denmark and Sweden, used six million cubic meters of dredged seabed material without adding mainland soil or planting vegetation artificially.
Integration of smart infrastructure and offshore economic zones
Another key trend involves the integration of smart urban infrastructure and offshore economic developments within artificial island projects. Developers increasingly design islands as technology-enabled zones featuring smart utilities, digital infrastructure, autonomous transport networks and energy-efficient urban systems. Opportunities expand in offshore business districts, free-trade zones, logistics parks and innovation hubs positioned on artificial islands to attract multinational investments. The convergence of marine engineering, urban technology and economic zoning allows countries to leverage islands as strategic growth corridors, supporting high-value industries and reinforcing global investment attractiveness in coastal economic ecosystems.
- Dubai’s Palm Jebel Ali redevelopment, led by Nakheel, incorporates smart transport grids, renewable energy systems and AI-based infrastructure monitoring to support mixed-use urban living.
Key challenges
High capital investment and long project development cycles
The artificial island construction market faces significant challenges due to high capital requirements, extended project timelines and complex financing structures. Large-scale reclamation and marine engineering projects demand substantial upfront investment, advanced technology and long-term stakeholder commitments, which can limit participation by smaller developers. Extended feasibility approvals, regulatory clearances and multi-phase construction cycles increase financial exposure and operational risk. Market growth may also be constrained by fluctuating material costs, contractor availability and macroeconomic uncertainty affecting infrastructure funding, making cost-management efficiency and structured financing models critical for project success.
Environmental risks, regulatory compliance and public opposition
Environmental sensitivity and regulatory scrutiny present major challenges for artificial island development. Projects must address concerns related to marine biodiversity disruption, coastline erosion, habitat loss and climate-related vulnerabilities such as rising sea levels and storm surges. Strict environmental assessments, international sustainability standards and coastal protection regulations can delay approvals and increase project complexity. Public opposition may arise from ecological groups and coastal communities, intensifying expectations for transparency and environmental responsibility. Developers must adopt mitigation strategies, eco-design practices and resilient engineering solutions to balance development objectives with environmental protection and regulatory compliance.
Regional Analysis
Asia-Pacific
Asia-Pacific leads the artificial island construction market with a 41.8% share, driven by large-scale coastal urbanization, port expansion and tourism-focused megaprojects in China, Japan, South Korea and Southeast Asian economies. Governments invest heavily in land reclamation to support smart coastal cities, logistics corridors and offshore industrial clusters. Strong participation from marine engineering contractors and real estate developers reinforces regional dominance. Rising foreign investment in tourism islands and mixed-use waterfront developments further accelerates project pipelines. Supportive policy frameworks, trade-driven infrastructure programs and sustained capital allocation position Asia-Pacific as the primary growth hub for artificial island development.
Middle East and Africa
The Middle East and Africa region accounts for a 28.5% share, supported by landmark luxury real estate, tourism destinations and maritime infrastructure projects across the UAE, Saudi Arabia and coastal Gulf economies. Governments use artificial islands to diversify economic growth, expand tourism capacity and enhance coastal development strategies. Large-scale destination islands, resort complexes and premium residential districts drive sustained investment momentum. Strategic marine infrastructure, port-linked developments and national transformation programs strengthen long-term demand. Ongoing megaprojects and strong sovereign funding continue to reinforce the region’s position as a leading center for iconic artificial island developments.
Europe
Europe captures a 14.7% share of the artificial island construction market, supported by sustainable coastal engineering initiatives, offshore infrastructure development and port modernization projects in the Netherlands, Belgium, Denmark and the United Kingdom. The region emphasizes environmental compliance, climate-resilient marine structures and eco-engineered reclamation technologies. Investments focus on logistics facilities, coastal protection islands and renewable-energy-linked offshore platforms. Strong participation from dredging and marine engineering firms strengthens project capabilities. Policy alignment with sustainability standards and blue-economy development programs supports steady project deployment.
North America
North America holds a 9.6% share, driven by selective projects related to coastal infrastructure reinforcement, port extensions, naval installations and environmental resilience initiatives in the United States and Canada. Development activity is influenced by strict regulatory frameworks, environmental approvals and long-term funding structures. Investments are directed toward specialized engineering projects, offshore research facilities and coastal resilience programs rather than large luxury island developments. Growing focus on climate adaptation, coastal protection and strategic maritime infrastructure supports niche-scale opportunities.
Latin America
Latin America represents a 5.4% share, with growth supported by emerging tourism developments, coastal urban renewal initiatives and port-linked infrastructure projects in Mexico, Brazil and Caribbean economies. Governments explore artificial island solutions to strengthen tourism competitiveness, expand logistics capacity and support coastal real estate expansion. Project execution remains selective due to investment constraints, regulatory approvals and funding challenges. However, rising interest from global developers, hospitality investors and maritime infrastructure programs encourages gradual pipeline expansion.
Artificial Island Construction Market Segmentations:
By Construction Type
- Land Reclamation Islands
- Floating Artificial Islands
- Composite / Hybrid Artificial Islands
By Application
- Residential & Commercial Development
- Ports, Harbors & Logistics Infrastructure
- Tourism, Leisure & Entertainment Projects
By End User
- Government & Public Sector Projects
- Private Real Estate Developers
- Public–Private Partnership (PPP) Developers
By Geography
- North America
- Europe
- Germany
- France
- U.K.
- Italy
- Spain
- Rest of Europe
- Asia Pacific
- China
- Japan
- India
- South Korea
- South-east Asia
- Rest of Asia Pacific
- Latin America
- Brazil
- Argentina
- Rest of Latin America
- Middle East & Africa
- GCC Countries
- South Africa
- Rest of the Middle East and Africa
Competitive landscape
The competitive landscape in the artificial island construction market is shaped by leading players such as Van Oord, Boskalis, CCCC, Jan De Nul Group, DEME Group, Nakheel Properties, Emaar Properties, Dubai Properties Group, Royal HaskoningDHV and IBC, who collectively influence project execution, technology capability and large-scale reclamation expertise. The market remains moderately consolidated, with marine engineering contractors and dredging specialists holding strategic dominance due to their advanced offshore construction fleets, project management strength and global execution track record. Developers and government-backed entities increasingly collaborate with engineering firms to deliver tourism islands, port extensions, coastal urban districts and mixed-use waterfront projects. Competition centers on technical innovation, environmental compliance, sustainability-aligned engineering and capital-intensive project financing capability.
Shape Your Report to Specific Countries or Regions & Enjoy 30% Off!
Key player analysis
- Van Oord
- Boskalis
- China Communications Construction Co. (CCCC)
- Nakheel Properties
- Dubai Properties Group
- Emaar Properties
- Jan De Nul Group
- DEME Group
- Islands Building Company (IBC)
- Royal HaskoningDHV
Recent developments
- In Dec. 2025, the west artificial island of China’s Shenzhen-Zhongshan Link officially opened to the public following a trial period, serving as a multifunctional hub spanning 137,000 square meters.
- In Nov. 2025, China launched construction of a large mobile floating artificial island designed for deep-sea research and strategic operations in the South China Sea, highlighting an advanced offshore development focus.
- In Oct. 2025, DEME, through the TM Edison joint venture with Jan De Nul Group, installed the final caisson of 2025 at Princess Elisabeth Island in the Belgian North Sea, concluding the offshore campaign with 300 personnel and 15 vessels for the world’s first energy island.
Report coverage
The research report offers an in-depth analysis based on construction type, application, end user and geography. It details leading market players, providing an overview of their business, product offerings, investments, revenue streams and key applications. The report also includes insights into the competitive environment, SWOT analysis, current market trends, and primary drivers and constraints. It examines market dynamics, regulatory scenarios and technological advancements shaping the industry, and provides strategic recommendations for new entrants and established companies.
Future outlook
- The market will witness steady growth as governments and developers continue investing in coastal expansion and marine infrastructure projects.
- Artificial islands will increasingly support smart urban districts, tourism destinations, logistics hubs and mixed-use coastal developments.
- Sustainability-driven engineering practices and eco-friendly reclamation technologies will play a stronger role in project approvals and execution.
- Floating and hybrid artificial island concepts will gain traction as nations explore climate-resilient and adaptable offshore development models.
- Public-private partnerships will expand as large-scale projects require shared financing, risk management and long-term operational collaboration.
- Technological innovation in dredging systems, marine surveying and digital construction planning will enhance project efficiency and safety.
- Demand for port expansion, trans-shipment terminals and maritime logistics infrastructure will continue to support industrial island projects.
- Tourism-focused luxury island developments will gain momentum in growth-oriented coastal economies and global leisure destinations.
- Regulatory compliance, environmental safeguards and stakeholder transparency will remain key determinants of project feasibility and execution.
- Emerging markets in Asia, the Middle East and select Latin American regions will drive future project pipelines and investment opportunities.


