
Market Overview
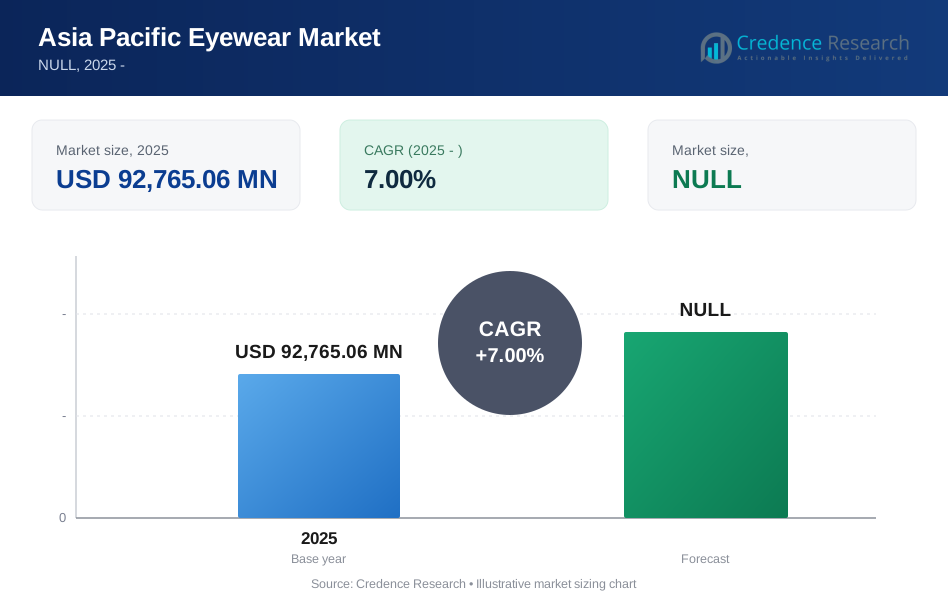
The Asia Pacific Eyewear Market is projected to grow from USD 92,765.06 MN in 2025 to an estimated USD 165,876.97 MN by 2032, with a CAGR of 7.00% from 2025 to 2032.
Growth is primarily driven by rising vision impairment, higher screen exposure, expanding middle-class spending and faster premiumization across urban retail channels.
Asia Pacific leads demand within the broader global industry because of its large consumer base, strong manufacturing footprint and deep retail penetration across China, Japan, India and Southeast Asia.
| REPORT ATTRIBUTE | DETAILS |
|---|---|
| Historical Period: | 2020-2023 |
| Base Year | 2025 |
| Forecast Period | 2025-2032 |
| Asia Pacific Eyewear Market Market Size 2025 | USD 92,765.06 MN |
| Asia Pacific Eyewear Market CAGR | 7.00% |
| Asia Pacific Eyewear Market Market Size 2032 | USD 165,876.97 MN |
Market Insights
- Asia Pacific holds the leading regional position with an estimated 38.4% share in 2025, supported by large-volume prescription eyewear demand and strong optical retail networks.
- Prescription (RX) Glasses represent the leading product segment with an estimated 52.6% market share in 2025 because refractive error correction remains the core purchase driver.
- Key companies shaping competition include Bausch + Lomb Corporation, Zeiss Group, CooperVision Limited, JINS Inc. and EssilorLuxottica.
- Affordable eyewear remains critical, with Upto USD 150 leading demand as value-conscious consumers expand purchases through organized chains and online marketplaces.
- Major market trend centers on digital eye health solutions, omnichannel retailing and demand for lighter lenses, blue-light filtering products and fashion-led frames.

Market Segmentation Analysis
By product, prescription eyewear anchors market demand
On the basis of product, the market is classified into Contact Lenses, Prescription (RX) Glasses and Sunglasses. Prescription (RX) Glasses dominated with 52.6% share in 2025.
Its leadership reflects high prevalence of myopia and astigmatism, routine replacement cycles and growing adoption of premium lens coatings. Consumers increasingly prefer thinner lenses, blue-light filters and branded frames. Key companies active in this segment include Zeiss Group, EssilorLuxottica and JINS Inc.
By price range, value products drive volume leadership
On the basis of price range, the market is classified into Upto USD 150, USD 151-300 and Above USD 300. Upto USD 150 held the largest 48.9% share in 2025.
Strong dominance comes from broad middle-income demand, first-time buyers and higher sales through chain stores and marketplaces. This band benefits from frequent promotional pricing and private-label growth. Key companies participating in this segment include Titan Company Limited, Stylrite Optical and Delite eyewear.
By gender, female consumers lead style-led purchases
On the basis of gender, the market is classified into Male and Female. Female accounted for the largest 51.8% share in 2025.
Demand benefits from stronger participation in fashion eyewear, higher frame replacement frequency and increasing uptake of contact lenses and sunglasses. Premium design preference also supports trading up. Key companies serving this segment include De Rigo Vision S.p.A., EssilorLuxottica and Lapaire.
By distribution channel, physical retail retains purchase trust
On the basis of distribution channel, the market is classified into E-Commerce and Brick & Mortar. Brick & Mortar dominated with 67.3% share in 2025.
Consumers continue to prefer in-store eye testing, frame fitting and lens customization before purchase. Optical chains also support cross-selling of coatings and upgrades. Key companies with strong presence across this channel include Fielmann AG, JINS Inc. and Titan Company Limited.
Key Growth Drivers
Rising vision correction needs expand prescription eyewear demand
Rising vision correction needs are steadily expanding prescription eyewear demand across Asia Pacific, where urban lifestyles, intensive digital device exposure, and earlier onset of refractive errors are increasing routine eye examinations and more frequent prescription updates among children, working adults, and older populations. Prescription glasses remain essential because they combine medical necessity with repeat replacement behavior, especially in markets where myopia is becoming more common at younger ages and vision care is increasingly managed through organized optical retail and clinical channels.
The public health backdrop is especially strong in the region, with the WHO Western Pacific platform showing myopia prevalence rising from about 20 percent in the mid-20th century to nearly 50 percent among adolescents in places such as Singapore and China, and reaching 80 percent among young adults in some areas. This large and recurring need is also visible commercially, as EssilorLuxottica reported Asia-Pacific revenue of 1,702 million euros in the first half of 2025 and operated 1,682 corporate stores at the end of 2025, highlighting how organized chains benefit as consumers seek better diagnostic accuracy, branded lenses, and reliable after-sales support.
Expanding disposable income supports premiumization and fashion adoption
Rising household incomes and the rapid expansion of middle-class consumers are lifting eyewear spending across Asia Pacific beyond basic vision correction, as buyers increasingly treat glasses, sunglasses, and contact lenses as both functional necessities and visible lifestyle products in metropolitan markets such as Tokyo, Shanghai, Seoul, Mumbai, and Singapore. This shift is strengthening demand for branded frames, premium coatings, polarized sunglasses, and daily disposable lenses, while also improving willingness to pay for lightweight materials, better lens durability, and more distinctive design, which is helping brands push eyewear into accessible premium as well as aspirational categories.
The spending base behind this trend is substantial, with the Asian Development Bank projecting Asia’s middle class to rise from 3.2 billion people in 2020 to 4.9 billion by 2030 and account for 85 percent of global middle-class growth, creating a much larger consumer pool for discretionary eyewear upgrades. Major players are already aligning with that demand, as JINS structures its eyewear around main price points of 6,600 yen, 9,900 yen, and 13,900 yen and had reached 778 stores globally by May 2025, including 248 overseas, showing how tiered portfolios are being used to capture both mass and premium demand.
Organized retail and omnichannel expansion improve market access
Eyewear distribution across Asia Pacific is becoming more efficient as branded optical chains, department stores and digital platforms deepen reach. In-store eye tests, virtual try-on tools, click-and-collect models and faster lens fulfillment are reducing purchase friction. These capabilities are especially important in category segments where fitting accuracy, trust and service quality directly influence conversion.
A strong supporting statement comes from large industry participants that continue to invest in store modernization, digital engagement and integrated consumer pathways. Omnichannel models improve conversion by allowing product discovery online and clinical or fitting validation offline. This operating model expands consumer access in both major cities and underserved secondary urban clusters.
Key Trends & Opportunities
Blue-light filtering and digital-use eyewear gain traction
Extended smartphone, laptop and tablet usage continues to reshape product development across Asia Pacific. Consumers increasingly look for anti-fatigue lenses, blue-light filtering coatings and lightweight frames suited to long daily wear. This trend is especially visible among students, office workers and gamers, where visual comfort and aesthetics influence repeat purchases and add-on upgrades.
One supporting statement is that several leading global eyewear groups have expanded portfolios around blue-light management and lens customization, reflecting sustained demand for digital-use products. Retailers are also using digital consultations and vision screening campaigns to position these products more effectively. The trend supports higher attachment rates for premium lens treatments.
Fashion collaboration and limited-edition collections reshape demand
Eyewear increasingly sits within broader fashion consumption, especially in premium sunglasses and female-targeted optical frames. Brands are using celebrity endorsements, designer partnerships and seasonal collections to create urgency and brand affinity. In Asia Pacific, this strategy performs well in trend-sensitive urban clusters where consumers regularly rotate accessories and seek stronger identity-led styling.
This trend also improves margins because buyers often accept higher prices for exclusive design narratives. Younger consumers in Japan, South Korea and China are particularly responsive to style-led launches. Retailers benefit from better footfall and social media engagement, while online channels amplify discovery for new collections and capsule releases.
Untapped secondary cities create large-volume expansion opportunities
Beyond tier-one cities, secondary urban markets and fast-growing suburban clusters offer meaningful room for penetration. Vision testing infrastructure, affordable frame assortments and organized optical retail remain uneven across many parts of India, Indonesia, Vietnam and the Philippines. Companies that combine low-cost formats with dependable diagnostics can build volume and long-term customer retention.
These markets also favor localized assortments, flexible financing and rapid lens delivery. Value-led chains and franchise models can outperform where consumer awareness is improving but premium spending remains selective. This opportunity is particularly attractive for companies with strong sourcing networks and the ability to standardize clinical service quality.
Online contact lens and repeat-purchase ecosystems offer scalable upside
Online contact lens and repeat-purchase ecosystems offer scalable upside across Asia Pacific because the category naturally lends itself to recurring replacement cycles once fitting and prescription validation are complete, especially for daily, two-week, and monthly lenses that can be reordered on a routine schedule. This makes digital retention programs more effective, as brands can combine refill reminders, subscription plans, home delivery, and lens-care bundling to raise customer lifetime value while reducing the friction of repeat buying for convenience-focused consumers. The opportunity is especially relevant in markets where specialty optical retail is unevenly distributed, because direct-to-consumer fulfillment can widen reach without requiring the same store density as traditional dispensing-led models.
CooperVision’s portfolio structure reflects why this works, with a broad range spanning 1-day, two-week, and monthly replacement lenses across nearsightedness, farsightedness, astigmatism, presbyopia, and myopia control needs, giving brands multiple touchpoints for personalized reordering and add-on sales. The commercial scale is already significant, with Alcon reporting 2.8 billion dollars in full-year 2025 contact lens sales, showing how repeatable lens demand can become a major growth engine for digital eyewear ecosystems..
Key Challenges
Price competition and counterfeit risk pressure margins
Intense competition across mass-market frames and sunglasses creates persistent pricing pressure in Asia Pacific. Unorganized sellers and counterfeit products reduce brand differentiation, weaken consumer trust and limit premium conversion. These issues are most visible in price-sensitive markets where customers prioritize affordability over lens technology, clinical validation and warranty-backed purchases.
Established companies must balance scale pricing with product quality and channel discipline. Heavy discounting can erode margins and disrupt retailer relationships. Counterfeit branded eyewear also creates reputational risk, particularly in online marketplaces where verification standards and seller controls vary by country and platform.
Clinical compliance and fit accuracy complicate digital sales
Although e-commerce is expanding, eyewear still depends on prescription accuracy, pupillary distance measurement and frame fit. These requirements create friction for first-time buyers and higher-value progressive lens purchases. Inconsistent eye care infrastructure across countries also limits smooth referrals between diagnostic services and retail fulfillment.
Returns and remakes remain cost challenges when measurements are incomplete or product expectations differ from actual fit. Contact lenses face additional compliance issues because safe use requires proper fitting and consumer education. These constraints slow full online conversion despite strong digital discovery and ordering behavior.
Regional Analysis
North America Asia Pacific Eyewear Market Market Trends
North America accounted for 24.1% of the global Asia Pacific Eyewear Market in 2025. The region shows strong demand for premium prescription lenses, branded sunglasses and medically driven vision correction products. Consumers favor advanced coatings, progressive lenses and omnichannel purchasing that combines online browsing with in-store fitting. High insurance awareness and established optometry networks support regular eye exams and prescription renewal. Competitive intensity remains high, with strong penetration of branded chains, independent opticians and direct-to-consumer platforms.
Asia Pacific Asia Pacific Eyewear Market Market Trends
Asia Pacific accounted for 38.4% of the global Asia Pacific Eyewear Market in 2025. The region leads because of its large myopic population, strong manufacturing capacity and broad spectrum of value to premium demand. China, Japan, India and South Korea anchor volume across prescription glasses, contact lenses and fashion sunglasses. Brick-and-mortar optical chains remain important for eye testing and fitting, while e-commerce grows quickly in contact lenses and affordable frames. Local sourcing advantages and dense retail ecosystems help companies scale product variety and faster replenishment.
Europe Asia Pacific Eyewear Market Market Trends
Europe accounted for 21.7% of the global Asia Pacific Eyewear Market in 2025. Demand in Europe is supported by mature optical retail systems, high awareness of corrective eyewear and preference for premium lens quality. Consumers often prioritize craftsmanship, frame design and durable materials, which supports midrange and premium pricing. Prescription eyewear remains the main category, while sunglasses perform strongly in fashion-led and travel-related channels. Market performance also reflects a balanced mix of independent opticians, chains and luxury brand distribution.
Latin America Asia Pacific Eyewear Market Market Trends
Latin America accounted for 8.4% of the global Asia Pacific Eyewear Market in 2025. The region is driven by rising urbanization, improving access to vision care and growing appetite for affordable branded eyewear. Value pricing plays a central role, especially in prescription frames and entry-level sunglasses. Optical retail remains fragmented, but organized chains are expanding in major cities and improving product availability. Inflation sensitivity affects trading patterns, with many consumers balancing frame aesthetics against total purchase cost.
Middle East & Africa Asia Pacific Eyewear Market Market Trends
Middle East & Africa accounted for 7.4% of the global Asia Pacific Eyewear Market in 2025. Demand is supported by growing retail modernization, increasing fashion awareness and rising diagnosis of refractive errors in urban centers. Sunglasses perform well because of climate conditions and lifestyle consumption, while prescription glasses gain from wider access to optical services. Import dependence remains significant in many markets, influencing pricing and assortment depth. Premium products sell best in higher-income Gulf markets, while value-led optical formats gain traction elsewhere. Regional shares are rounded, so totals may show minor variance.
Market Segmentations
Competitive Landscape
The Asia Pacific Eyewear Market remains highly competitive, with global brands, regional chains and local specialists competing across product quality, design and price. Innovation focus centers on lens coatings, blue-light filtering, lightweight materials and digital vision solutions. Companies are refining product strategies through premium frame collections, affordable private-label assortments and faster replacement cycles.
Distribution remains a critical battleground. Leading players invest in optical chains, e-commerce platforms, franchise expansion and partnerships with clinics, malls and online marketplaces. Competitive intensity is strongest in prescription eyewear and midpriced fashion frames, where brand trust and service quality influence conversion. Large companies hold an advantage in sourcing, marketing and omnichannel execution, while regional players compete through local fit, accessible pricing and market-specific assortments.
Key Player Analysis
- Stylrite Optical
- Bausch + Lomb Corporation
- Zeiss Group
- Delite eyewear
- CooperVision Limited
- De Rigo Vision S.p.A.
- Fielmann AG
- JINS Inc.
- Titan Company Limited
- EssilorLuxottica
- Lapaire
Recent Developments
- In May 2025, Meta launched Ray-Ban Meta glasses in India, bringing its AI-enabled smart eyewear platform to one of Asia Pacific’s largest consumer technology markets. Meta said pre-orders began on May 12 and retail availability started on May 19 through Ray-Ban channels and leading optical and sunglass stores, with pricing starting at INR 29,900. This launch was significant for the regional eyewear industry because it expanded premium smart eyewear beyond Western markets and positioned India as a meaningful growth market for connected eyewear with integrated Meta AI functionality.
- In June 2025, Xiaomi debuted its first AI-powered smart glasses in China, marking the company’s formal entry into the smart eyewear segment in Asia Pacific. The South China Morning Post reported that the glasses were introduced as a “next-generation personal smart gadget,” featuring a 12-megapixel ultra-wide camera, Qualcomm’s AR1 chip, first-person video capture, and voice-query support. The development matters because Xiaomi’s scale and pricing power give it the ability to push AI eyewear into the mainstream in China, which is already one of the region’s most important electronics and wearable-device markets.
- In April 2025, Huawei updated its smart eyewear lineup with a new titanium edition of Eyewear 2, adding gesture controls and AI-powered live translation features. Silicon UK said the product combined a titanium frame design with simultaneous translation capability, while Notebookcheck reported that Huawei positioned the glasses as a China launch with optical lenses and voice-activated interpretation tools. This was a notable innovation for Asia Pacific eyewear because it showed a major regional technology company pushing eyewear beyond style and vision correction into language assistance, hands-free interaction, and wearable AI utility.
- In April 2026, EssilorLuxottica acquired a stake in Top Charoen, Thailand’s largest optical retail chain, strengthening a long-standing partnership in Southeast Asia. Retail Asia reported that Top Charoen has more than 2,000 stores nationwide and that the deal is intended to improve access to eyewear and eye-care services while also supporting the development of emerging wearable technologies across the region. This collaboration stands out because it combines global eyewear manufacturing and branding strength with deep local retail reach in Thailand, making it one of the clearest strategic moves to expand eyewear distribution and innovation across Asia Pacific.
Request a Free Sample
Fill in your details and we'll send you a free sample report.
- Sample data tables & charts
- Research methodology
Need a Custom Version of This Report?
Tailor the scope, geography, or segments to your exact requirements.
- Custom geography or segment scope
- Direct access to our analyst team
Frequently Asked Questions
What is the market size of Asia Pacific Eyewear Market in 2025?
What are the main growth drivers in Asia Pacific Eyewear Market?
What key trend is shaping Asia Pacific Eyewear Market?
Which segment leads Asia Pacific Eyewear Market by product?
Who are the top players in Asia Pacific Eyewear Market?
Table of Content
Chapter 1. Report Introduction
- 1.1 Report Description & Purpose
- 1.1.1 Report Title & Market Definition
- 1.1.2 Unique Selling Propositions (USP) & Key Differentiators
- 1.1.3 Value Proposition for Stakeholders
- 1.2 Research Objectives
- 1.2.1 Market Sizing Objectives (Volume & Revenue)
- 1.2.2 Segmentation Objectives
- 1.2.3 Competitive Intelligence Objectives
- 1.2.4 Forecast & Scenario Objectives
- 1.3 Report Scope
- 1.3.1 Asia Pacific Eyewear Scope – Types & Subtypes Covered
- 1.3.2 Geographic Scope – Regions & Countries Covered
- 1.3.3 Historical Period, Base Year & Forecast Period (2025; forecast to the forecast period)
- 1.3.4 Inclusions & Exclusions
- 1.4 HS Code & Classification Framework
- 1.5 Currency, Units & Pricing Basis
- 1.6 Target Stakeholders
- 1.7 Limitations & Assumptions
Chapter 2. Executive Summary
- 2.1 Global Asia Pacific Eyewear Market Snapshot
- 2.1.1 Market Size – Historical (2025) & Forecast (the forecast period) (2025: USD 92,765.06 MN → forecast year: NULL)
- 2.1.2 Volume & Revenue – Global Totals
- 2.1.3 Key Market Highlights – Top Five Facts
- 2.2 Asia Pacific Eyewear Market Segmentation Snapshot
- 2.2.1 Market Split by Region – 2025 vs.
- 2.3 Competitive Snapshot
- 2.3.1 Top 10 Players by Revenue Share – 2025
- 2.3.2 Top 10 Players by Volume Share – 2025
- 2.3.3 Recent Strategic Developments (18-Month Summary)
- 2.4 Key Investment Highlights & Strategic Conclusions
Chapter 3. Asia Pacific Eyewear Market Dynamics & Industry Analysis
- 3.1 Market Overview & Context
- 3.1.1 Asia Pacific Eyewear Market Position in the Broader Automotive Value Chain
- 3.1.2 OEM vs. Replacement Market Dynamics
- 3.1.3 Market Maturity & Development Stage by Region
- 3.2 Asia Pacific Eyewear Market Drivers
- 3.3 Asia Pacific Eyewear Market Restraints & Challenges
- 3.4 Asia Pacific Eyewear Market Opportunities
- 3.5 Porter's Five Forces Analysis
- 3.5.1 Threat of New Entrants
- 3.5.2 Bargaining Power of Suppliers
- 3.5.3 Bargaining Power of Buyers
- 3.5.4 Threat of Substitutes
- 3.5.5 Competitive Rivalry – Intensity Assessment
- 3.6 Asia Pacific Eyewear Value Chain Analysis
- 3.6.1 Upstream – Raw Material/Input Suppliers
- 3.6.1.1 Raw Material/Input 1
- 3.6.1.2 Raw Material/Input 2
- 3.6.1.3 Raw Material/Input 3
- 3.6.2 Midstream – Production/Manufacturing/Service Delivery
- 3.6.2.1 Production/Process Overview
- 3.6.2.2 Key Facility Locations & Capacity by Manufacturer
- 3.6.3 Downstream – Distribution & End Consumer
- 3.6.3.1 Primary Channel – B2B/OEM
- 3.6.3.2 Secondary Channels – Dealer, Retail, Online, Direct
- 3.6.4 Value Chain Profitability Analysis
- 3.6.1 Upstream – Raw Material/Input Suppliers
- 3.7 PESTEL Analysis
- 3.7.1 Political Factors
- 3.7.2 Economic Factors
- 3.7.3 Social Factors
- 3.7.4 Technological Factors
- 3.7.5 Environmental Factors
- 3.7.6 Legal Factors
- 3.8 Asia Pacific Eyewear Supply Chain Analysis
- 3.8.1 Raw Material/Input Supply Risk Assessment
- 3.8.2 Manufacturing Concentration Risk (Geographic Exposure)
- 3.8.3 Trade Disruption Impact Analysis
- 3.9 Regulatory & Policy Landscape
Note: The regulatory and policy landscape section covers regulations based on their applicability to the market, Asia Pacific Eyewear category, geography, and scope of the study. Only regulatory frameworks with a material impact on operations, compliance, trade, sustainability, or market access are analyzed in detail.
Chapter 4. Key Investment Pockets & Opportunity Analysis
- 4.1 Asia Pacific Eyewear Market Attractiveness Analysis
- 4.1.1 By Region – Investment Attractiveness Matrix (Volume × CAGR)
- 4.2 Absolute Revenue Growth Opportunity
- 4.2.1 By Region – Absolute USD Growth Through the forecast period
- 4.3 Incremental Volume Opportunity
- 4.3.1 By Region – Incremental Volume Through the forecast period
- 4.3.2 Segment – Incremental Volume
- 4.4 Emerging Submarket Opportunity Deep Dive (Subject to Applicability)
- 4.5 Emerging Market Opportunity Scorecards
- 4.5.1 United States
- 4.5.2 Europe
- 4.5.3 Asia
- 4.5.4 Middle East & Africa
Note: Emerging Market Opportunity Scorecards will be included based on relevance and strategic importance. Regions listed are indicative and may vary depending on data availability and market dynamics.
Chapter 5. Asia Pacific Eyewear Import-Export Analysis & Trade Flows
- 5.1 Global Trade Overview
- 5.1.1 Global Export Value by Country (2025)
- 5.1.2 Global Export Volume by Country (2025)
- 5.1.3 Global Import Value by Country (2025)
- 5.1.4 Global Import Volume by Country (2025)
- 5.1.5 Net Trade Balance by Country (2025)
- 5.2 Export Analysis – Segment
- 5.2.1 Type 1 (HS Code)
- 5.2.2 Type 2 (HS Code)
- 5.2.3 Type 3 (HS Code)
- 5.2.4 Type 4 (HS Code)
- 5.2.5 Type 5 (HS Code)
- 5.3 Import Analysis – Segment
- 5.3.1 Type 1 (HS Code)
- 5.3.2 Type 2 (HS Code)
- 5.3.3 Type 3 (HS Code)
- 5.3.4 Type 4 (HS Code)
- 5.3.5 Type 5 (HS Code)
- 5.4 Average Unit Trade Prices
- 5.4.1 Average Export Price – Segment & Country
- 5.4.2 Average Import Price – Segment & Source Country
- 5.4.3 Price Trends (2025)
- 5.5 Key Trade Route Analysis
- 5.5.1 Trade Route 1
- 5.5.2 Trade Route 2
- 5.5.3 Trade Route 3
- 5.5.4 Trade Route 4
- 5.5.5 Trade Route 5
- 5.6 Trade Policy Impact Assessment
- 5.6.1 US Anti-Dumping & Section 301 Tariffs
- 5.6.2 EU Customs Union Impact
- 5.6.3 Major Free Trade Agreements
- 5.6.4 USMCA Rules of Origin
Note: Trade policy analysis will be included only where relevant to the Asia Pacific Eyewear market.
Chapter 6. Competitive Landscape & Company Benchmarking
- 6.1 Asia Pacific Eyewear Market Concentration & Structure
- 6.1.1 Herfindahl-Hirschman Index (HHI) – vs. 2025
- 6.1.2 Tier 1, Tier 2 & Tier 3 Market Structure
- 6.1.3 Global, Regional & Local Player Dynamics
- 6.2 Asia Pacific Eyewear Market Share Analysis – 2025
- 6.2.1 Global Revenue Share by Company
- 6.2.2 Global Volume Share by Company
- 6.2.3 Regional Revenue Share
- 6.2.4 Market Share Evolution ( vs. 2025)
- 6.2.5 OEM Segment Share by Company
- 6.2.6 Replacement Segment Share by Company
- 6.3 Production/Delivery Capacity & Facility Analysis
- 6.3.1 Global Installed Capacity
- 6.3.2 Capacity Utilization Rates
- 6.3.3 Production/Output Volume
- 6.3.4 Facility Locations & Capacity Map
- 6.3.5 Planned Capacity Additions
- 6.4 Asia Pacific Eyewear Competitive Benchmarking Matrix
- 6.4.1 Revenue, Volume, CAGR & Profitability Comparison
- 6.4.2 Channel Revenue Mix
- 6.4.3 Geographic Revenue Exposure
- 6.4.4 R&D Intensity
- 6.4.5 Sustainability Maturity
- 6.5 Strategic Developments in Asia Pacific Eyewear (Last 24 Months)
- 6.5.1 Mergers, Acquisitions & Divestments
- 6.5.2 New Asia Pacific Eyewear Launches
- 6.5.3 Facility Expansions
- 6.5.4 Strategic Alliances, Joint Ventures & Partnerships
- 6.5.5 Distribution Expansion & Market Entry
- 6.5.6 Sustainability & ESG Initiatives
- 6.6 Competitive Strategy Mapping
- 6.6.1 Leader, Challenger, Follower & Niche Classification
- 6.6.2 Pricing Strategy Comparison
- 6.6.3 Channel Strategy Matrix
Note: Strategic developments are included based on their materiality and the availability of reliable information.
Chapter 7. Global Asia Pacific Eyewear Market – By Distribution Channel
- 7.1 Segment Overview
- 7.1.1 Volume & Revenue Split by Channel (2025 & )
- 7.1.2 Channel Mix Evolution (the forecast period)
Chapter 8. Regional Market Analysis – Global Overview
- 8.1 Global Regional Overview
- 8.1.1 Regional Volume Share
- 8.1.2 Regional Revenue Share
- 8.1.3 Regional Volume by Region
- 8.1.4 Regional Revenue by Region
- 8.1.5 Regional Forecast Through the forecast period
- 8.2 Cross-Regional Segment Analysis
- 8.2.1 By Distribution Channel
- 8.2.2 By Brand/Price Tier
Chapter 9. North America Asia Pacific Eyewear Market
- 9.1 United States
- 9.2 Canada
- 9.3 Mexico
Chapter 10. Europe Asia Pacific Eyewear Market
- 10.1 Germany
- 10.2 France
- 10.3 Italy
- 10.4 United Kingdom
- 10.5 Spain
- 10.6 Poland
- 10.7 Russia
- 10.8 Netherlands
- 10.9 Belgium
- 10.10 Sweden
- 10.11 Denmark
- 10.12 Norway
- 10.13 Rest of Europe
Chapter 11. Asia Pacific Asia Pacific Eyewear Market
- 11.1 China
- 11.2 India
- 11.3 Japan
- 11.4 South Korea
- 11.5 Thailand
- 11.6 Indonesia
- 11.7 Vietnam
- 11.8 Malaysia
- 11.9 Australia
- 11.10 Rest of Asia Pacific
Chapter 12. Latin America Asia Pacific Eyewear Market
- 12.1 Brazil
- 12.2 Argentina
- 12.3 Colombia
- 12.4 Chile
- 12.5 Rest of Latin America
Chapter 13. Middle East Asia Pacific Eyewear Market
- 13.1 Saudi Arabia
- 13.2 United Arab Emirates
- 13.3 Turkey
- 13.4 Israel
- 13.5 Iran
- 13.6 Rest of the Middle East
Chapter 14. Africa Asia Pacific Eyewear Market
- 14.1 South Africa
- 14.2 Egypt
- 14.3 Nigeria
- 14.4 Morocco
- 14.5 Rest of Africa
Chapter 15. Asia Pacific Eyewear Company Profiles
- 15.1 [Company 01]
- 15.1.1 Company Overview
- 15.1.2 Key Management Personnel
- 15.1.3 Products & Services Portfolio
- 15.1.4 Financial Performance
- 15.1.5 Key Market Focus & Geographic Presence
- 15.1.6 Recent Developments & Strategic Initiatives
Note: The company profile list is preliminary and may change based on research findings, market developments, data availability, and client requirements.
Chapter 16. Appendices
- Appendix A – List of Abbreviations & Acronyms
- Appendix B – Industry Classification Code Reference – Full Series
- Appendix C – Production & Capacity Data Tables
- Appendix D – End-Use & Demand Base Tables
- Appendix E – Consumption & Replacement Rate Assumptions
- Appendix F – ASP Reference Tables
- Appendix G – Manufacturing & Facility Database
- Appendix H – Import-Export Data Tables
- Appendix I – Regulatory Summary Tables
- Appendix J – Primary Research Participant List (Anonymized)
- Appendix K – Primary Research Questionnaire Framework
- Appendix L – Data Sources & Bibliography
- Appendix M – Market Size Divergence & Source Comparison
Chapter 17. Research Methodology
- 17.1 Research Framework & Philosophy
- 17.2 Secondary Research – Sources, Hierarchy & Data Extraction
- 17.3 Data Modeling – Bottom-Up & Top-Down Market Sizing
- 17.4 Primary Research – Stakeholder Framework, LOI & Sample Sizes
- 17.5 Forecast Methodology – Regression, Scenario & Sensitivity Analysis
- 17.6 Quality Control – Four-Layer Validation Framework
- 17.7 Limitations & Standard Assumptions
- 17.8 Disclaimer
