
Market Overview
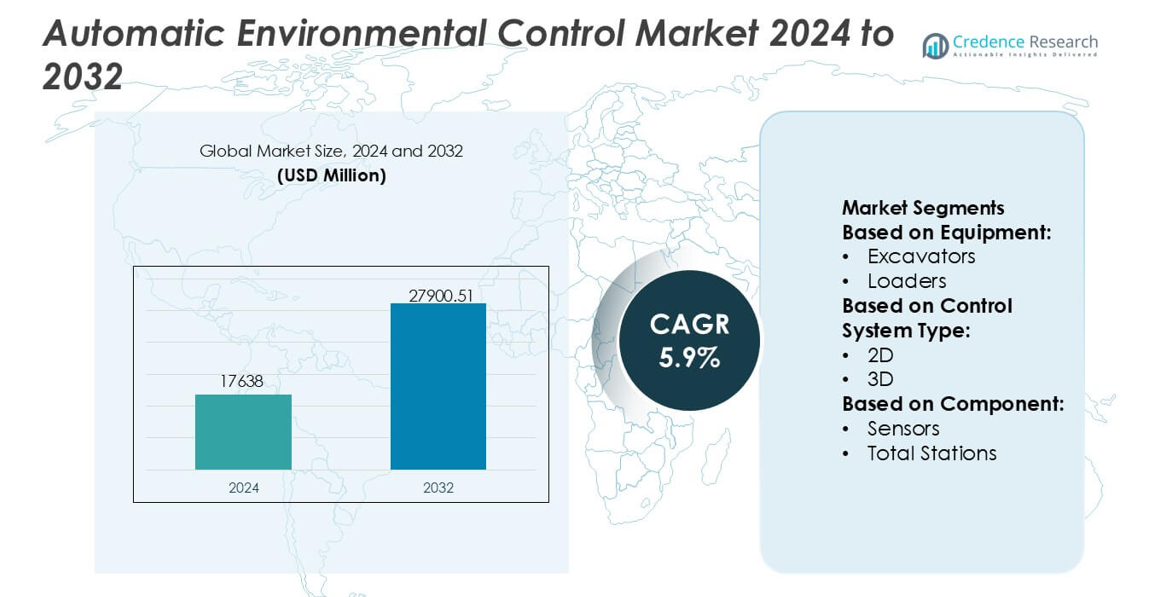
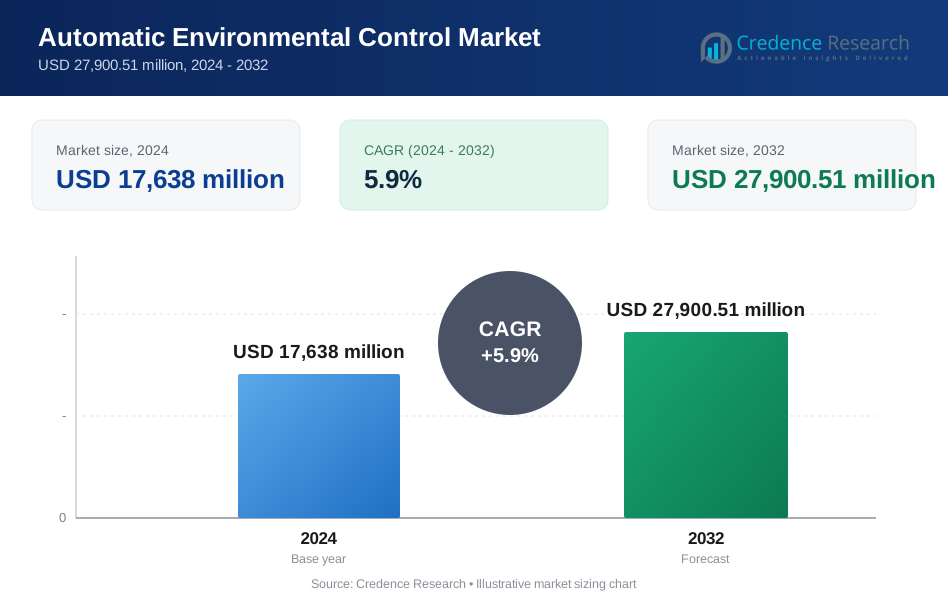
Automatic Environmental Control Market size was valued USD 17638 million in 2024 and is anticipated to reach USD 27900.51 million by 2032, at a CAGR of 5.9% during the forecast period.
| REPORT ATTRIBUTE | DETAILS |
|---|---|
| Historical Period | 2020-2023 |
| Base Year | 2024 |
| Forecast Period | 2025-2032 |
| Automatic Environmental Control Market Size 2024 | USD 17638 million |
| Automatic Environmental Control Market, CAGR | 5.9% |
| Automatic Environmental Control Market Size 2032 | USD 27900.51 million |
The Automatic Environmental Control Market is shaped by a concentrated group of global automation, sensing, and precision-engineering companies that strengthen their competitive positions through advanced GNSS platforms, multi-sensor integration, and AI-enabled control technologies. These players focus on enhancing grading accuracy, reducing environmental impact, and improving equipment coordination through real-time data ecosystems and connected-fleet solutions. Continuous investment in software-driven automation, ruggedized hardware, and compliance-support tools reinforces their role in modern construction and industrial operations. North America emerges as the leading region, holding an exact 34% market share, supported by high technology adoption, strong regulatory frameworks, and extensive infrastructure modernization programs.
Market Insights
- The Automatic Environmental Control Market reached USD 17,638 million in 2024 and is projected to hit USD 27,900.51 million by 2032 at a 5.9% CAGR, reflecting steady adoption of precision automation technologies across construction and industrial sectors.
- Market growth is driven by rising demand for GNSS-enabled systems, multi-sensor control platforms, and AI-supported grading solutions that enhance accuracy, reduce rework, and support environmental compliance.
- Key trends include rapid expansion of 3D machine-control systems, increased fleet digitization, and wider integration of real-time monitoring tools that optimize site performance.
- Competitive intensity strengthens as automation and sensing technology providers invest in software-driven control, ruggedized components, and connected-fleet ecosystems to expand market presence.
- North America leads with a 34% share, while excavators dominate equipment segmentation with a 31% share, supported by strong digital adoption, infrastructure upgrades, and rising demand for efficient, environmentally responsible project execution.
Market Segmentation Analysis:
By Equipment
Excavators represent the dominant segment in the Automatic Environmental Control Market, holding an exact 31% share due to their extensive integration of automated grade-control, hydraulic sensing, and machine-guidance technologies. Their widespread deployment in large-scale earthmoving, road development, and mining operations drives rapid adoption of precision-control systems that improve fuel efficiency and reduce rework. Loaders and dozers follow as high-utilization categories, benefiting from enhanced operator assistance tools and real-time terrain calibration. Graders, scrapers, and other specialty machines gain traction as contractors prioritize productivity optimization and consistent environmental compliance across construction fleets.
- For instance, Curtiss-Wright supports this shift through its Exlar® GTX electromechanical actuators, which deliver continuous thrust outputs up to 44,500 N and positional repeatability of ±0.01 mm, enabling highly accurate hydraulic-replacement functions in automated excavator control assemblies.
By Control System Type
3D control systems lead this segment with a definitive 58% market share, driven by their superior accuracy in complex grading, depth control, and multi-axis automation. These systems utilize advanced spatial mapping and real-time terrain modeling to support high-precision tasks required in infrastructure megaprojects and regulated environmental zones. Their ability to minimize manual surveying, improve cut-and-fill accuracy, and reduce operational downtime strengthens adoption across heavy construction and mining. In contrast, 2D systems remain preferred in cost-sensitive applications, offering reliable elevation control for routine site-leveling and foundation preparation.
- For instance, Liebherr enhances this segment through its LiDAR- and GNSS-enabled machine control platform, which delivers positioning accuracy down to 10 mm and processes terrain updates at 20 Hz to maintain stable 3D blade-control performance during continuous excavation.
By Component
Global Navigation Satellite System (GNSS) components dominate the market with an exact 43% share, reflecting their central role in enabling high-precision navigation, machine positioning, and environmental-grade automation across equipment categories. GNSS-driven systems support centimeter-level accuracy and seamless site coordination, making them critical for contractors transitioning toward fully automated fleets. Sensors, total stations, and laser scanners experience steady expansion as projects demand richer data acquisition, enhanced spatial awareness, and improved environmental monitoring. Additional components, including communication modules and controllers, complement system integration efforts by ensuring interoperability and real-time machine guidance.
Key Growth Drivers
Rising Adoption of Precision Construction and Earthmoving
Demand for automated grade-control and environmental monitoring systems rises as contractors prioritize precision, fuel efficiency, and compliance with evolving construction standards. Automatic environmental control technologies reduce rework, improve excavation accuracy, and enhance operator safety, making them essential for infrastructure modernization. Their integration across excavators, graders, and dozers accelerates digital transformation on job sites. Government-backed smart infrastructure initiatives further strengthen adoption by mandating tighter environmental controls, emissions management, and real-time site monitoring to ensure consistent project outcomes and regulatory adherence.
- For instance, Siemens’ SIMATIC S7-1200 G2 series programmable logic controllers, introduced at Hannover Messe 2024, provide up to 750 kB of data memory and support 14 digital inputs and 10 digital outputs per unit, enabling precise real-time control and data acquisition for environmental sensor networks and machine-control loops.
Expanding Integration of GNSS, IoT, and Sensor-Based Ecosystems
The market grows as GNSS modules, advanced sensors, laser scanners, and IoT-enabled systems become central to machine automation and environmental control. These technologies enable centimeter-level accuracy, real-time terrain data, and predictive insights that enhance machine performance and minimize environmental impact. Fleet-wide digital connectivity supports remote diagnostics, automated calibration, and synchronized worksite execution. Construction companies increasingly adopt integrated platforms to improve operational visibility, reduce idle time, and optimize material usage, driving widespread deployment of intelligent control systems across heavy machinery.
- For instance, Meggitt PLC strengthens this shift through its Vibro-Meter® condition-monitoring sensors, capable of measuring vibration levels up to 500 g and operating at bandwidths extending to 30 kHz, allowing construction machinery to capture granular machine-health and environmental-load data under harsh duty cycles.
Increasing Regulatory Pressure for Environmental Compliance
Stringent regulations related to land disturbance, emissions control, dust suppression, and soil management significantly drive demand for automated environmental control technologies. Governments emphasize sustainable construction practices, requiring equipment that can monitor environmental impact with high precision and document compliance through digital records. Automated systems help contractors avoid penalties, maintain certification standards, and achieve measurable reductions in ecological disruption. As environmental auditing grows more sophisticated, contractors adopt advanced grade-control and monitoring tools to meet compliance expectations while improving operational efficiency.
Key Trends & Opportunities
Growth of 3D Machine Control and Autonomous Equipment
A major trend is the accelerated shift from 2D to 3D environmental control systems, driven by their superior accuracy, multi-axis mapping, and automated decision-making capability. The emergence of autonomous and semi-autonomous construction machinery amplifies opportunities for integrated environmental monitoring tools that support self-correcting terrain adjustments. Contractors increasingly invest in 3D systems to reduce dependence on manual surveying, improve project timelines, and maintain consistent environmental compliance. This trend creates opportunities for vendors offering AI-driven modeling, digital twins, and unified construction-management platforms.
- For instance, Honeywell advances precise motion tracking capabilities for automated grading and earthmoving operations through its HGuide i300 inertial measurement unit (IMU).
Expansion of Sustainable and Low-Impact Construction Practices
Growing emphasis on sustainability encourages adoption of control systems that minimize soil displacement, reduce emissions, and optimize resource utilization. Automated systems enable precise cut-and-fill operations that limit material wastage and protect sensitive land zones. Opportunities expand for solutions incorporating energy-efficient components, green-site mapping tools, and environmentally responsive calibration algorithms. As ESG commitments rise among construction firms, vendors offering quantifiable environmental benefits such as reduced operational footprint and improved monitoring accuracy gain competitive advantage in emerging and developed markets.
- For instance, Danaher’s MET ONE® Facility Monitoring Systems offer particle counters with ISO 21501-4-compliant calibration that detect airborne particles as small as 0.3 µm at flow rates up to 100 L/min, enabling granular environmental monitoring and clean-air quality validation in controlled environments.
Increased Demand for Fleet Digitization and Real-Time Monitoring
Contractors are rapidly transitioning toward connected fleets that provide real-time environmental insights, equipment performance data, and automated compliance reporting. This shift expands opportunities for cloud-integrated platforms that unify GNSS positioning, sensor analytics, and machine-control modules into a single operational ecosystem. Remote monitoring reduces downtime, improves machine utilization, and supports predictive maintenance strategies. As job sites grow more complex, digital fleet ecosystems enable synchronized workflows, cross-machine communication, and enhanced environmental oversight, positioning data-driven automation as a central market opportunity.
Key Challenges
High Initial Investment and Integration Complexity
The market faces challenges due to the substantial成本 associated with implementing GNSS modules, advanced sensors, 3D control systems, and integrated software platforms. Smaller contractors struggle to justify the upfront expenditure, particularly in regions with limited digitization incentives. Integration with legacy machinery, calibration complexities, and the need for trained technicians further increase deployment barriers. These financial and technical constraints slow adoption and require manufacturers to offer flexible financing models, modular architectures, and simplified onboarding to broaden market penetration.
Skilled Workforce Shortage and Limited Training Infrastructure
Adoption of advanced environmental control solutions is hindered by a shortage of operators and technicians trained in digital machine-control systems, GNSS-based calibration, and automated workflow management. Many regional construction markets lack structured training programs, causing reliance on manual methods and slowing digital transition. Inadequate technical readiness leads to underutilization of installed systems and inconsistent project outcomes. Addressing this challenge requires industry partnerships, simulation-based learning platforms, and manufacturer-supported training programs to build a digitally proficient workforce capable of managing automated environments.
Regional Analysis
North America
North America leads the Automatic Environmental Control Market with an exact 34% share, driven by strong adoption of GNSS-based machine control, advanced 3D guidance systems, and stringent environmental compliance regulations. Contractors prioritize automation to enhance productivity and reduce ecological impact across large-scale infrastructure and mining operations. The United States drives most of the regional demand due to rapid digitalization of construction fleets and government-funded modernization programs. Widespread availability of skilled operators, early integration of smart equipment, and strong OEM–technology provider partnerships reinforce North America’s position as the leading regional contributor.
Europe
Europe holds a significant 27% market share, supported by strict sustainability mandates, high investment in precision construction technologies, and strong uptake of automated grading and environmental monitoring systems. Countries including Germany, the UK, and the Nordic region lead adoption as contractors implement eco-efficient earthmoving practices and digital compliance reporting. The region’s robust industrial base and emphasis on low-impact construction accelerate the deployment of GNSS-enabled and 3D control platforms. Continuous upgrades to public infrastructure and wide acceptance of environmentally responsible machinery further strengthen Europe’s role as a mature and technology-forward market.
Asia Pacific
Asia Pacific accounts for an exact 30% share, driven by massive infrastructure expansion, rapid urban development, and increasing investments in smart construction technologies across China, Japan, India, and Southeast Asia. Large-scale transportation, mining, and industrial projects fuel strong demand for automated environmental control systems that enhance operational precision and reduce rework. Growing awareness of sustainable construction practices and rising GNSS adoption accelerate digital transformation across regional contractors. OEM localization, government-backed modernization programs, and expanding deployment of 3D machine-control systems position Asia Pacific as the fastest-growing contributor to market advancement.
Latin America
Latin America holds a 5% market share, with adoption gradually increasing as construction and mining sectors integrate automated equipment to improve project efficiency and meet emerging environmental standards. Brazil, Mexico, and Chile represent key demand centers due to large earthmoving activities and rising investments in digital site-management tools. Limited access to advanced technologies and cost-sensitive procurement slow widespread adoption, but government infrastructure programs and growing interest in GNSS-based solutions support steady progress. The region’s shift toward modernized equipment fleets creates long-term opportunities for automated environmental control systems.
Middle East & Africa
The Middle East & Africa region maintains a 4% market share, supported by infrastructure development, mining expansion, and construction activities across the Gulf states and South Africa. Adoption of automated environmental control systems increases as contractors pursue productivity improvements and enhanced compliance in arid and sensitive terrains. Smart city initiatives in the UAE and Saudi Arabia stimulate demand for 3D guidance technologies and advanced monitoring systems. However, varying technical readiness and budget constraints limit widespread penetration. Growing interest in precision earthmoving and digital workflow integration positions the region for gradual, steady adoption.
Market Segmentations:
By Equipment:
- Excavators
- Loaders
By Control System Type:
- 2D
- 3D
By Component:
- Sensors
- Total Stations
By Geography
- North America
- U.S.
- Canada
- Mexico
- Europe
- Germany
- France
- U.K.
- Italy
- Spain
- Rest of Europe
- Asia Pacific
- China
- Japan
- India
- South Korea
- South-east Asia
- Rest of Asia Pacific
- Latin America
- Brazil
- Argentina
- Rest of Latin America
- Middle East & Africa
- GCC Countries
- South Africa
- Rest of the Middle East and Africa
Competitive Landscape
The competitive landscape of the Automatic Environmental Control Market players such as Merck, Curtiss-Wright Corporation, Liebherr International AG, Mecaer Aviation Group, Siemens AG, Meggitt PLC, Honeywell International, 3M, Danaher, Thermo Fisher Scientific Inc. the Automatic Environmental Control Market is defined by a mix of technology innovators, equipment manufacturers, and environmental monitoring specialists that focus on delivering high-precision automation solutions for construction and industrial applications. Companies emphasize advanced sensing platforms, GNSS-enabled positioning, and AI-supported calibration tools to enhance grading accuracy, reduce ecological impact, and ensure consistent regulatory compliance. Vendors strengthen competitiveness by integrating real-time analytics, multi-equipment connectivity, and cloud-based monitoring systems into their offerings. Increasing investment in R&D, strategic partnerships with heavy machinery OEMs, and expansion of digital workflow ecosystems further support market growth as contractors adopt automated solutions to improve productivity and environmental performance across diverse project environments.
Key Player Analysis
- Merck
- Curtiss-Wright Corporation
- Liebherr International AG
- Mecaer Aviation Group
- Siemens AG
- Meggitt PLC
- Honeywell International
- 3M
- Danaher
- Thermo Fisher Scientific Inc.
Recent Developments
- In February 2025, Rockwell Automation's orders grew by approximately 10% year-over-year, and total Annual Recurring Revenue (ARR) climbed 11%. This positive demand signal contrasted with an 8.4% decline in reported sales to $1.881 billion for the quarter.
- In October 2024, Siemens has launched SIMOCODE M-CP, an efficient and future-proof motor management product series, especially tailored for motor control centers (MCC). Siemens released the SIMOCODE M-CP motor management system with built-in monitoring and Single Pair Ethernet connectivity, targeting chemicals and mining switchboards.
- In March 2024, JCB and Leica Geosystems are joining forces to offer factory-fitted 2D and 3D-ready semi-automated excavator control solutions. These solutions would enhance safety, accuracy, and productivity by automating functions including boom and tilt rotator control and would reduce construction operations human errors.
Report Coverage
The research report offers an in-depth analysis based on Equipment, Control System Type, Component and Geography. It details leading market players, providing an overview of their business, product offerings, investments, revenue streams, and key applications. Additionally, the report includes insights into the competitive environment, SWOT analysis, current market trends, as well as the primary drivers and constraints. Furthermore, it discusses various factors that have driven market expansion in recent years. The report also explores market dynamics, regulatory scenarios, and technological advancements that are shaping the industry. It assesses the impact of external factors and global economic changes on market growth. Lastly, it provides strategic recommendations for new entrants and established companies to navigate the complexities of the market.
Future Outlook
- The market will see wider adoption of 3D machine-control systems to enhance grading precision and reduce rework.
- Automated environmental monitoring tools will integrate more advanced sensors for real-time compliance tracking.
- Connected fleets will expand as contractors prioritize cloud-based coordination and remote equipment management.
- GNSS-enabled systems will become more accurate and reliable, supporting highly complex construction workflows.
- AI-driven terrain modeling will improve predictive decision-making for earthmoving and site preparation.
- Sustainability requirements will accelerate adoption of low-impact automation technologies across job sites.
- Autonomous and semi-autonomous machinery will gain traction in large-scale infrastructure projects.
- Software platforms will evolve toward unified interfaces that streamline environmental data, machine control, and reporting.
- Manufacturers will focus on modular upgrade kits to support digital transformation of existing equipment fleets.
- Training and certification programs will expand to build operator proficiency in advanced automated control systems.
Request a Free Sample
Fill in your details and we'll send you a free sample report.
- Sample data tables & charts
- Research methodology
Need a Custom Version of This Report?
Tailor the scope, geography, or segments to your exact requirements.
- Custom geography or segment scope
- Direct access to our analyst team
Frequently Asked Questions
What is the projected growth of the automatic environmental control market?
At what Compound Annual Growth Rate is the Automatic Environmental Control Market projected to grow between 2024 and 2032?
What are the key drivers propelling the automatic environmental control market forward?
What challenges does the market face?
Who are the key players in the automatic environmental control market?
Which regions dominate the automatic environmental control market, and what is the future outlook?
Table of Content
Chapter 1. Report Introduction
- 1.1 Report Description & Purpose
- 1.1.1 Report Title & Market Definition
- 1.1.2 Unique Selling Propositions (USP) & Key Differentiators
- 1.1.3 Value Proposition for Stakeholders
- 1.2 Research Objectives
- 1.2.1 Market Sizing Objectives (Volume & Revenue)
- 1.2.2 Segmentation Objectives
- 1.2.3 Competitive Intelligence Objectives
- 1.2.4 Forecast & Scenario Objectives
- 1.3 Report Scope
- 1.3.1 Automatic Environmental Control Scope – Types & Subtypes Covered
- 1.3.2 Geographic Scope – Regions & Countries Covered
- 1.3.3 Historical Period, Base Year & Forecast Period (2024; forecast to 2032)
- 1.3.4 Inclusions & Exclusions
- 1.4 HS Code & Classification Framework
- 1.5 Currency, Units & Pricing Basis
- 1.6 Target Stakeholders
- 1.7 Limitations & Assumptions
Chapter 2. Executive Summary
- 2.1 Global Automatic Environmental Control Market Snapshot
- 2.1.1 Market Size – Historical (2024) & Forecast (2024-2032) (2024: USD 17,638 million → 2032: USD 27,900.51 million)
- 2.1.2 Volume & Revenue – Global Totals
- 2.1.3 Key Market Highlights – Top Five Facts
- 2.2 Automatic Environmental Control Market Segmentation Snapshot
- 2.2.1 Market Split by Region – 2024 vs. 2032
- 2.3 Competitive Snapshot
- 2.3.1 Top 10 Players by Revenue Share – 2024
- 2.3.2 Top 10 Players by Volume Share – 2024
- 2.3.3 Recent Strategic Developments (18-Month Summary)
- 2.4 Key Investment Highlights & Strategic Conclusions
Chapter 3. Automatic Environmental Control Market Dynamics & Industry Analysis
- 3.1 Market Overview & Context
- 3.1.1 Automatic Environmental Control Market Position in the Broader Automotive Value Chain
- 3.1.2 OEM vs. Replacement Market Dynamics
- 3.1.3 Market Maturity & Development Stage by Region
- 3.2 Automatic Environmental Control Market Drivers
- 3.3 Automatic Environmental Control Market Restraints & Challenges
- 3.4 Automatic Environmental Control Market Opportunities
- 3.5 Porter's Five Forces Analysis
- 3.5.1 Threat of New Entrants
- 3.5.2 Bargaining Power of Suppliers
- 3.5.3 Bargaining Power of Buyers
- 3.5.4 Threat of Substitutes
- 3.5.5 Competitive Rivalry – Intensity Assessment
- 3.6 Automatic Environmental Control Value Chain Analysis
- 3.6.1 Upstream – Raw Material/Input Suppliers
- 3.6.1.1 Raw Material/Input 1
- 3.6.1.2 Raw Material/Input 2
- 3.6.1.3 Raw Material/Input 3
- 3.6.2 Midstream – Production/Manufacturing/Service Delivery
- 3.6.2.1 Production/Process Overview
- 3.6.2.2 Key Facility Locations & Capacity by Manufacturer
- 3.6.3 Downstream – Distribution & End Consumer
- 3.6.3.1 Primary Channel – B2B/OEM
- 3.6.3.2 Secondary Channels – Dealer, Retail, Online, Direct
- 3.6.4 Value Chain Profitability Analysis
- 3.6.1 Upstream – Raw Material/Input Suppliers
- 3.7 PESTEL Analysis
- 3.7.1 Political Factors
- 3.7.2 Economic Factors
- 3.7.3 Social Factors
- 3.7.4 Technological Factors
- 3.7.5 Environmental Factors
- 3.7.6 Legal Factors
- 3.8 Automatic Environmental Control Supply Chain Analysis
- 3.8.1 Raw Material/Input Supply Risk Assessment
- 3.8.2 Manufacturing Concentration Risk (Geographic Exposure)
- 3.8.3 Trade Disruption Impact Analysis
- 3.9 Regulatory & Policy Landscape
Note: The regulatory and policy landscape section covers regulations based on their applicability to the market, Automatic Environmental Control category, geography, and scope of the study. Only regulatory frameworks with a material impact on operations, compliance, trade, sustainability, or market access are analyzed in detail.
Chapter 4. Key Investment Pockets & Opportunity Analysis
- 4.1 Automatic Environmental Control Market Attractiveness Analysis
- 4.1.1 By Region – Investment Attractiveness Matrix (Volume × CAGR)
- 4.2 Absolute Revenue Growth Opportunity
- 4.2.1 By Region – Absolute USD Growth Through 2032
- 4.3 Incremental Volume Opportunity
- 4.3.1 By Region – Incremental Volume Through 2032
- 4.3.2 Segment – Incremental Volume
- 4.4 Emerging Submarket Opportunity Deep Dive (Subject to Applicability)
- 4.5 Emerging Market Opportunity Scorecards
- 4.5.1 United States
- 4.5.2 Europe
- 4.5.3 Asia
- 4.5.4 Middle East & Africa
Note: Emerging Market Opportunity Scorecards will be included based on relevance and strategic importance. Regions listed are indicative and may vary depending on data availability and market dynamics.
Chapter 5. Automatic Environmental Control Import-Export Analysis & Trade Flows
- 5.1 Global Trade Overview
- 5.1.1 Global Export Value by Country (2024)
- 5.1.2 Global Export Volume by Country (2024)
- 5.1.3 Global Import Value by Country (2024)
- 5.1.4 Global Import Volume by Country (2024)
- 5.1.5 Net Trade Balance by Country (2024)
- 5.2 Export Analysis – Segment
- 5.2.1 Type 1 (HS Code)
- 5.2.2 Type 2 (HS Code)
- 5.2.3 Type 3 (HS Code)
- 5.2.4 Type 4 (HS Code)
- 5.2.5 Type 5 (HS Code)
- 5.3 Import Analysis – Segment
- 5.3.1 Type 1 (HS Code)
- 5.3.2 Type 2 (HS Code)
- 5.3.3 Type 3 (HS Code)
- 5.3.4 Type 4 (HS Code)
- 5.3.5 Type 5 (HS Code)
- 5.4 Average Unit Trade Prices
- 5.4.1 Average Export Price – Segment & Country
- 5.4.2 Average Import Price – Segment & Source Country
- 5.4.3 Price Trends (2024)
- 5.5 Key Trade Route Analysis
- 5.5.1 Trade Route 1
- 5.5.2 Trade Route 2
- 5.5.3 Trade Route 3
- 5.5.4 Trade Route 4
- 5.5.5 Trade Route 5
- 5.6 Trade Policy Impact Assessment
- 5.6.1 US Anti-Dumping & Section 301 Tariffs
- 5.6.2 EU Customs Union Impact
- 5.6.3 Major Free Trade Agreements
- 5.6.4 USMCA Rules of Origin
Note: Trade policy analysis will be included only where relevant to the Automatic Environmental Control market.
Chapter 6. Competitive Landscape & Company Benchmarking
- 6.1 Automatic Environmental Control Market Concentration & Structure
- 6.1.1 Herfindahl-Hirschman Index (HHI) – vs. 2024
- 6.1.2 Tier 1, Tier 2 & Tier 3 Market Structure
- 6.1.3 Global, Regional & Local Player Dynamics
- 6.2 Automatic Environmental Control Market Share Analysis – 2024
- 6.2.1 Global Revenue Share by Company
- 6.2.2 Global Volume Share by Company
- 6.2.3 Regional Revenue Share
- 6.2.4 Market Share Evolution ( vs. 2024)
- 6.2.5 OEM Segment Share by Company
- 6.2.6 Replacement Segment Share by Company
- 6.3 Production/Delivery Capacity & Facility Analysis
- 6.3.1 Global Installed Capacity
- 6.3.2 Capacity Utilization Rates
- 6.3.3 Production/Output Volume
- 6.3.4 Facility Locations & Capacity Map
- 6.3.5 Planned Capacity Additions
- 6.4 Automatic Environmental Control Competitive Benchmarking Matrix
- 6.4.1 Revenue, Volume, CAGR & Profitability Comparison
- 6.4.2 Channel Revenue Mix
- 6.4.3 Geographic Revenue Exposure
- 6.4.4 R&D Intensity
- 6.4.5 Sustainability Maturity
- 6.5 Strategic Developments in Automatic Environmental Control (Last 24 Months)
- 6.5.1 Mergers, Acquisitions & Divestments
- 6.5.2 New Automatic Environmental Control Launches
- 6.5.3 Facility Expansions
- 6.5.4 Strategic Alliances, Joint Ventures & Partnerships
- 6.5.5 Distribution Expansion & Market Entry
- 6.5.6 Sustainability & ESG Initiatives
- 6.6 Competitive Strategy Mapping
- 6.6.1 Leader, Challenger, Follower & Niche Classification
- 6.6.2 Pricing Strategy Comparison
- 6.6.3 Channel Strategy Matrix
Note: Strategic developments are included based on their materiality and the availability of reliable information.
Chapter 7. Global Automatic Environmental Control Market – By Distribution Channel
- 7.1 Segment Overview
- 7.1.1 Volume & Revenue Split by Channel (2024 & 2032)
- 7.1.2 Channel Mix Evolution (2024-2032)
Chapter 8. Regional Market Analysis – Global Overview
- 8.1 Global Regional Overview
- 8.1.1 Regional Volume Share
- 8.1.2 Regional Revenue Share
- 8.1.3 Regional Volume by Region
- 8.1.4 Regional Revenue by Region
- 8.1.5 Regional Forecast Through 2032
- 8.2 Cross-Regional Segment Analysis
- 8.2.1 By Distribution Channel
- 8.2.2 By Brand/Price Tier
Chapter 9. North America Automatic Environmental Control Market
- 9.1 United States
- 9.2 Canada
- 9.3 Mexico
Chapter 10. Europe Automatic Environmental Control Market
- 10.1 Germany
- 10.2 France
- 10.3 Italy
- 10.4 United Kingdom
- 10.5 Spain
- 10.6 Poland
- 10.7 Russia
- 10.8 Netherlands
- 10.9 Belgium
- 10.10 Sweden
- 10.11 Denmark
- 10.12 Norway
- 10.13 Rest of Europe
Chapter 11. Asia Pacific Automatic Environmental Control Market
- 11.1 China
- 11.2 India
- 11.3 Japan
- 11.4 South Korea
- 11.5 Thailand
- 11.6 Indonesia
- 11.7 Vietnam
- 11.8 Malaysia
- 11.9 Australia
- 11.10 Rest of Asia Pacific
Chapter 12. Latin America Automatic Environmental Control Market
- 12.1 Brazil
- 12.2 Argentina
- 12.3 Colombia
- 12.4 Chile
- 12.5 Rest of Latin America
Chapter 13. Middle East Automatic Environmental Control Market
- 13.1 Saudi Arabia
- 13.2 United Arab Emirates
- 13.3 Turkey
- 13.4 Israel
- 13.5 Iran
- 13.6 Rest of the Middle East
Chapter 14. Africa Automatic Environmental Control Market
- 14.1 South Africa
- 14.2 Egypt
- 14.3 Nigeria
- 14.4 Morocco
- 14.5 Rest of Africa
Chapter 15. Automatic Environmental Control Company Profiles
- 15.1 [Company 01]
- 15.1.1 Company Overview
- 15.1.2 Key Management Personnel
- 15.1.3 Products & Services Portfolio
- 15.1.4 Financial Performance
- 15.1.5 Key Market Focus & Geographic Presence
- 15.1.6 Recent Developments & Strategic Initiatives
Note: The company profile list is preliminary and may change based on research findings, market developments, data availability, and client requirements.
Chapter 16. Appendices
- Appendix A – List of Abbreviations & Acronyms
- Appendix B – Industry Classification Code Reference – Full Series
- Appendix C – Production & Capacity Data Tables
- Appendix D – End-Use & Demand Base Tables
- Appendix E – Consumption & Replacement Rate Assumptions
- Appendix F – ASP Reference Tables
- Appendix G – Manufacturing & Facility Database
- Appendix H – Import-Export Data Tables
- Appendix I – Regulatory Summary Tables
- Appendix J – Primary Research Participant List (Anonymized)
- Appendix K – Primary Research Questionnaire Framework
- Appendix L – Data Sources & Bibliography
- Appendix M – Market Size Divergence & Source Comparison
Chapter 17. Research Methodology
- 17.1 Research Framework & Philosophy
- 17.2 Secondary Research – Sources, Hierarchy & Data Extraction
- 17.3 Data Modeling – Bottom-Up & Top-Down Market Sizing
- 17.4 Primary Research – Stakeholder Framework, LOI & Sample Sizes
- 17.5 Forecast Methodology – Regression, Scenario & Sensitivity Analysis
- 17.6 Quality Control – Four-Layer Validation Framework
- 17.7 Limitations & Standard Assumptions
- 17.8 Disclaimer
