
Cloud and AI buyers now set the shape of long-haul capacity
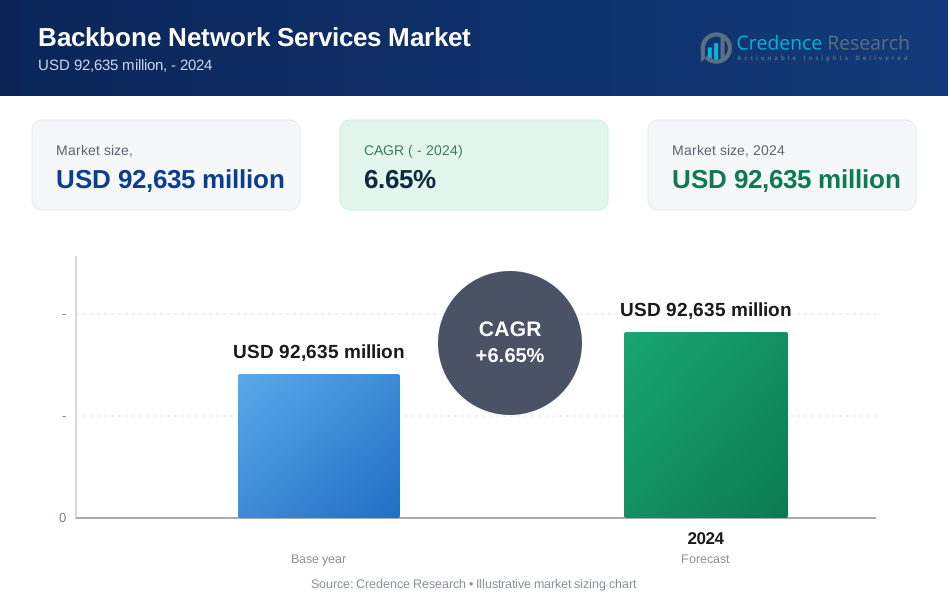
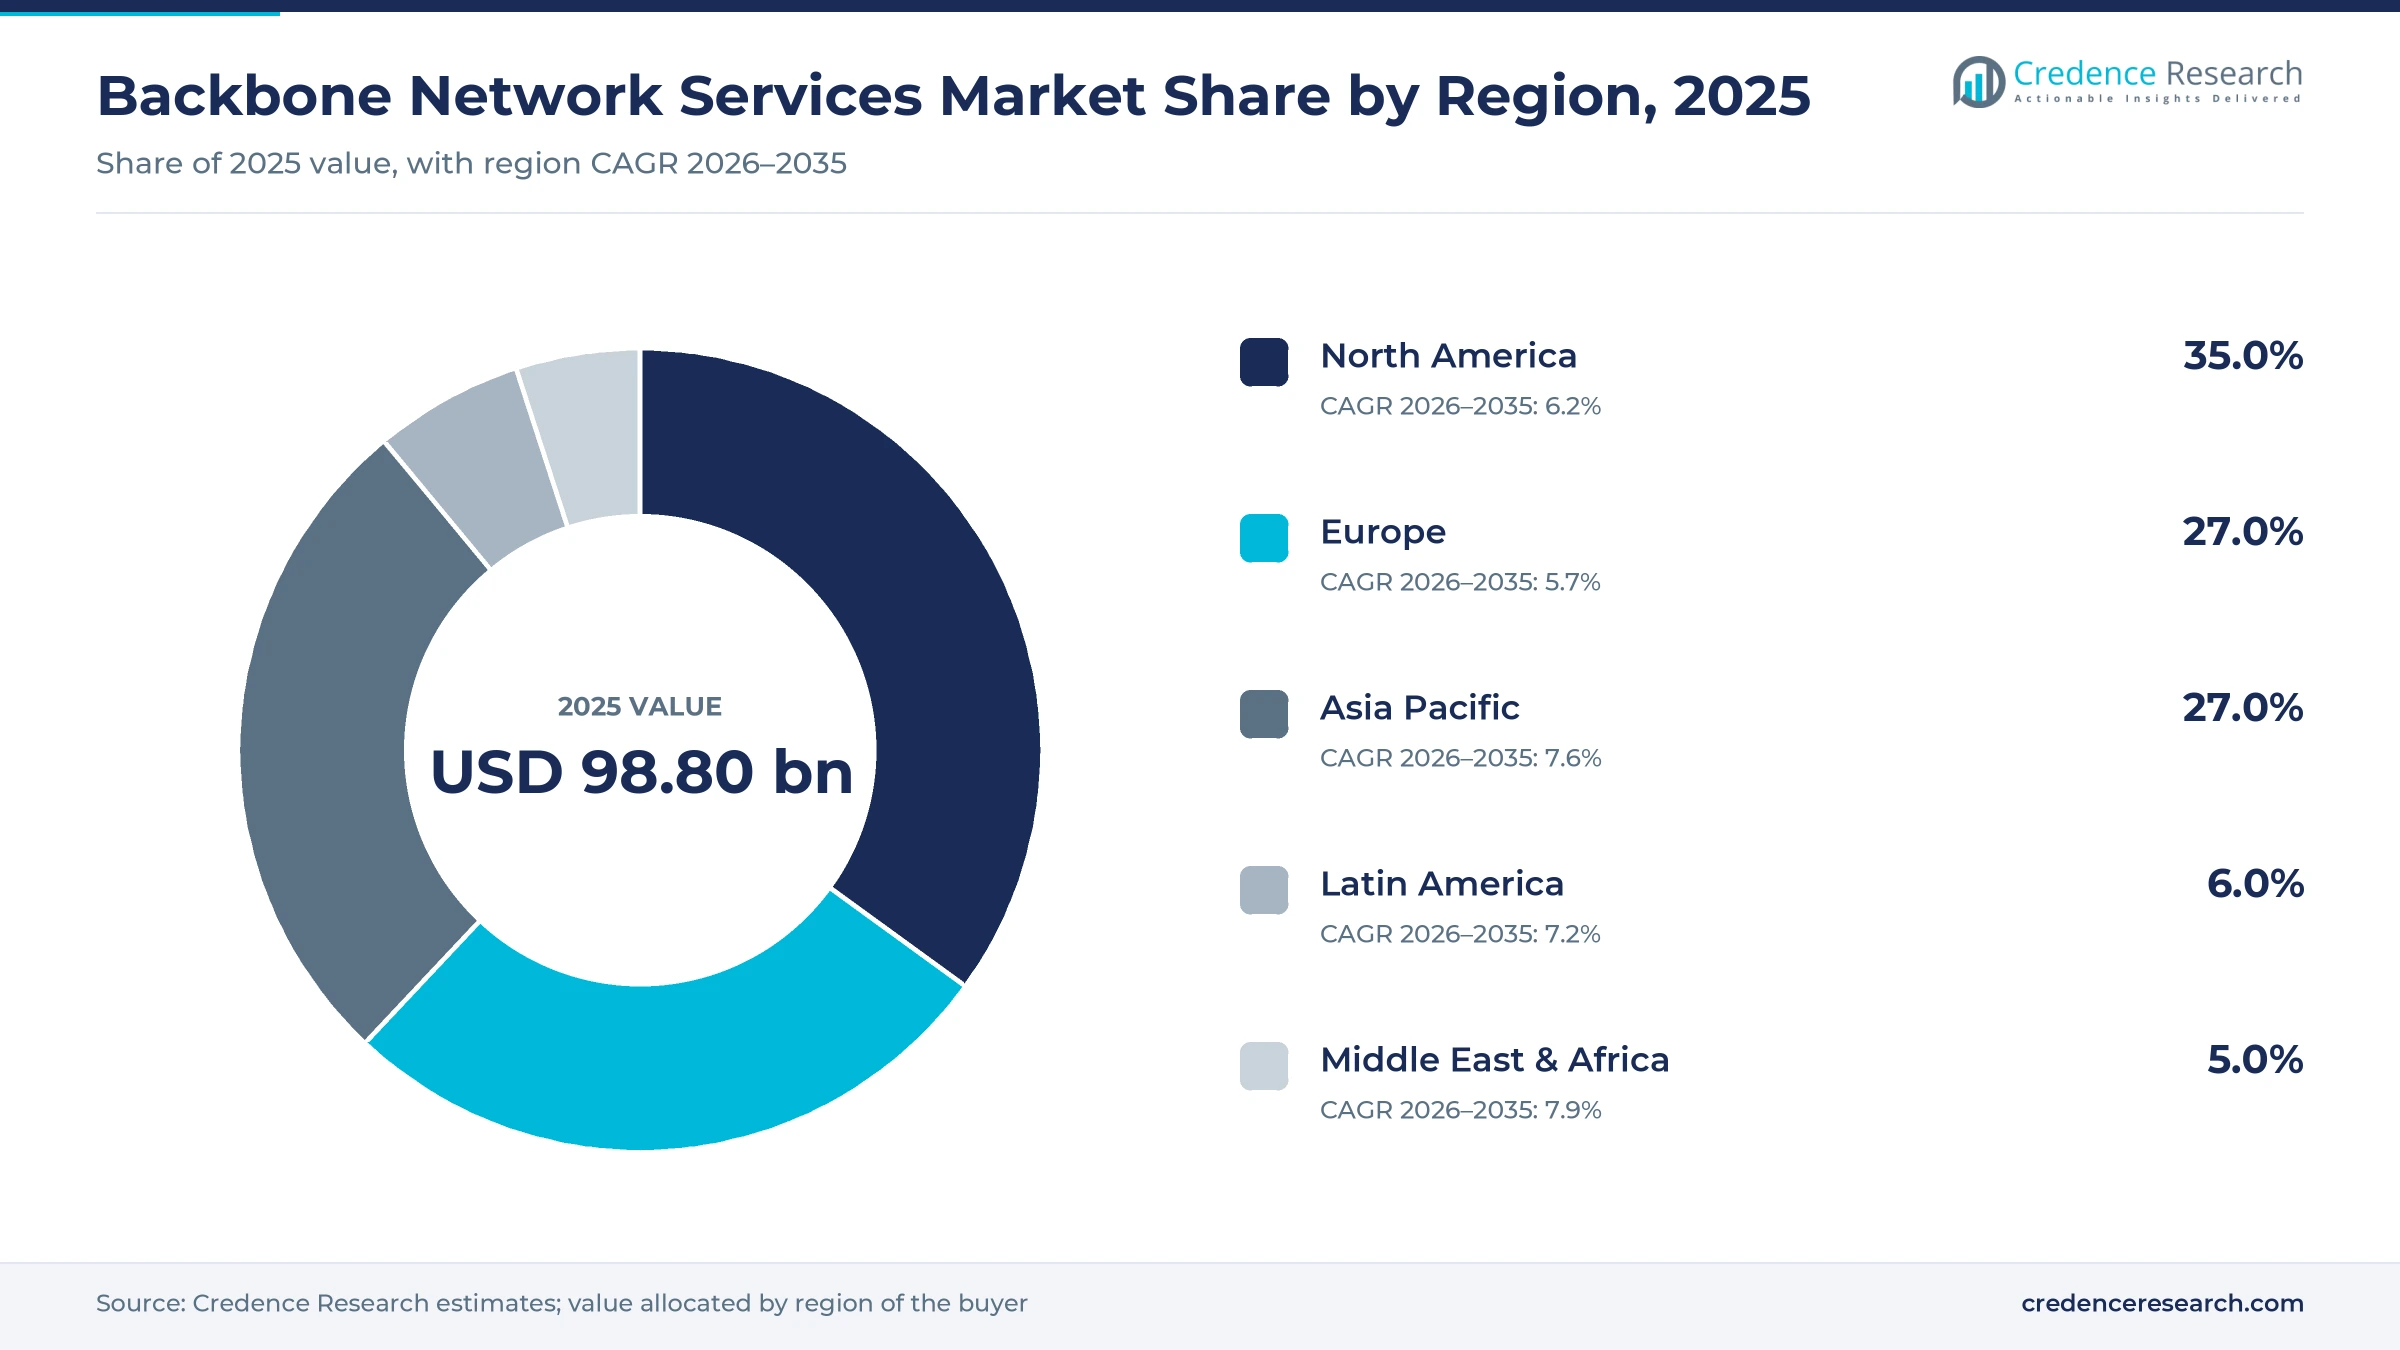
The global backbone network services market was valued at USD 98.80 billion in 2025 and is projected to increase from USD 105.37 billion in 2026 to USD 188.08 billion by 2035, registering a CAGR of 6.65% during 2026–2035. Demand comes from telecom operators that carry mobile and broadband traffic between cities, cloud and content companies that link their data centers, and enterprises and public bodies that buy private and internet connectivity across regions. North America held the largest regional share, 35.0% in 2025, because most hyperscale campuses and the deepest long-haul fiber routes sit in the United States. Middle East & Africa is the fastest-growing region at 7.9% a year, as new subsea systems and overland corridors reach the Gulf and Africa. The commercial change that matters most is the shift from shared transit toward multi-year contracts for dedicated fiber and wavelengths, which cloud companies now sign to connect AI training and inference sites.
Which long-haul services count, and which access links are left out?
The estimate covers paid services that move traffic across the core of networks, including IP transit, wholesale and managed wavelengths, dark fiber leases on long-haul and metro core routes, and the private intranet and VPN backbones that carriers run for enterprises and public bodies. Buyers purchase these services on monthly leases or on long contracts that are often prepaid for the life of a fiber pair.
Last-mile broadband and mobile access, customer premises equipment and the routers and optical gear that carriers buy are left out, although equipment cost shapes service prices. Network vendors therefore appear in the analysis as suppliers to carriers rather than as sellers in this market. Value is measured at the service level, before any resale by cloud companies or managed service partners.
Backbone Network Services Market Insights
- The market is valued at USD 98.80 billion in 2025 and is projected to reach USD 188.08 billion by 2035, growing at a 6.65% CAGR as AI data center links add contracted fiber.
- North America led with 35.0% of 2025 value, because hyperscale campuses and the densest long-haul fiber routes are concentrated in the United States.
- Internet Backbone Services held 48.0% of 2025 value, while Intranet Backbone Services grow fastest at 7.6% a year to 2035.
- Lumen said in February 2026 that its private connectivity fabric deals with large technology companies had reached nearly USD 13 billion.
- Verizon disclosed nearly USD 4 billion of AI Connect contracts in its third-quarter 2026 results, including a dark fiber agreement with Amazon Web Services valued at more than USD 2 billion.
Fiber and public internet routes lead as private links grow
Why does fiber lead while wireless backbones grow fastest?
Based on network type, the market is categorized into wired backbone network and wireless backbone network. Wired Backbone Network led with 76.0% of 2025 value because terrestrial and subsea fiber carry almost all long-distance traffic, and Meta notes that subsea cables alone carry more than 95% of intercontinental traffic. Wireless Backbone Network grows fastest at 7.5% a year as satellite links reach sites that fiber cannot serve economically. Vodacom signed an agreement with Starlink in November 2025 to add low Earth orbit backhaul to its mobile networks, and Starlink was then active in 25 African countries, Converge Digest reported.
Why does public internet transit lead while private backbones grow?
Based on service type, the market is categorized into internet backbone services, intranet backbone services and VPN backbone services. Internet Backbone Services led with 48.0% of 2025 value because every access provider and content network must buy or exchange transit, and Cogent alone served 87,326 on-net customer connections at the end of September 2026, according to its third-quarter results. Intranet Backbone Services grow fastest at 7.6% a year as cloud companies build private networks, and the private fabric deals that Lumen and Verizon signed with large technology companies, covered under drivers, show cloud buyers taking whole fiber routes.
Why do telecom operators lead while enterprise and cloud buyers grow fastest?
Based on end-use industry, the market is categorized into telecommunication, enterprise and cloud, government, education and healthcare. Telecommunication led with 38.0% of 2025 value because mobile and broadband operators lease long-haul capacity to carry subscriber traffic between cities, and the GSMA expects 57% of mobile connections to run on 5G by 2030. Enterprise and Cloud grows fastest at 7.8% a year as companies move workloads between clouds, and Zayo said in July 2025 that more than 100 Quick Connect data centers can turn up IP and Ethernet ports within 10 days.
| Segment Group | Leading Sub-segment | Share, 2025 | Fastest-growing Sub-segment | CAGR, 2026–2035 |
|---|---|---|---|---|
| By Network Type | Wired Backbone Network | 76.0% | Wireless Backbone Network | 7.5% |
| By Service Type | Internet Backbone Services | 48.0% | Intranet Backbone Services | 7.6% |
| By End-Use Industry | Telecommunication | 38.0% | Enterprise and Cloud | 7.8% |
Transit sells per megabit while 400G waves carry a premium
Backbone pricing works on two separate models with different cost drivers. IP transit is billed per megabit per month on a committed port, so the price a buyer pays depends on port size, location and the number of competing carriers at the same data center. Wavelengths and dark fiber are leased per circuit or per fiber pair, and the premium for a 400G wave over a 100G wave is smallest on busy terrestrial routes where several carriers compete. Large cloud buyers take whole fiber pairs on long contracts, which moves carrier margin from monthly circuits toward upfront builds and leaves smaller carriers competing on price in the transit tier.
| Service or route | Typical price or fee | Basis |
|---|---|---|
| Dark fiber agreement, Verizon with Amazon Web Services | More than USD 2 billion, multi-year | Verizon, third-quarter 2026 call, via Lightwave |
| Private connectivity fabric deals, Lumen | Nearly USD 13 billion cumulative | Lumen, fourth-quarter 2025 call, via Lightwave |
| 100 GigE IP transit, competitive hubs | About USD 0.02 to 0.05 per Mbps a month | Credence Research estimate |
| 400G wave on a busy terrestrial route | About 2 to 3 times the 100G price | Credence Research estimate |
Request a Free Sample
Fill in your details and we'll send you a free sample report.
- Sample data tables & charts
- Research methodology
AI fiber contracts and traffic growth lift carrier demand
AI data center contracts lift demand for dedicated fiber
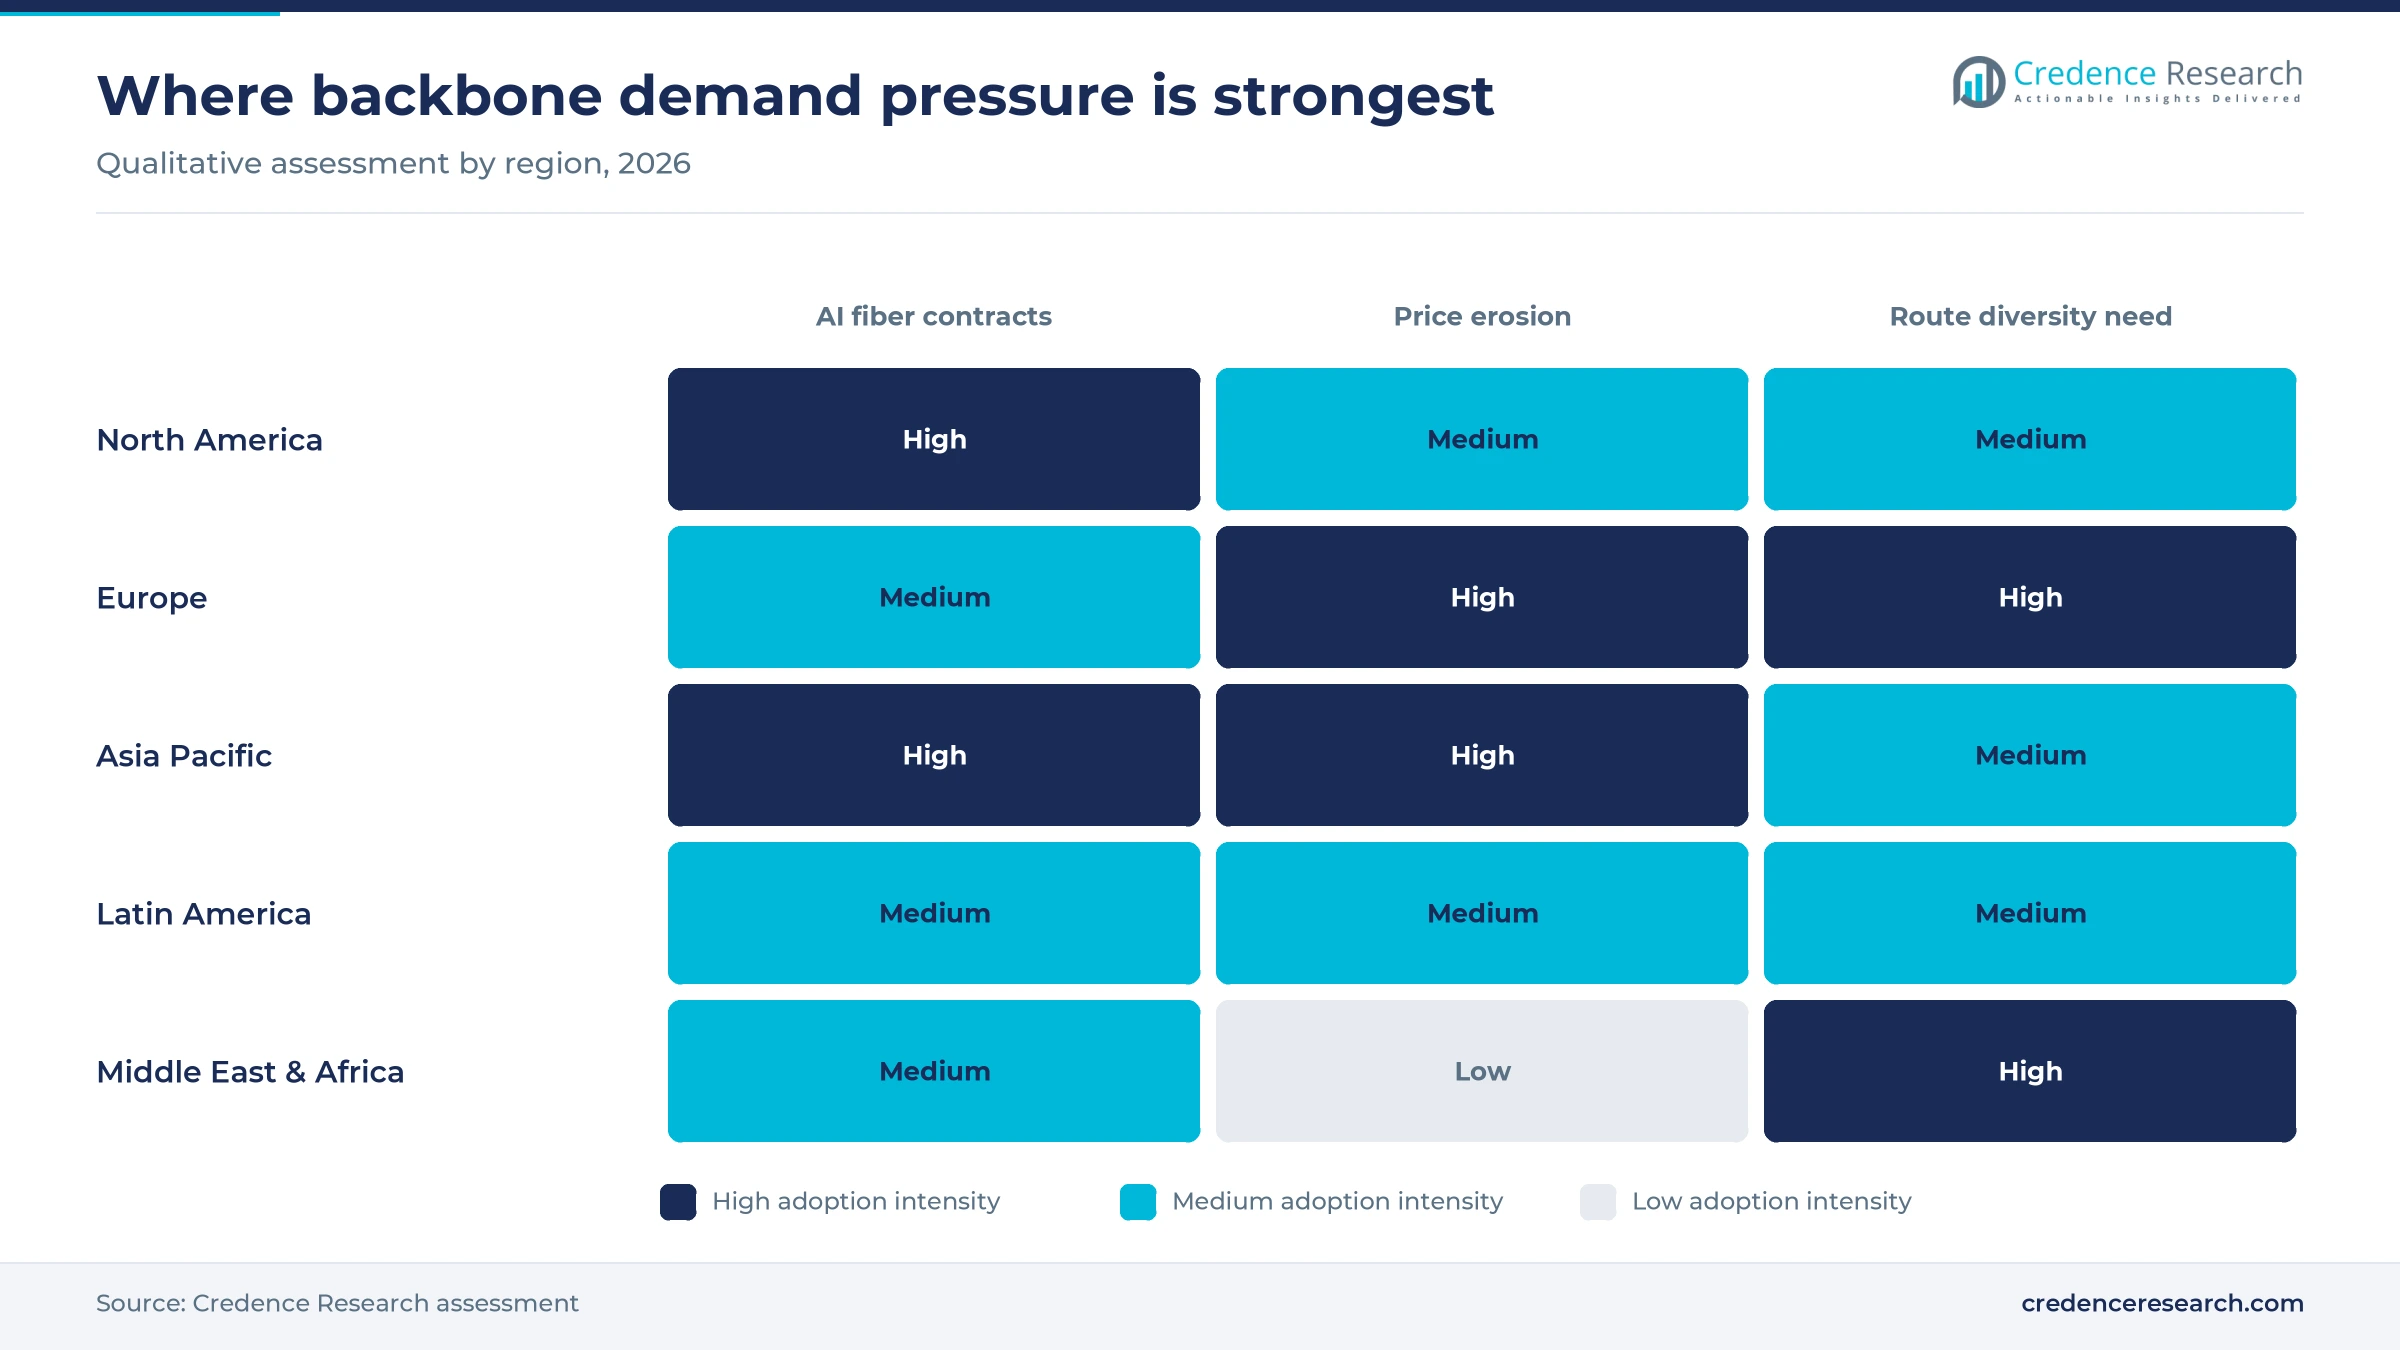
Cloud and AI companies are signing multi-year contracts for dedicated fiber between their campuses, because distributed training and inference need capacity that shared transit cannot guarantee. Lumen said in February 2026 that its private connectivity fabric deals had reached nearly USD 13 billion, with more in the pipeline. Verizon disclosed nearly USD 4 billion of AI Connect contracts on its third-quarter 2026 earnings call, including a dark fiber agreement with Amazon Web Services valued at more than USD 2 billion, Lightwave reported. Zayo expects AI-driven demand for capacity to grow two to six times by 2030. Carriers that own conduit on the right routes gain contracted, prepaid demand, while transit-only providers gain little from this spending.
Traffic growth outpaces falling unit prices
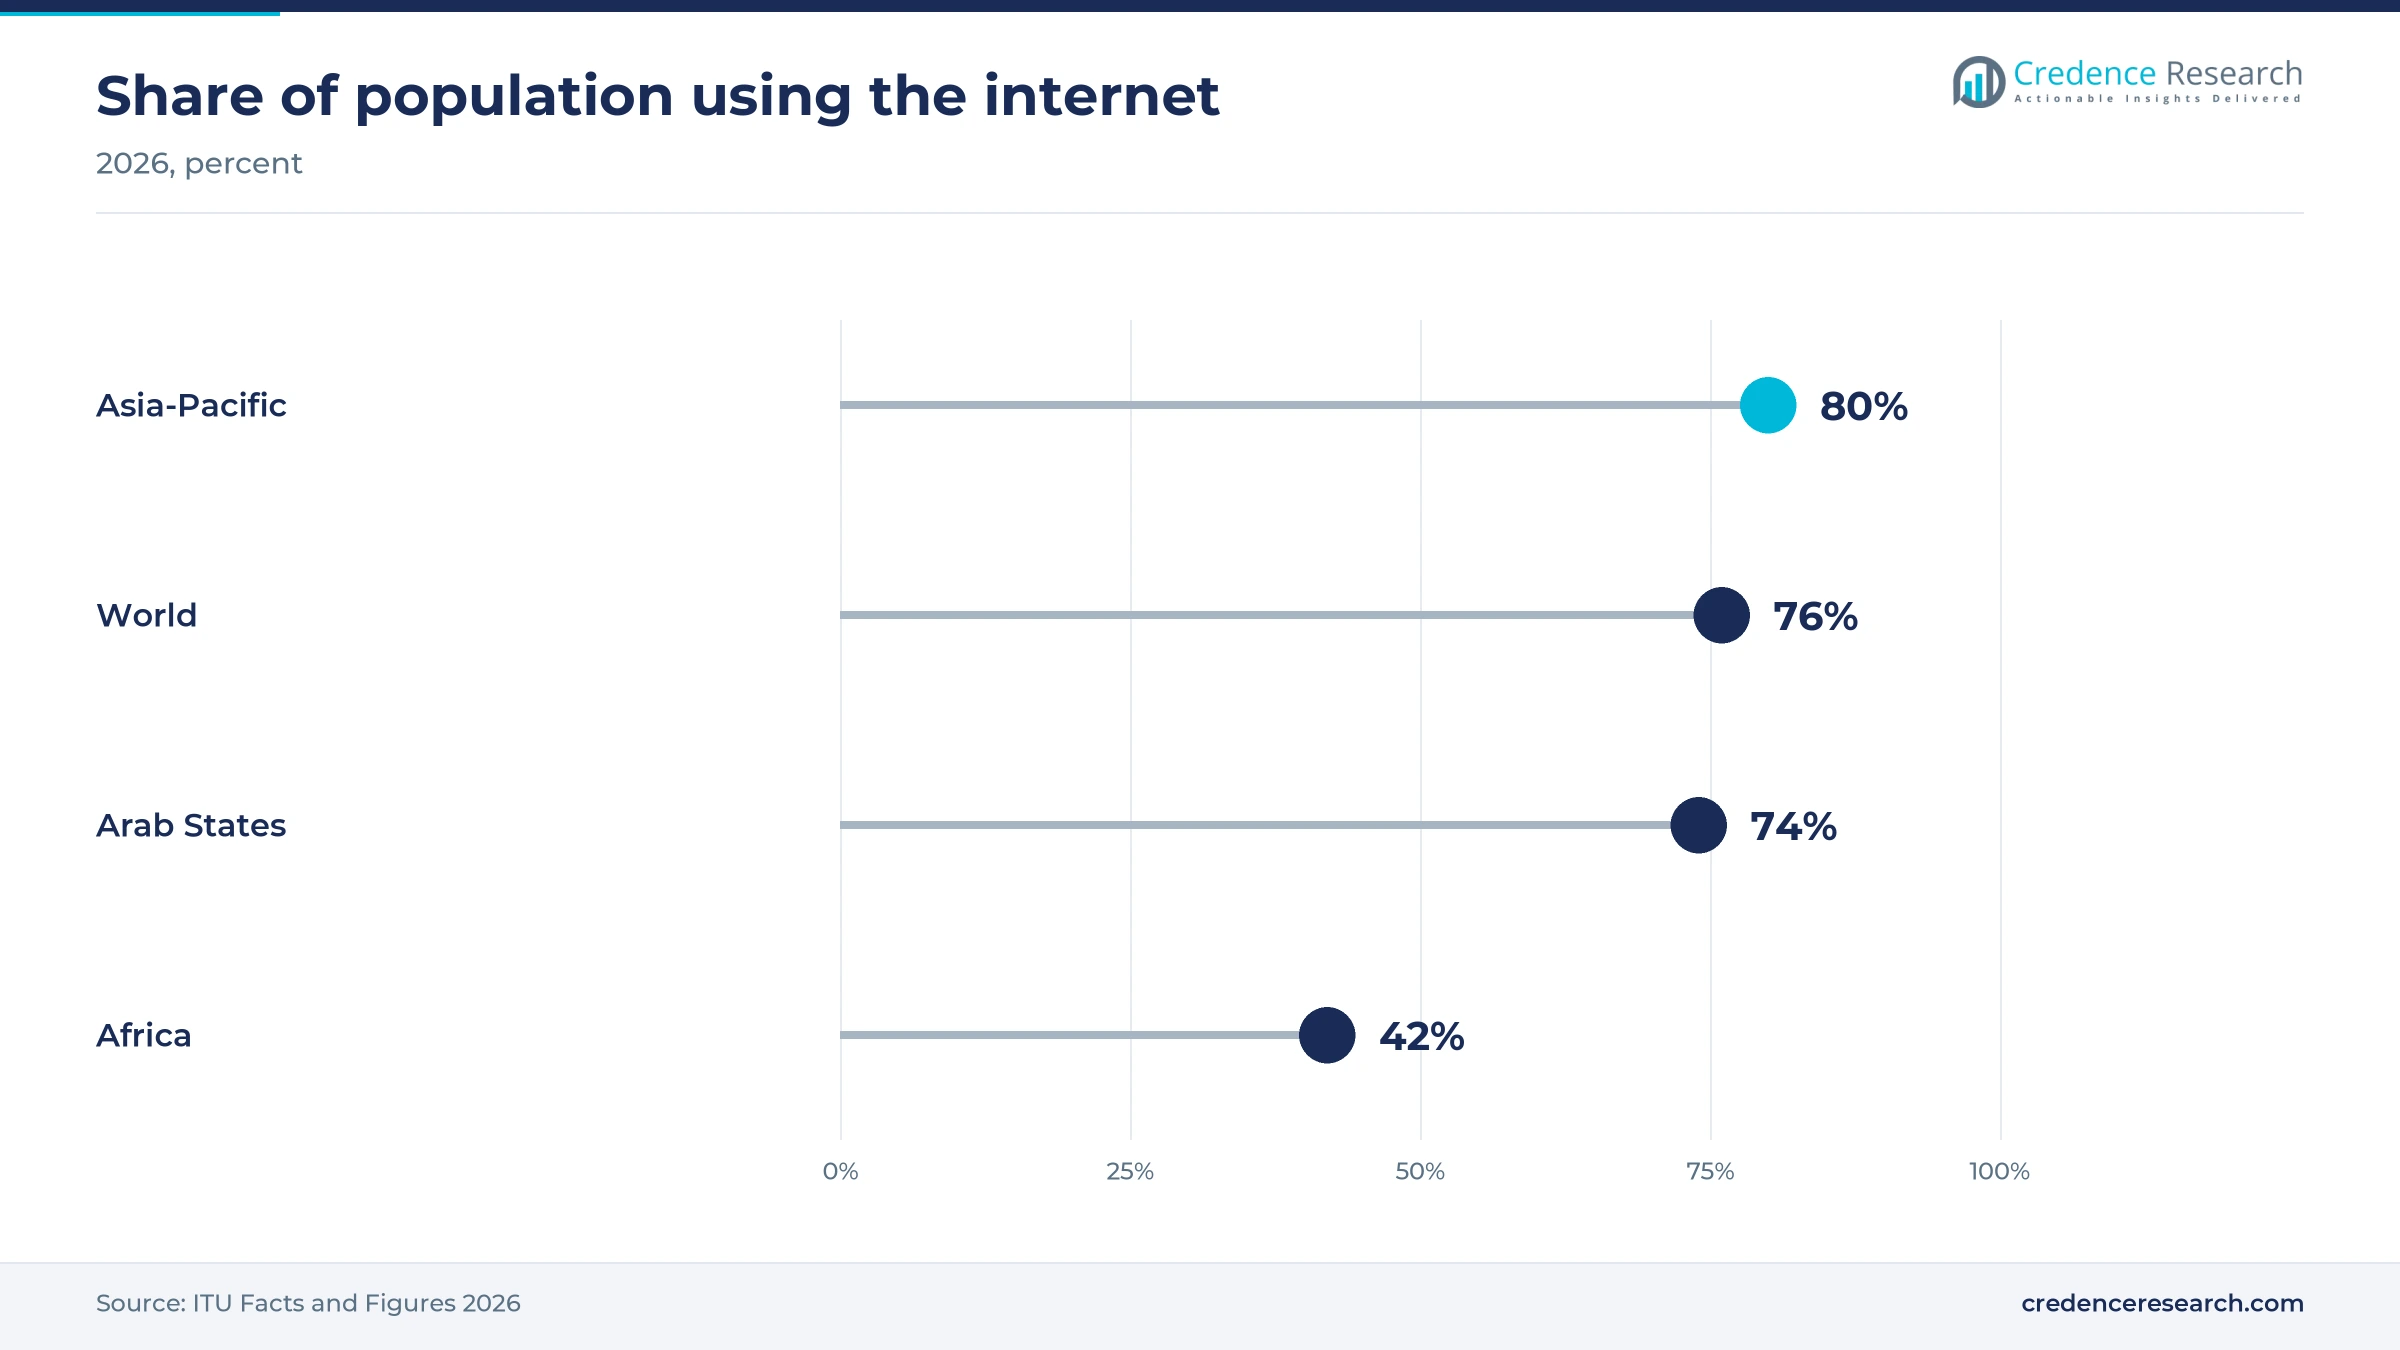
Traffic growth keeps forcing carriers to add capacity on their core routes, even as each unit of bandwidth gets cheaper. AppLogic Networks, a traffic management vendor, reported in its 2026 Global Internet Phenomena Report that AI traffic grew 90% on fixed networks and 80% on mobile networks, although it remains small next to video. The ITU estimates that 76% of the world population, about 6.3 billion people, were online in 2026, leaving about 2 billion still to connect. Content networks now order capacity years ahead of demand, as the 24-pair Waterworth plan noted below shows. Sustained volume growth keeps carriers buying upgrades and protects total spending even when prices per megabit fall.
Public broadband programs fund middle-mile and ring backbones
Public broadband programs are paying for the regional backbones that connect new rural access networks to the core, which creates wholesale demand for carriers on those routes. The U.S. National Telecommunications and Information Administration approved the last of 56 state and territorial BEAD final proposals on Aug. 26, 2026, in a program worth USD 42.45 billion. India approved the amended BharatNet program on Aug. 4, 2023, moving it to an IP-MPLS ring architecture to connect about 2.64 lakh village councils. The European Commission proposed on Jan. 21, 2026, that copper networks shut by Dec. 31, 2035. Carriers that already run fiber near funded areas are best placed to win the backhaul contracts.
New subsea systems widen the capacity carriers can sell
New subsea systems are expanding the international capacity that wholesale carriers can resell, because each new cable adds fiber pairs on routes where demand already exceeds supply. Meta announced Project Waterworth on Feb. 14, 2025, a planned cable of more than 50,000 km with 24 fiber pairs, against eight to 16 pairs on other new systems. Content networks are the anchor buyers on these routes, which is why a single company can justify 24 pairs on one system, and Meta says the cable will open three new oceanic corridors. Carriers that buy spectrum on these systems gain resale inventory, while owners of older cables face lower prices.
400G waves, on-demand ports and new corridors reshape supply
Carriers are shifting their cores to faster wavelengths
Carriers are shifting their core networks toward 400G wavelengths, because higher-capacity waves lower the cost per bit on crowded routes and free spectrum on existing fiber. Zayo said it completed the upgrade of its North American core to the faster waves in the second quarter of 2025, adding 393.6 terabits of optical capacity. Lumen is deploying the same class of wavelength service across 36 routes, with others in development, Lightwave reported in February 2026. Arelion's Nordic wave upgrade, covered in the regional analysis, shows the next step already entering service. Early movers win cloud orders, and carriers on older gear face price pressure.
On-demand ports are rising as enterprises buy like cloud users
Enterprises are shifting toward backbone capacity they can order and resize through a portal, because cloud workloads change faster than traditional circuit contracts allow. Lumen said in February 2026 that more than 2,000 businesses were using its network-as-a-service platform, about double the 1,000 customers it reported in August 2025. Buyers can add ports at new sites without waiting for a fresh contract cycle, which shortens the sales process for carriers. The company also expanded Internet On-Demand to more than 10 million new locations, mainly office buildings and data centers. It launched a Multi-Cloud Gateway that routes traffic between clouds on its fiber. Carriers with automated ordering gain enterprise share, while resellers lose their role.
India opens room for new intercity AI corridors
India offers an opening for carriers that can build low-latency intercity fiber between new data center clusters, because capacity on many domestic routes was planned for consumer traffic, not cloud workloads. Tata Communications announced in October 2026 a planned investment of USD 400 million to USD 450 million for about 10,000 km of new long-haul fiber, Light Reading reported. The first phase covers the Mumbai, Pune, Hyderabad and Chennai corridor, with later phases to Vizag, Bhubaneswar, Jamnagar and GIFT City and links to cable landing stations. Cloud operators and Indian colocation providers stand to gain diverse routes, and carriers that win anchor tenants early secure pricing.
Gulf overland routes create an opening around chokepoints
Gulf carriers are opening overland routes that avoid the Red Sea and the Strait of Hormuz, which creates demand for transit and wave capacity on new paths to Europe. STC signed a contract on Feb. 7, 2026, for SilkLink, an USD 800 million fiber route of about 4,500 km across Syria, Rest of World reported. The WorldLink consortium plans a USD 700 million route from the UAE through Iraq to Turkey over four to five years. Only about 60 specialized repair ships exist worldwide, according to the same report. Carriers that secure rights on these corridors can sell premium diverse routes to cloud buyers.
Price erosion, cable faults and capex weigh on carriers
Steady price erosion squeezes transit margins
Falling unit prices limit how much of the traffic growth turns into carrier spending. Each new route and optics generation adds supply on the busiest paths, and Credence Research assumes a mid-teens annual decline in wholesale unit prices through 2032, steepest in fast-growing hubs such as Mumbai where new entrants compete for the same data centers. Zayo alone added 10 more points of presence enabled for its fastest waves in the second quarter of 2025, according to the company. Transit-heavy carriers without owned fiber are most exposed, and many respond by bundling waves, security and cloud access.
Subsea cable faults expose single-route operators
Cable cuts raise costs and churn for carriers that depend on one or two international routes. Faults on the SMW4 and IMEWE systems near Jeddah from Sept. 6, 2025, degraded connectivity in Saudi Arabia, Pakistan, the UAE and India, and Microsoft warned of higher Azure latency, Al Jazeera reported. The European Union presented a cable security plan on Feb. 21, 2025, directing about EUR 540 million to cables. Carriers without diverse routes are the most likely to lose enterprise contracts after such faults.
EU access rules leave interconnection terms uncertain
Uncertainty over European interconnection rules complicates long-term pricing for carriers that exchange traffic with large content networks. The Digital Networks Act proposal of Jan. 21, 2026, sets no fair-share fee on large technology companies but creates a conciliation process with national regulators and BEREC for disputes between networks and customers, Covington reported. Carriers that hoped for direct payments from content networks remain exposed until the Parliament and Council settle the text.
Long fiber builds tie up capital before revenue arrives
Building new long-haul routes takes years and heavy capital before contracted capacity is handed over. Lumen met its goal of 17 million intercity fiber miles in 2025 and said its private fabric deals will raise total network expansion to 58 million fiber miles by 2031, Lightwave reported. Zayo committed in January 2025 to build more than 5,000 new long-haul route miles. Carriers with high debt or weak anchor contracts are most exposed if AI spending slows, because permits, labor and fiber supply costs are paid upfront.
North America leads while Africa and the Gulf add routes
| Region | Value, 2025 (USD billion) | Share, 2025 | CAGR, 2026–2035 |
|---|---|---|---|
| North America | 34.58 | 35.0% | 6.2% |
| Europe | 26.68 | 27.0% | 5.7% |
| Asia Pacific | 26.68 | 27.0% | 7.6% |
| Latin America | 5.93 | 6.0% | 7.2% |
| Middle East & Africa | 4.94 | 5.0% | 7.9% |
North America leads on hyperscale routes and low latency
North America held 35.0% of 2025 value and grows at 6.2% a year, because the largest cloud campuses and most new long-haul builds for hyperscale data centers sit in the United States. Zayo said in July 2025 that it was building a 385-mile low-latency route from Chicago to Columbus and a 521-mile dark fiber route from Chicago to Minneapolis. Low-latency routes such as these serve trading firms and cloud buyers alike, so carriers can sell the same fiber at premium prices to two customer groups, while buyers in secondary metros gain new options.
Europe upgrades Nordic routes for data center growth
Europe held 27.0% of 2025 value and grows at 5.7% a year, slowed by intense price competition on terrestrial routes between Frankfurt, London, Amsterdam and Paris. Arelion said in June 2025 that it was upgrading its Oslo, Stockholm and Copenhagen network with 1.6 Tb/s waves and new ducts to serve hyperscale and AI campuses. The company expects Nordic data center capacity to grow by 280 MW to 580 MW a year, which gives Nordic routes faster growth than the European average and favors carriers with diverse paths into the region.
Asia Pacific scales national optical cores in China and India
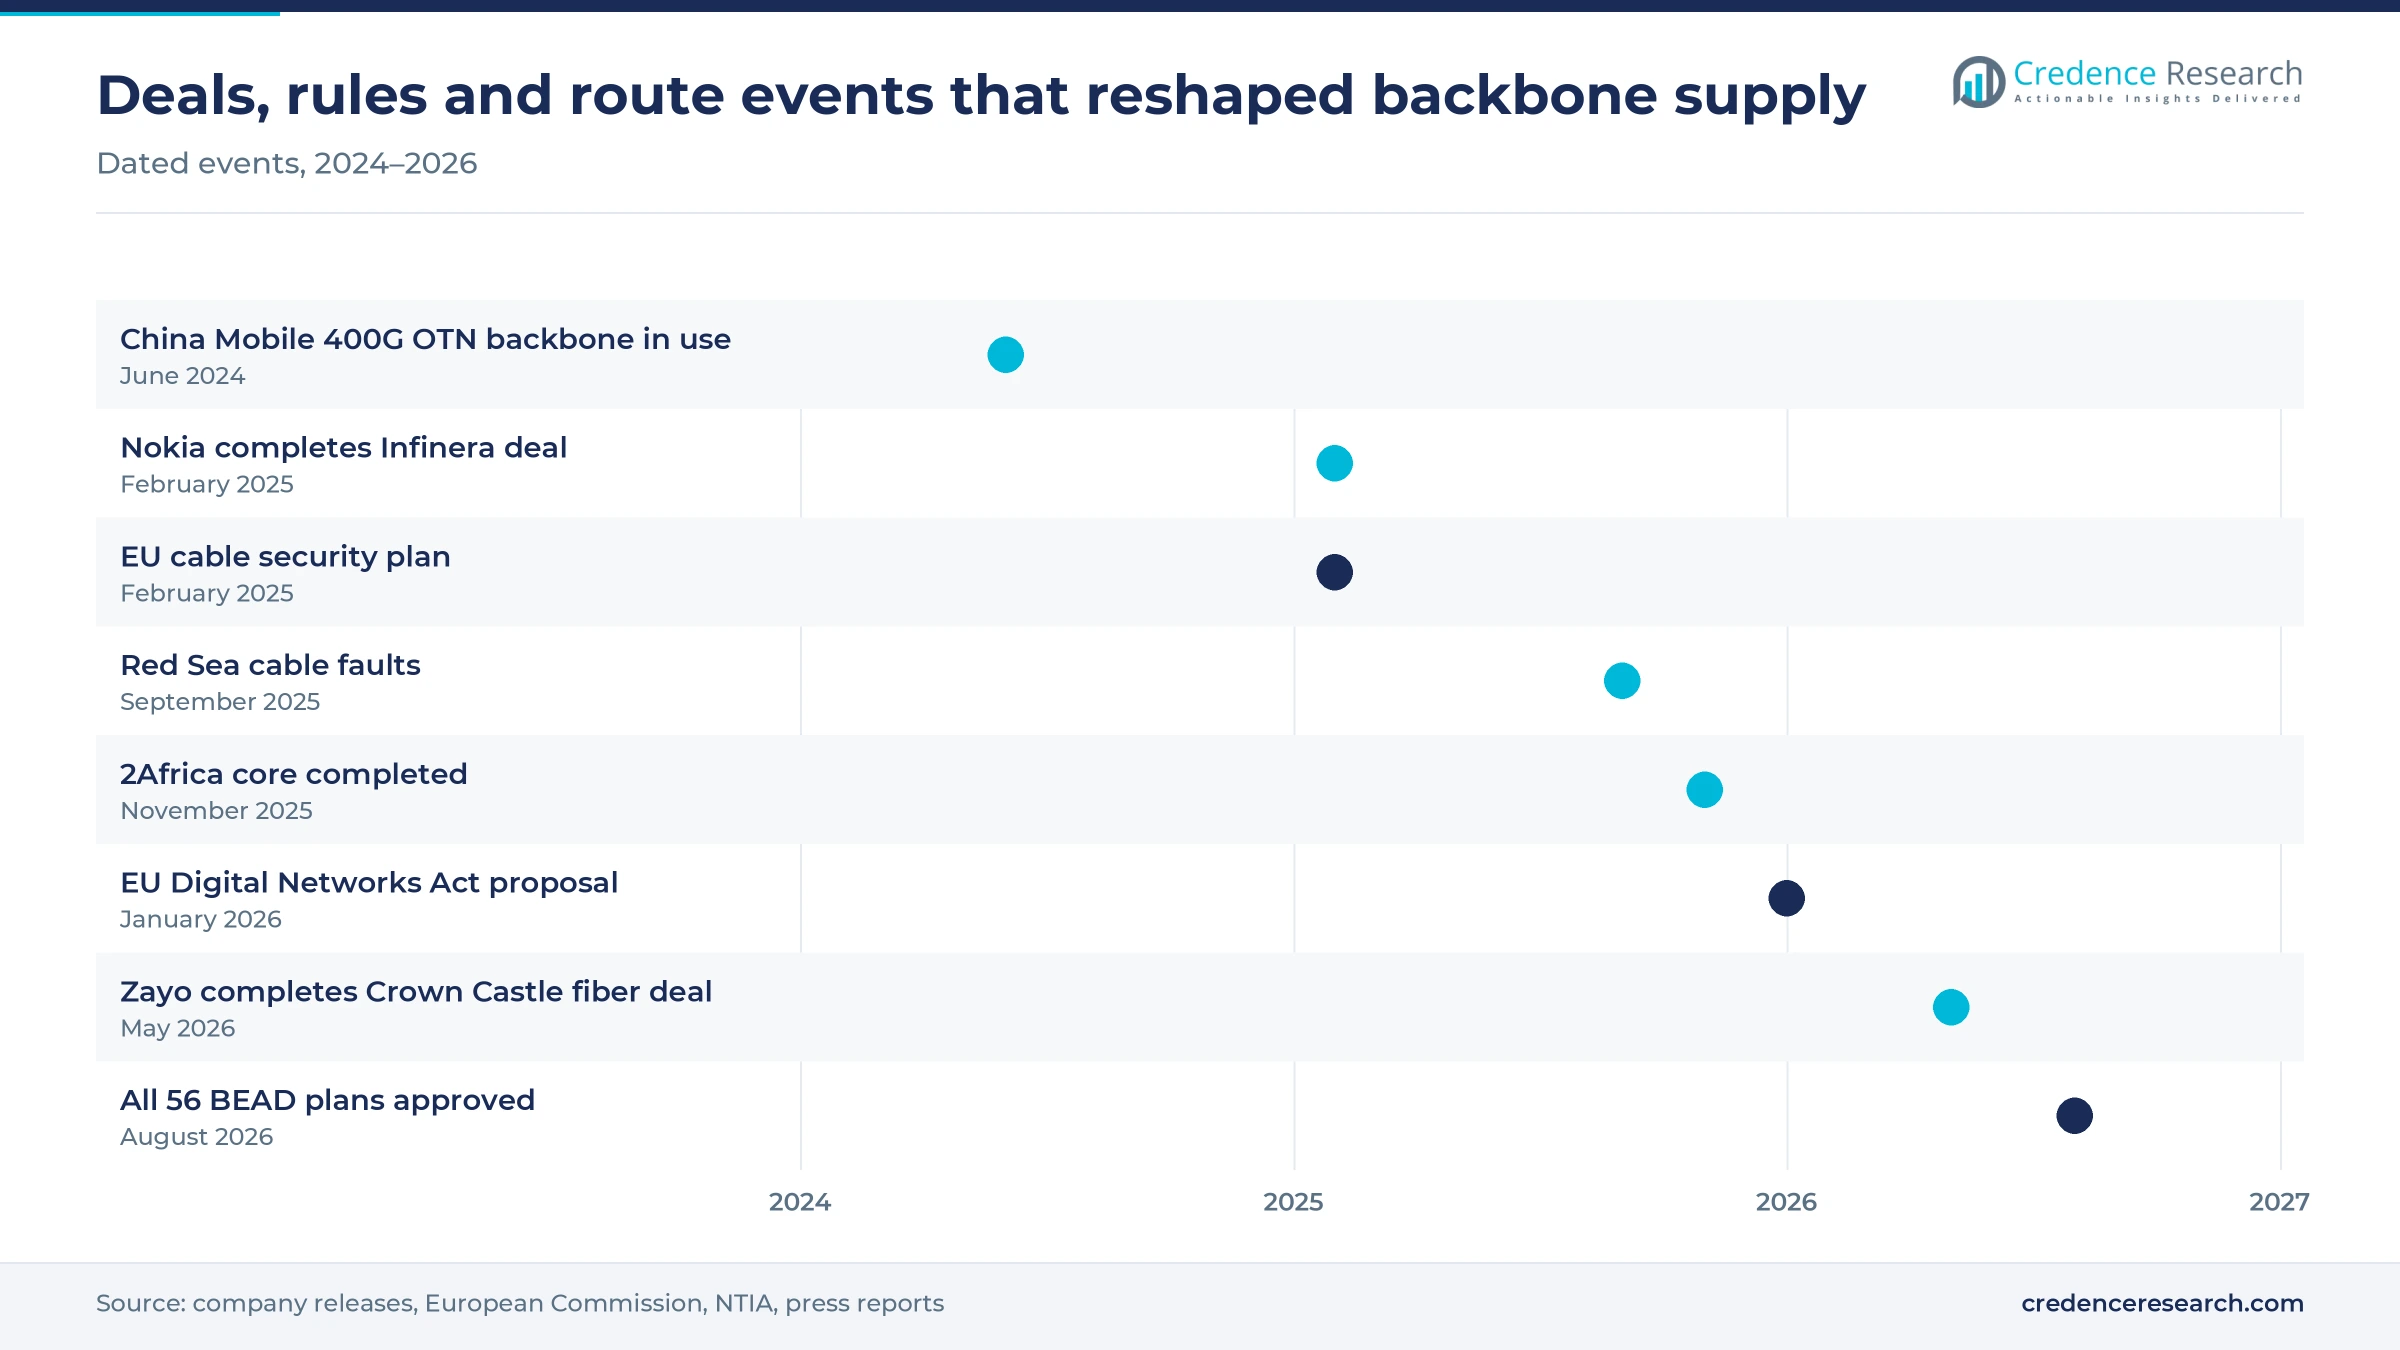
Asia Pacific held 27.0% of 2025 value and grows at 7.6% a year, led by state-owned operators in China and new private builds in India. China Mobile put the first link of its new-generation OTN inter-province backbone, from Beijing to Inner Mongolia, into commercial use on June 28, 2024, with more than 1,900 sets of OTN devices in 135 cities, Total Telecom reported. Domestic operators gain scale on national routes, while foreign carriers compete mainly on international transit and cloud links.
Latin America adds data center rings around Brazil
Latin America held 6.0% of 2025 value and grows at 7.2% a year, as cloud regions in Brazil, Mexico and Chile pull capacity from the United States. Cirion said on Sept. 29, 2025, that its data center connect service links more than 70 data centers in Brazil and 160 across Latin America on Ciena coherent optics. That pull from cloud regions in São Paulo, Querétaro and Santiago favors carriers with subsea landing rights on routes to U.S. hubs.
Middle East & Africa grows fastest on new subsea systems
Middle East & Africa held 5.0% of 2025 value and grows at 7.9% a year, the fastest of any region. Meta completed the core of the 2Africa system in November 2025, landing in 33 countries, with the West trunk carrying up to 180 Tbps. With only 42% of Africans online in 2026, according to the ITU, carriers that extend inland backbones from new landings have room to grow.
Deals closed in 2025 and 2026 regrouped fiber and optics
| Development | Status and market relevance |
|---|---|
| In February 2025, Nokia completed its acquisition of Infinera, combining two optical suppliers that sell to backbone carriers and webscale operators. | Completed; fewer optical vendors for carriers |
| In November 2025, Meta completed the core of the 2Africa subsea system, which lands in 33 countries across three continents. | Completed; Pearls extension due in 2026 |
| In February 2026, AT&T completed its USD 5.75 billion purchase of the Lumen mass markets fiber business, adding about 1 million subscribers. | Completed; Lumen now focused on business and wholesale |
| In May 2026, Zayo completed its USD 8.5 billion purchase of the Crown Castle fiber business, adding about 90,000 route miles. | Completed; network about 224,000 route miles |
| In July 2026, Tata Communications announced capacity investments on Mumbai to Singapore and Chennai to Singapore subsea systems. | Announced; Chennai system due in Q4 2029 |
Pluggable optics and 1.6T waves cut the cost of each bit
- Coherent pluggable optics put long-reach transmission into pluggable transceivers in router ports, and the OIF 800ZR agreement of October 2024 covers 800G links of 80 km to 120 km.
- Routed optical networking removes separate transponders, and Arelion ran a 1,069 km trial of 800G ZR+ optics between Stockholm and Hamburg.
- 1.6 Tb/s wavelengths double the capacity of each wave, and Arelion demonstrated a 1.6 Tb/s wave with Ciena in August 2024.
- IEEE P802.3dj Ethernet defines 200G-per-lane interfaces up to 1.6 TbE, and its task force authorized draft 3.1 in May 2026.
Need a Custom Version of This Report?
Tailor the scope, geography, or segments to your exact requirements.
- Custom geography or segment scope
- Direct access to our analyst team
Route ownership and hyperscaler ties decide who wins
Competition turns on three factors that backbone buyers test before they sign a contract. The first is route ownership, because carriers that own conduit can offer dark fiber, custom builds and diverse paths that resellers cannot match. The second is the relationship with cloud companies, which now place the largest and longest orders and often prepay for fiber pairs. The third is automation, since enterprises expect to order, resize and monitor capacity online. U.S. facility owners such as Lumen, Zayo, AT&T and Verizon compete most directly for hyperscale contracts. Tier-1 networks such as Arelion, Cogent, NTT and Tata Communications compete on global reach and transit price. European incumbents, including Orange, Telefonica and Vodafone, and China Telecom Global sell wholesale capacity on their regional and subsea routes. Most suppliers also resell dark fiber and wavelengths from partners to fill gaps in their own maps.
How is the supply of long-haul capacity organized?
Supply of long-haul capacity is organized in three layers with very different economics. Facility owners such as Lumen, Zayo, AT&T, Verizon and the national incumbents own conduit and fiber, and they earn the highest margins on dark fiber and long contracts. Tier-1 IP networks such as Arelion, Cogent, NTT and Tata Communications sell transit and waves on owned or leased routes and compete on reach and price. Cloud companies operate private backbones and buy fiber rather than services. Rights of way, permits and route diversity are the main barriers to entry, so concentration is highest on long-haul routes and lowest in metro transit.
Companies profiled and their roles in this market
| Company | Type | Role in the market |
|---|---|---|
| Lumen Technologies | Facility owner | Intercity fiber, waves, IP transit and private fabrics for cloud companies |
| AT&T Inc. | Incumbent carrier | Long-haul transport, wholesale waves and enterprise VPN backbones in the United States |
| Verizon Communications Inc. (Verizon Business) | Incumbent carrier | Dark fiber, waves and private IP backbones for cloud and enterprises |
| Zayo Group | Facility owner | Long-haul and metro dark fiber, waves and IP across North America and Europe |
| Arelion | Tier-1 IP network | Global IP transit, waves and cloud connectivity from a Nordic-rooted network |
| Cogent Communications | Tier-1 IP network | Low-cost IP transit and wavelengths on its global and former Sprint routes |
| NTT DATA Group (NTT Global IP Network) | Tier-1 IP network | Global IP transit and transport with a strong Asia Pacific base |
| Tata Communications | Tier-1 IP network | Global IP transit and subsea capacity with an Indian intercity backbone |
| Orange S.A. (Orange Wholesale) | Incumbent carrier | International transit, subsea capacity and wholesale waves in Europe and Africa |
| Telefonica S.A. (Telefonica Global Solutions) | Incumbent carrier | IP transit and international capacity across Europe and Latin America |
| Vodafone Group Plc | Incumbent carrier | Wholesale transport and international IP backbone across Europe and Africa |
| China Telecom Global | Incumbent carrier | International IP transit and transport linking China with global routes |
Contracted fiber, not transit volume, drives margin
Credence Research's view is that margin in backbone network services is moving from metered transit to contracted fiber. Transit volume keeps growing, but unit prices fall fast enough that transit-only carriers gain little from it. The carriers that gain are those that own rights of way on the routes cloud companies need and can deliver custom builds on schedule. Buyers should expect fewer suppliers on the busiest long-haul paths after the 2025 and 2026 deals, and should secure diverse routes before demand from AI campuses tightens availability further.
Old estimate rolled forward and tested on carrier data
The report uses 2025 as the base year and forecasts to 2035. The 2025 value rolls forward the earlier Credence Research estimate at its own growth rate and is checked against public carrier disclosures, wholesale price data and bandwidth statistics. Regional and segment splits are Credence Research estimates built from route ownership, data center locations, public program funding and published deal terms. Public data on satellite and microwave backbone spending is thin, so the wireless split carries the widest uncertainty. Sources include company releases and investor material, regulator and government documents, standards bodies and telecom trade press. No interviews or surveys were conducted by Credence Research for this edition of the backbone network services estimate.
Dedicated AI fiber carries growth as transit prices slide
The market is set to grow from USD 105.37 billion in 2026 to USD 188.08 billion by 2035 as cloud companies keep connecting new campuses and carriers move their cores to faster waves. Dedicated fiber and private backbones will take a rising share of spending, while public transit grows more slowly because prices keep falling. New subsea and overland routes in Africa, the Gulf and India add the fastest regional growth. The main risks are a pause in AI spending, more cable faults on crowded chokepoints and the cost of long builds for indebted carriers.
AI build-out pace and price erosion set the range of outcomes
The range of outcomes rests on two questions for carriers and buyers. The first is whether cloud companies keep signing long fiber contracts once the current AI campus wave is connected. The second is how fast unit prices fall as faster optics spread across busy routes. Slower AI spending combined with faster price erosion would hold growth below the base case, while wider inference networks and new Gulf and African routes would lift it above.
| Scenario | CAGR, 2026–2035 | Value, 2035 | What has to hold |
|---|---|---|---|
| Downside | 5.2% | USD 165.58 billion | Cloud companies pause new campus links after 2027 and transit prices fall faster |
| Base | 6.65% | USD 188.08 billion | AI fiber contracts continue at the 2026 pace and price erosion stays near recent rates |
| Upside | 8.2% | USD 213.28 billion | Inference networks spread to more metros and new Gulf and African routes fill quickly |
Frequently Asked Questions
How big is the backbone network services market?
What is a global backbone network and why does it matter?
Who are the main backbone providers?
How do backbone networks handle high traffic volumes better than traditional networks?
Where is internet backbone traffic concentrated, and why?
Which standards and protocols are shaping backbone networks?
What is backbone as a service?
Which region grows fastest in the backbone network services market?
Table of Content
Chapter 1 Market Segmentation
- 1.1 Segmentation Framework
- 1.1.1 Product and Service Classification
- 1.1.2 Application and End-Use Classification
- 1.1.3 Technology and Solution Classification
- 1.1.4 Customer and Distribution Channel Classification
- 1.1.5 Geographic Segmentation
- 1.1.6 Market Segment Definitions and Boundaries
- 1.2 By Network Type
- 1.2.1 Wired Backbone Network
- 1.2.2 Wireless Backbone Network
- 1.3 By Service Type
- 1.3.1 Internet Backbone Services
- 1.3.2 Intranet Backbone Services
- 1.3.3 VPN Backbone Services
- 1.4 By End-Use Industry
- 1.4.1 Telecommunication
- 1.4.2 Enterprise and Cloud
- 1.4.3 Government
- 1.4.4 Education
- 1.4.5 Healthcare
Chapter 2 Introduction
- 2.1 Report Objectives and Scope
- 2.2 Product Definition and Industry Terminology
- 2.3 Market Inclusions and Exclusions
- 2.4 Research Process
- 2.4.1 Primary Research and Expert Interviews
- 2.4.2 Secondary Research and Source Review
- 2.4.3 Top-Down and Bottom-Up Estimation
- 2.4.4 Data Triangulation and Verification
- 2.5 Market Size Measurement Basis
- 2.5.1 2025: USD 98.80 billion → 2035: USD 188.08 billion
- 2.6 Historical and Forecast Reference Periods
- 2.6.1 Historical Period: 2018-2025
- 2.6.2 Base Year: 2025
- 2.6.3 Forecast Period: 2025-2035
- 2.7 Research Assumptions and Limitations
Chapter 3 Executive Summary
- 3.1 Market Snapshot and Key Findings
- 3.2 Base-Year Market Size, 2025
- 3.3 Forecast Market Size, 2035
- 3.4 Revenue and Volume Growth Outlook
- 3.5 Key Demand and Supply Indicators
- 3.6 Leading Market Segments
- 3.7 Fastest-Growing Market Opportunities
- 3.8 Regional Performance Highlights
- 3.9 Technology and Industry Transformation
- 3.10 Competitive Landscape Summary
- 3.11 Analyst View and Strategic Implications
Chapter 4 Global Backbone Network Services Market Trends and Developments
- 4.1 Historical Industry Development, 2018-2025
- 4.2 Recent Market Trends and Developments
- 4.3 Demand and Customer Behavior Trends
- 4.4 Technology and Product Innovation
- 4.5 Artificial Intelligence, Automation and Digitalization
- 4.6 Local Manufacturing and Supply Chain Realignment
- 4.7 Industry Partnerships, Mergers and Acquisitions
- 4.8 Sustainability and Circular Economy Developments
- 4.9 Government and Private Sector Investment Trends
- 4.10 Emerging Business Models and Commercialization
- 4.11 Industry Developments and Announcements
Chapter 5 Global Backbone Network Services Market Supply and Demand Analysis
- 5.1 Demand Trend and Consumption Analysis, 2018-2025
- 5.2 Demand Forecast, 2025-2035
- 5.3 Supply Chain Structure and Procurement Trends
- 5.4 Supply-Demand Gap and Bottlenecks
- 5.5 Import Dependence and Sourcing Structure
- 5.6 Regional Supply and Demand Concentration
Chapter 6 Global Backbone Network Services Market Pricing Analysis
- 6.1 Pricing Structure and Measurement
- 6.2 Historical Pricing Trends, 2018-2025
- 6.3 Pricing Outlook, 2025-2035
- 6.4 Pricing by Product and Market Segment
- 6.5 Geographic Pricing Differences
- 6.6 Key Input, Energy, Labor and Logistics Costs
- 6.7 Contract Pricing and Purchasing Models
- 6.8 Pricing Sensitivity and Competitive Positioning
- 6.9 Price, Margin and Profitability Implications
Chapter 7 Global Backbone Network Services Market Dynamics
- 7.1 Market Growth Drivers
- 7.1.1 Demand-Side Drivers
- 7.1.2 Technology and Innovation Drivers
- 7.1.3 Infrastructure and Investment Drivers
- 7.1.4 Regulatory and Policy Drivers
- 7.2 Market Restraints
- 7.2.1 Cost and Affordability Constraints
- 7.2.2 Technology and Adoption Barriers
- 7.2.3 Supply Chain and Operational Constraints
- 7.3 Market Challenges
- 7.3.1 Competitive Pressure and Margin Erosion
- 7.3.2 Skills, Infrastructure and Implementation Gaps
- 7.4 Emerging Market Opportunities
- 7.5 Market Dynamics Impact and Time-Horizon Assessment
Chapter 8 Global Backbone Network Services Value Chain Analysis
- 8.1 Industry Value Chain Overview
- 8.2 Upstream Suppliers and Critical Inputs
- 8.3 Technology and Component Providers
- 8.4 Manufacturing or Service Delivery
- 8.5 Distribution, Channel Partners and Integrators
- 8.6 Downstream Applications and End Users
- 8.7 Value Addition and Profit Pools
- 8.8 Vertical Integration and Outsourcing
- 8.9 Supplier Concentration and Risk
- 8.10 Supply Chain Localization and Resilience
Chapter 9 Global Backbone Network Services Market Regulations and Policies
- 9.1 Relevant Laws, Standards and Compliance Frameworks
- 9.2 Product, Service, Safety and Quality Requirements
- 9.3 Government Policies, Incentives and Subsidies
- 9.4 Imports, Exports and Trade Barriers
- 9.5 Public Procurement and Local Content Requirements
- 9.6 Data Protection, AI and Cybersecurity Compliance
- 9.7 Upcoming Policy Changes and Market Implications
Chapter 10 Global Backbone Network Services Market Hotspots and Opportunities
- 10.1 Market Opportunity Mapping and Growth Hotspots
- 10.2 High-Growth Applications and Customer Groups
- 10.3 Underserved Markets and White-Space Opportunities
- 10.4 Emerging Technology and Product Opportunities
- 10.5 New Capacity and Investment Hotspots
- 10.6 Market Entry and Expansion Opportunities
- 10.7 Distribution and Partnership Opportunities
- 10.8 Near-Term and Long-Term Commercial Potential
- 10.9 Opportunity Attractiveness and Execution Risks
Chapter 11 Global Backbone Network Services Market Outlook, 2025-2035
- 11.1 Market Size and Analysis
- 11.1.1 Revenue (Market Measurement: 2025: USD 98.80 billion → 2035: USD 188.08 billion)
- 11.1.2 Historical Market Size, 2018-2025
- 11.1.3 Base-Year Market Size, 2025
- 11.2 Market Forecast, 2025-2035
- 11.2.1 Revenue Forecast to 2035
- 11.2.2 CAGR and Year-on-Year Growth
- 11.2.3 Incremental Revenue Opportunity
- 11.3 Forecast Assumptions and Scenario Analysis
- 11.3.1 Base-Case Forecast
- 11.3.2 Optimistic and Conservative Scenarios
- 11.3.3 Technology, Pricing and Policy Sensitivities
- 11.4 Market Attractiveness and Growth Outlook
Chapter 12 Global Backbone Network Services Market Segmentation and Outlook
- 12.1 Segmentation Summary and Market Shares, 2025
- 12.2 Largest and Fastest-Growing Segments
- 12.3 By Network Type - Market Size and Forecast, 2025-2035
- 12.3.1 Segment Definition and Scope
- 12.3.2 Historical Market Size, 2018-2025
- 12.3.3 Revenue Forecast, 2025-2035
- 12.3.4 Base-Year Market Share, 2025
- 12.3.5 Segment CAGR and Growth Drivers
- 12.3.6 Subsegment Market Size and Forecast
- 12.3.6.1 Wired Backbone Network
- 12.3.6.2 Wireless Backbone Network
- 12.3.7 Subsegment Pricing and Adoption Trends
- 12.3.8 Leading Suppliers and Competition
- 12.3.9 Regional Demand and Opportunities
- 12.4 By Service Type - Market Size and Forecast, 2025-2035
- 12.4.1 Segment Definition and Scope
- 12.4.2 Historical Market Size, 2018-2025
- 12.4.3 Revenue Forecast, 2025-2035
- 12.4.4 Base-Year Market Share, 2025
- 12.4.5 Segment CAGR and Growth Drivers
- 12.4.6 Subsegment Market Size and Forecast
- 12.4.6.1 Internet Backbone Services
- 12.4.6.2 Intranet Backbone Services
- 12.4.6.3 VPN Backbone Services
- 12.4.7 Subsegment Pricing and Adoption Trends
- 12.4.8 Leading Suppliers and Competition
- 12.4.9 Regional Demand and Opportunities
- 12.5 By End-Use Industry - Market Size and Forecast, 2025-2035
- 12.5.1 Segment Definition and Scope
- 12.5.2 Historical Market Size, 2018-2025
- 12.5.3 Revenue Forecast, 2025-2035
- 12.5.4 Base-Year Market Share, 2025
- 12.5.5 Segment CAGR and Growth Drivers
- 12.5.6 Subsegment Market Size and Forecast
- 12.5.6.1 Telecommunication
- 12.5.6.2 Enterprise and Cloud
- 12.5.6.3 Government
- 12.5.6.4 Education
- 12.5.6.5 Healthcare
- 12.5.7 Subsegment Pricing and Adoption Trends
- 12.5.8 Leading Suppliers and Competition
- 12.5.9 Regional Demand and Opportunities
- 12.6 Segment Growth Comparison
- 12.7 Segment Attractiveness and Priority Matrix
Chapter 13 Global Backbone Network Services End-Use and Application Market Outlook
- 13.1 End-Use Industry and Customer Demand Structure
- 13.2 Leading Applications and Customer Groups
- 13.3 End-Use Market Size, Share and Forecast
- 13.4 Major End-Use Industry Deep Dives
- 13.4.1 Customer Requirements and Use Cases
- 13.4.2 Demand and Replacement Cycles
- 13.4.3 Technical and Regulatory Considerations
- 13.4.4 Purchasing and Procurement Models
- 13.4.5 Leading Vendors and Distribution Channels
- 13.4.6 Forecast and Commercial Opportunities
- 13.5 Emerging Applications and Cross-Segment Demand
- 13.6 End-Use Industry Investment Priorities
Chapter 14 Global Backbone Network Services Geographic Market Outlook, 2025-2035
- 14.1 Regional Market Size and Share, 2025
- 14.2 Regional Market Forecast, 2025-2035
- 14.3 Regional Pricing, Production and Demand Differences
- 14.4 North America
- 14.4.1 United States
- 14.4.2 Canada
- 14.4.3 Mexico
- 14.5 Europe
- 14.5.1 Germany
- 14.5.2 France
- 14.5.3 Italy
- 14.5.4 United Kingdom
- 14.5.5 Spain
- 14.5.6 Poland
- 14.5.7 Russia
- 14.5.8 Netherlands
- 14.5.9 Belgium
- 14.5.10 Sweden
- 14.5.11 Denmark
- 14.5.12 Norway
- 14.5.13 Rest of Europe
- 14.6 Asia Pacific
- 14.6.1 China
- 14.6.2 India
- 14.6.3 Japan
- 14.6.4 South Korea
- 14.6.5 Thailand
- 14.6.6 Indonesia
- 14.6.7 Vietnam
- 14.6.8 Malaysia
- 14.6.9 Australia
- 14.6.10 Rest of Asia Pacific
- 14.7 Latin America
- 14.7.1 Brazil
- 14.7.2 Argentina
- 14.7.3 Colombia
- 14.7.4 Chile
- 14.7.5 Rest of Latin America
- 14.8 Middle East
- 14.8.1 Saudi Arabia
- 14.8.2 United Arab Emirates
- 14.8.3 Turkey
- 14.8.4 Israel
- 14.8.5 Iran
- 14.8.6 Rest of the Middle East
- 14.9 Africa
- 14.9.1 South Africa
- 14.9.2 Egypt
- 14.9.3 Nigeria
- 14.9.4 Morocco
- 14.9.5 Rest of Africa
- 14.10 Regional Investment, Policy and Supply Chain Differences
- 14.11 Regional Competitive Landscape
- 14.12 Geographic Growth Hotspots
Chapter 15 Global Backbone Network Services Technology, Innovation and Sustainability Outlook
- 15.1 Technology Landscape and Maturity
- 15.2 Product, Process and Service Innovation
- 15.3 AI, Automation and Digital Tools in the Industry
- 15.4 Technology Adoption and Performance Benchmarking
- 15.5 Innovation Pipeline and R&D Investment
- 15.6 Energy Efficiency and Resource Management
- 15.7 Sustainability, Recycling and Circularity
- 15.8 Technology Roadmap, 2025-2035
- 15.9 Risks of Obsolescence and Technology Substitution
Chapter 16 Global Backbone Network Services Market Key Strategic Imperatives
- 16.1 Growth and Market Entry Priorities
- 16.2 High-Return Products and Segments
- 16.3 Pricing, Profitability and Cost Optimization
- 16.4 Technology Investment and Product Differentiation
- 16.5 Supply Chain Localization and Resilience
- 16.6 Distribution and Customer Acquisition
- 16.7 Partnership, Acquisition and Capacity Strategy
- 16.8 Regional Expansion Priorities
- 16.9 Short-, Medium- and Long-Term Actions
Chapter 17 Competition Outlook
- 17.1 Industry Competition Characteristics
- 17.2 Market Structure and Concentration
- 17.3 Market Share and Competitive Positioning, 2025
- 17.4 Company-Wise Revenue and Product Benchmarking
- 17.5 Production and Service Capacity Benchmarking
- 17.6 Technology, Pricing and Differentiation
- 17.7 Regional Footprint and Distribution Strength
- 17.8 Mergers, Acquisitions and Strategic Alliances
- 17.9 New Entrants and Competitive Threats
- 17.10 Porter's Five Forces and Industry Attractiveness
- 17.11 Competitive Outlook, 2025-2035
Chapter 18 Company Profiles
- 18.1 Company Coverage and Selection Criteria
- 18.2 Lumen Technologies
- 18.2.1 Business Description
- 18.2.2 Company Ownership and Geographic Presence
- 18.2.3 Product and Service Portfolio
- 18.2.4 Manufacturing and Operating Footprint
- 18.2.5 Financial Performance and Investment
- 18.2.6 Market Share and Competitive Position
- 18.2.7 Technology and Innovation Capabilities
- 18.2.8 Strategic Alliances or Partnerships
- 18.2.9 Recent Developments
- 18.2.10 Growth Strategy and Outlook
- 18.3 AT&T Inc.
- 18.4 Verizon Communications Inc. (Verizon Business)
- 18.5 Zayo Group
- 18.6 Arelion
- 18.7 Cogent Communications
- 18.8 NTT DATA Group (NTT Global IP Network)
- 18.9 Tata Communications
- 18.10 Orange S.A. (Orange Wholesale)
- 18.11 Telefonica S.A. (Telefonica Global Solutions)
- 18.12 Vodafone Group Plc
- 18.13 China Telecom Global
- 18.14 Other Relevant Market Participants
Note: Every listed company is profiled on the structure shown under the first company. The company list is preliminary and may change based on research findings, market developments, data availability and client requirements.
Chapter 19 Disclaimer
- 19.1 Research and Forecast Disclaimer
- 19.2 Data Source and Estimation Limitations
Note: The depth of individual sections depends on data availability for this market. Volume, capacity, trade and other unit-based metrics are included where applicable.

