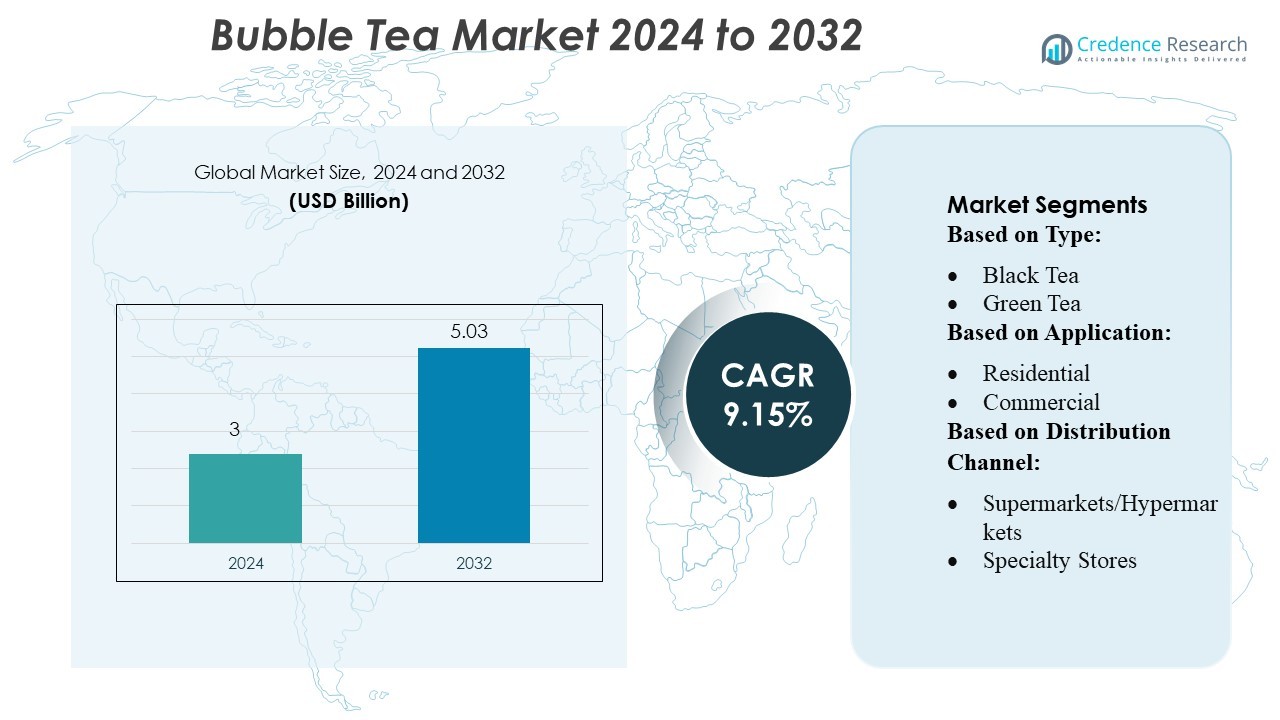
Home » Food & Beverage » Bubble Tea Market

Bubble Tea Market By Application (On-the-Go Refreshment, Leisure and Socializing, Special Occasions and Celebrations, Home and DIY, Health and Wellness, Office and Corporate), By Type (Classic Bubble Tea, Fruit-Based Bubble Tea, Cream-Flavored Bubble Tea, Special-Tea Blends, Customized Bubble Tea, Special and Limited Editions) – Size, Share, Growth, Trends and Segment Forecasts to 2016-2030

Price: $4999

Published: | Report ID: 21738 | Report Format : PDF

Market Insights

  • The Bubble Tea market has witnessed remarkable revenue growth, escalating from USD 2,931.45 million in 2022 to USD 5,184.53 million in 2030.
  • This growth trajectory is underpinned by a remarkable Compound Annual Growth Rate (CAGR) of 8.49% projected from 2023 to 2030, signifying sustained and robust expansion.
  • The market’s upward trajectory reflects its economic resilience and consumer appeal, making Bubble Tea a thriving industry.
  • Bubble Tea’s popularity is not limited to a single region but extends globally, contributing to its impressive revenue figures.

Bubble Tea Market


Executive Summary:

The Bubble Tea market, characterized by its diverse flavors, textures, and global appeal, is on a significant growth trajectory. With its unique combination of ingredients and the rising popularity among millennials, this market has witnessed impressive expansion, especially in Asia Pacific. Black Tea remains a favored choice among consumers, and the demand for organic and innovative Bubble Tea products is rising.

Market Definition:

The Bubble Tea Market encompasses the global industry dedicated to manufacturing, distributing, and enjoying Bubble Tea—a unique beverage known for its tantalizing flavors, chewy tapioca pearls, and the joy of ‘popping bubbles.’ This market serves a wide demographic, appealing to traditional tea enthusiasts and adventurous flavor seekers.

Bubble Tea Market Overview:

The Bubble Tea market has transcended geographical boundaries, experiencing significant expansion on a global scale. From its origins in Asia, Bubble Tea has captivated consumers’ taste buds worldwide, contributing to its impressive revenue figures.

The market’s growth can be attributed to the evolving preferences of consumers who seek refreshments and an experiential and customizable beverage. Bubble Tea fulfills these preferences with its variety of flavors and fun textures, resulting in robust revenue generation.

The market’s dynamism is evident through innovation in Bubble Tea recipes and presentations. Beverage makers are constantly introducing new flavors, combinations, and toppings, catering to the adventurous spirit of consumers.

Design Element 2

Access crucial information at unmatched prices!

Request your free sample report today & start making informed decisions powered by Credence Research!

Download Free Sample

CTA Design Element 3

Market Segmentation

Segmentation by Application 

  • This application segment caters to busy individuals seeking a quick and refreshing drink. On-the-Go Bubble Tea outlets provide a convenient solution for consumers looking to quench their thirst while on the move. These locations often offer a streamlined menu with popular flavors, making it easy for customers to grab a Bubble Tea for their daily activities. This segment targets the fast-paced lifestyle of urban populations and commuters.
  • The Leisure and Socializing segment focuses on creating spaces where consumers can relax, socialize, and enjoy their Bubble Tea more leisurely. Bubble Tea cafes and lounges fall under this category, providing cozy environments where friends can gather, students can study, and professionals can unwind. These establishments often offer an extensive menu, encouraging customers to linger and savor their drinks while engaging in conversations or enjoying free Wi-Fi.
  • Bubble Tea has found its way into special occasions and celebrations. Whether it’s a birthday party, wedding reception, or corporate event, this application segment caters to the demand for catering services that provide Bubble Tea for gatherings. These services offer bulk orders, customizable flavors, and sometimes even Bubble Tea-themed decor to enhance the festive atmosphere.
  • The Home and DIY segment has gained traction as more consumers embrace making Bubble Tea at home. This application segment encompasses selling Bubble Tea kits, pre-made ingredients, and accessories for crafting the beverage at home. It appeals to DIY enthusiasts, families looking for fun activities, and those who prefer the convenience of enjoying Bubble Tea from the comfort of their homes.
  • Recognizing the growing demand for healthier beverage options, the Health and Wellness application segment focuses on providing Bubble Tea with nutritious and organic ingredients. These Bubble Tea outlets emphasize using fresh fruits, herbal infusions, and low-sugar options to cater to health-conscious consumers. Additionally, they may offer dairy-free or gluten-free Bubble Tea options to accommodate various dietary preferences.
  • The Office and Corporate application segment targets workplaces and business settings. Many companies now provide Bubble Tea as employee perks or during meetings and events. This segment offers corporate catering services, subscription packages, and bulk orders to meet the demand for Bubble Tea in professional settings. It aims to boost employee morale and foster a positive work environment.

Segmentation by Type:

  • Classic Bubble Tea, also known as “Original” or “Traditional” Bubble Tea, remains a timeless favorite among consumers. It typically consists of a strong tea base, often black or green tea, combined with milk (or non-dairy alternatives) and sweeteners, such as sugar or honey. Classic Bubble Tea features the iconic tapioca pearls at the bottom, creating a delightful contrast of flavors and textures.
  • The Fruit-Based Bubble Tea category caters to those who prefer refreshing and fruity flavors. It includes a wide range of fruit-infused teas, with options like strawberry, mango, passion fruit, and lychee. These teas are often mixed with fruit juices or purees, creating a vibrant and tropical taste sensation. Fruit-based Bubble Tea is known for its sweet and tangy profile, making it a hit during the hot summer.
  • Cream-flavored Bubble Tea offers a luscious and velvety experience. It involves using creamers or flavored cream powders to enhance the tea’s texture and taste. Varieties within this category may include caramel cream, vanilla cream, or coconut cream Bubble Tea. Cream-flavored Bubble Tea appeals to those seeking a smoother and more indulgent treat.
  • This category encompasses unique and innovative tea blends beyond traditional offerings. Special-Tea Bubble Teas may feature exotic ingredients like taro, lavender, rose petals, or coffee. These blends are often characterized by distinct and memorable flavors, appealing to adventurous palates.
  • Many Bubble Tea establishments now offer customizable options, allowing customers to create unique combinations. This type of Bubble Tea empowers consumers to choose their tea base, flavor, sweetness level, and toppings. Customization caters to individual preferences and encourages creativity in crafting the perfect Bubble Tea.
  • Bubble Tea shops often introduce seasonal and limited-edition offerings to keep the menu fresh and exciting. These can include holiday-themed Bubble Teas, special collaborations with other brands, or unique flavors available for a limited time. Seasonal and limited editions create buzz and anticipation among customers.

Segmentation by End Users 

  • The youth and millennial demographic form a significant portion of Bubble Tea consumers. This group is drawn to Bubble Tea’s trendy and Instagram-worthy aspects, including its vibrant colors, unique toppings, and customizable options. Many Bubble Tea shops create appealing drinks to cater to this demographic’s desire for aesthetically pleasing and shareable experiences.
  • In response to the growing trend toward health and wellness, Bubble Tea shops have introduced healthier and lighter options. These cater to health-conscious consumers who seek lower-calorie, reduced-sugar, or dairy-free Bubble Teas. Such variations often incorporate fresh fruit juices, herbal infusions, and natural sweeteners to align with health-focused lifestyles.
  • Working professionals, particularly those in urban areas, often turn to Bubble Tea as a quick and energizing beverage during the workday. It provides a convenient pick-me-up with tea caffeine and a sweet touch. Some Bubble Tea shops offer delivery or pickup services, making it accessible to office-goers.
  • Families with children are another key segment in the Bubble Tea market. Bubble Tea shops often offer kid-friendly versions with milder flavors and less caffeine. Children enjoy the playful aspect of Bubble Tea, including chewing on the tapioca pearls and sipping through oversized straws.
  • For foodies and culinary enthusiasts, Bubble Tea represents an exciting avenue for exploration. They want unique flavors, unusual combinations, and limited-time offerings. This segment seeks out Bubble Tea shops known for their innovative and unconventional creations.
  • Cultural enthusiasts and individuals interested in global cuisine are drawn to Bubble Tea to experience Asian culture. Bubble Tea has its roots in Taiwan and has become an international sensation. Those curious about different cultures often seek authentic Bubble Tea shops to taste Taiwanese culinary traditions.
  • Bubble Tea has a strong presence near colleges and universities. Students appreciate the affordable options and the social aspect of enjoying Bubble Tea with friends. Some academic communities even organize Bubble Tea clubs or events centered around this beloved beverage.
  • Bubble Tea vendors frequently shop at festivals, fairs, and events. Attendees looking for unique and refreshing drinks often gravitate towards these stalls. Bubble Tea complements the festive atmosphere and offers attendees a memorable and enjoyable beverage option.
  • Domestic and international tourists often seek out Bubble Tea as part of their culinary exploration during their travels. Bubble Tea shops can become landmarks and attractions in cities known for their diverse food scenes. Tourists enjoy experiencing the local twist on this global phenomenon.

Segmentation by Region:

  1. Asia Pacific:
  • Asia Pacific asserted its dominance in the Bubble Tea market, holding the largest market share, which exceeded 50% in 2022.
  • The origins of Bubble Tea in Taiwan have contributed significantly to the region’s strong market presence. Taiwan remains a hub for innovative Bubble Tea creations, influencing the global market.
  • China, as one of the largest consumers of Bubble Tea, contributed substantially to the Asia Pacific’s market share. The vast and diverse Chinese market has embraced Bubble Tea with fervor.
  • South Korea’s vibrant street food culture and its fusion of flavors have further propelled the Bubble Tea trend in the region. South Korean consumers embrace both traditional and innovative Bubble Tea offerings.
  1. North America:
  • North America emerged as the second-largest market for Bubble Tea in 2022, signaling the beverage’s global appeal beyond its Asian origins.
  • The North American market showcases the versatility of Bubble Tea, appealing to diverse demographics. It resonates with youth, working professionals, and individuals seeking unique beverage experiences.
  • Urban areas, particularly, have seen a surge in Bubble Tea shops, making it a convenient and trendy option for city dwellers.
  • The North American Bubble Tea scene often blends traditional Asian flavors with local tastes, resulting in unique and fusion-inspired Bubble Tea offerings.
  1. Europe, Latin America, and Other Regions:
  • While Asia Pacific and North America dominate, other regions like Europe and Latin America are witnessing the emergence of Bubble Tea as a popular beverage.
  • Consumers interested in exploring global cuisines in Europe are increasingly drawn to Bubble Tea as an exciting and culturally diverse option.
  • Latin American countries are also starting to embrace Bubble Tea, with a growing number of shops offering a variety of flavors and options.
  • Beyond these major regions, Bubble Tea is making inroads into other parts of the world, with entrepreneurs and enthusiasts introducing the beverage to new markets.

The Bubble Tea market exhibits a diverse regional landscape, with varying market shares and growth rates across different geographies. In 2022, Asia Pacific held a substantial market share of over 50%, underscoring the immense popularity of Bubble Tea in countries like Taiwan, China, and South Korea. Furthermore, Asia Pacific is poised to maintain its dominance, with a projected Compound Annual Growth Rate (CAGR) exceeding 13.5%, indicating the region’s rapid market expansion.

Europe, with a remarkable CAGR of approximately 11.5%, is another region experiencing significant growth in the Bubble Tea market. The continent has actively embraced Bubble Tea, fostering its adoption in various countries. This growth trajectory will continue during the forecast period, highlighting Europe’s growing affinity for this beverage.

While holding a share of over 25% in the market, North America also presents substantial growth opportunities. The region’s market presence underscores the global appeal of Bubble Tea beyond its Asian origins. With ongoing adoption and increasing consumer interest, North America is set to witness significant growth in the Bubble Tea market in the coming years.

With a share of around 3.80%, Latin America contributes to the market, primarily in pharmaceutical and academic research. While representing a smaller market share, Latin America is steadily growing in its adoption of Bubble Tea, reflecting its global reach.

The Middle East and Africa region, with a CAGR of 7.5%, is experiencing gradual growth in the Bubble Tea market. This growth aligns with the region’s expanding healthcare and research infrastructure, contributing to the market’s development. While the growth rate may be comparatively moderate, the region holds significant potential, with increasing investments in research and healthcare initiatives.

Bubble Tea Market Regional Analysis

What Are the Main Drivers of the Bubble Tea Market?

The main drivers of the Bubble Tea Market include the rising popularity of Bubble Tea, the millennial population, and strong black tea growth.

What Are The Major Challenges Faced By the Bubble Tea Market?

The Bubble Tea Market’s major challenges include the need for knowledge and economic turbulence.

What Are The Growth Opportunities In the Bubble Tea Market?

The growth opportunities in the Bubble Tea Market include the increasing demand for highly nutritious organic products and the development of new products.

Market Drivers:

Several factors drive the Bubble Tea market. The following are the key drivers of the Bubble Tea market:

Rising in Popularity:

The Bubble Tea phenomenon has taken the global beverage industry by storm, and its surge in popularity is nothing short of remarkable. This surge can be attributed to several factors. Firstly, Bubble Tea offers a captivating fusion of flavors and textures, creating a delightful sensory experience for consumers. Combining chewy tapioca pearls, tea bases, and fruit or milk flavors results in a unique and enjoyable beverage that keeps customers returning for more.

Additionally, the novelty of the “popping bubbles” sensation, which occurs when sipping the tea through a wide straw, adds an element of fun and surprise to the drinking experience. This playfulness appeals to younger and older consumers, making Bubble Tea a beverage for all ages. Its ability to continuously innovate and introduce new flavors and combinations also intrigues consumers, contributing to its sustained popularity.

Millennial Population Growth:

The burgeoning Millennial population has significantly influenced the Bubble Tea market’s growth trajectory. Millennials, known for their adventurous and diverse lifestyles, constantly seek novel and Instagram-worthy experiences. Bubble Tea perfectly aligns with their preferences for unique and experiential beverages. Its vibrant colors, creative presentations, and customizable options satisfy Millennials’ desire for personalization and self-expression.

Moreover, the social aspect of enjoying Bubble Tea with friends or sharing photos on social media platforms further fuels its popularity among this demographic. Millennials’ willingness to try new things and their appreciation for global culinary trends have made them enthusiastic adopters of Bubble Tea, contributing significantly to its expanding consumer base.

Strong Black Tea Growth:

While Bubble Tea offers a wide range of flavors, it’s noteworthy that the growth of the Black Tea segment has been particularly strong. This phenomenon underscores the enduring appeal of black tea’s classic, robust taste. Black tea’s natural flavors and caffeine content make it an ideal base for Bubble Tea, providing a balanced backdrop to the sweetness and fruitiness of various flavor additions.

The preference for Black Tea can be attributed to its familiarity and association with traditional tea-drinking cultures. It appeals to those who seek a harmonious blend of the conventional and the contemporary in their beverage choices. The availability of different black tea varieties, such as Earl Grey and Assam, in Bubble Tea establishments further enhances the diversity of offerings, ensuring that there’s a black tea-based Bubble Tea to suit every palate.

Market Limitations:

The Bubble Tea market faces some challenges that may hinder its growth. These include the following:

Lack of Knowledge:

One of the notable limitations facing the Bubble Tea market is the pervasive need for more awareness and knowledge about the beverage among certain consumer groups. This limitation primarily stems from the fact that Bubble Tea originated in East Asia and initially gained popularity within Asian communities before expanding globally. Consequently, individuals outside these cultural spheres may remain relatively uninformed about the beverage’s diverse offerings and preparation methods.

To address this challenge, effective marketing and educational initiatives are crucial. Bubble Tea vendors and the industry as a whole must invest in comprehensive campaigns to demystify the concept, educate potential consumers about the range of flavors, tea bases, and toppings available, and highlight the delightful experience of sipping Bubble Tea through wide straws, where the unique “popping bubbles” sensation adds a layer of enjoyment.

Bridging this knowledge gap introduces new consumers to the product and fosters a deeper appreciation for the beverage’s cultural origins and evolution into a global sensation.

Economic Turbulence:

The second limitation the Bubble Tea market faces is the economic turbulence caused by the COVID-19 pandemic, which resulted in significant fluctuations in consumer spending patterns. The pandemic-induced disruptions, including lockdowns, social distancing measures, and economic uncertainty, led to changes in consumer behavior. Many consumers prioritized essential purchases over discretionary spending, affecting the sales of non-essential items such as Bubble Tea.

However, it’s important to note that the Bubble Tea market demonstrated remarkable resilience and adaptability during these challenging times. Businesses in the industry quickly pivoted to offer takeout and delivery options, ensuring that consumers could still enjoy their favorite beverages safely from the comfort of their homes. Innovative marketing strategies, such as online promotions and loyalty programs, helped sustain customer engagement.

As the world gradually recovers from the pandemic’s impact, the Bubble Tea market is poised to regain momentum, with consumers returning to their favorite tea shops and embracing the beverage again.

Market Opportunities:

The Bubble Tea market offers significant growth opportunities. These include the following:

Increasing Demand for Highly Nutritious Organic Products:

The modern consumer landscape is witnessing a significant shift towards health-conscious choices, with a growing preference for nutritious and organic food and beverages. This evolving trend presents a promising opportunity for the Bubble Tea market to tap into the demand for healthier options. Bubble Tea establishments can consider developing a range of highly nutritious organic products to capitalize on this opportunity.

These offerings could incorporate organic tea bases, natural fruit extracts, and wholesome toppings like chia seeds, aloe vera, or fresh fruit chunks. By embracing organic ingredients and emphasizing their health benefits, Bubble Tea can cater to a segment of consumers who seek beverages that not only tantalize their taste buds but also align with their wellness goals.

Promoting the nutritional value and health advantages of organic Bubble Tea can position it as a guilt-free indulgence, attracting health-conscious individuals and contributing to the overall market expansion.

Shape Your Report to Specific Countries or Regions & Enjoy 30% Off!

Development of New Products:

Innovation is the lifeblood of the food and beverage industry, and the Bubble Tea market is no exception. Embracing a culture of continuous innovation in flavor combinations, ingredients, and serving methods presents a compelling opportunity for the Bubble Tea market to remain dynamic and capture the interest of a diverse customer base. To seize this opportunity effectively, Bubble Tea vendors can explore various avenues.

They can experiment with novel flavor pairings, such as exotic fruit fusions, herbal infusions, or seasonal specialties, to entice adventurous palates. Additionally, introducing unique textures and garnishes, like edible flowers, artisanal syrups, or innovative bubble options, can create a sense of excitement and anticipation among customers. Furthermore, developing new serving methods, such as customizable Bubble Tea kits for at-home preparation or eco-friendly packaging solutions, can cater to evolving consumer preferences for convenience and sustainability.

By consistently offering fresh, inventive, and Instagram-worthy Bubble Tea experiences, the market can retain its loyal following and expand its customer base, appealing to both existing enthusiasts and newcomers seeking the next delightful sip.

Key Highlights of the Report:

The Bubble Tea market offers a variety of types to cater to diverse consumer preferences. Among these, Black Tea emerged as the undeniable leader, capturing a market share of over 50% in 2022. Its popularity is attributed to its classic and rich flavor profile, which resonates with traditionalists and those seeking a familiar taste.

When it comes to flavor, the Fruits segment reigns supreme, tantalizing the taste buds of a significant consumer base. Instilling fruity flavors into Bubble Tea has been a resounding success, offering a refreshing and vibrant alternative to more conventional beverage choices.

Tapioca, a unique and essential component of Bubble Tea, significantly shaped the market landscape. In 2022, it accounted for approximately 20% of the market share. With their delightfully chewy texture, Tapioca pearls add an extra layer of enjoyment to the drinking experience, making them a sought-after inclusion in Bubble Tea concoctions.

In the realm of sales channels, Standalone Stores emerged as the dominant force, accounting for the largest share. These dedicated Bubble Tea outlets offer consumers an immersive experience, allowing them to explore a wide range of flavors, customize their orders, and enjoy the ambiance of specialty stores. The appeal of Standalone Stores goes beyond just the beverage itself; it’s about the entire Bubble Tea experience.

Competitive Landscape

Key Players:

Several key players contribute to its growth and innovation in the Bubble Tea market. Some of the major players in the market and their market share are as follows:

  • Bubble Tea Supply, Inc.
  • Boba Luca USA, Inc.
  • Fokus, Inc.
  • Cha Time.
  • Tiger Sugar.
  • Tapioca Express.
  • Troika JC.
  • Gong Cha.
  • Lollicup USA, Inc.
  • Kung Fu Tea.

These companies focus on technological innovation, product customization, and expanding their global presence to maintain their competitive edge in the market. The market’s competitive landscape is expected to intensify as demand for Bubble Tea rises.

Recent Development

In September 2022, Chatime Australia marked a significant milestone with the grand opening of its 150th T-brewery in Mildura. The company expressed deep gratitude for the dedication and enthusiasm of its latest business partners, the Pratt family, including Jack, Charlie, Alicia, Ray, and their dedicated team.

Summary of Key Findings:

  • Bubble Tea has been rising in popularity worldwide, offering a unique combination of flavors and textures.
  • With its dynamic and diverse lifestyle, the growing Millennial population has been a driving force behind the increasing demand for Bubble Tea.
  • The growth of the Black Tea segment in the Bubble Tea market signifies the enduring appeal of this classic flavor among consumers.
  • These include a lack of knowledge about Bubble Tea among certain consumer groups and economic turbulence brought on by the COVID-19 pandemic.

Future Outlook:

  • The Bubble Tea market is expected to maintain its growth trajectory, driven by increasing consumer interest and expanding global reach.
  • Meeting the demand for highly nutritious and organic Bubble Tea products will be a key focus. Health-conscious consumers will have a wider selection of options, catering to their preferences for wholesome beverages.
  • Continuous innovation in flavors, ingredients, and presentation will remain vital. Bubble Tea businesses will invest in creating new and exciting combinations to capture consumer attention and loyalty.
  • Overcoming the limitation of lack of knowledge will involve strategic marketing campaigns and educational initiatives. This will help demystify Bubble Tea, making it more accessible to a broader audience.
  • The industry has demonstrated resilience during economic turbulence, and this adaptability will continue to serve it well. Strategies for adapting to changing consumer spending patterns will be essential.
  • The global appeal of Bubble Tea beyond its Asian origins will persist. North America and Europe, in particular, will witness significant growth, showcasing the beverage’s universal charm.
  • Embracing sustainable practices in packaging and sourcing will align with evolving consumer values, contributing to the long-term success of Bubble Tea brands.
  • Bubble Tea’s ability to blend cultural influences and adapt to local tastes will fuel its growth in diverse regions, creating unique beverage variations.

Market Segmentation

  • By Application
    • On-the-Go Refreshment
    • Leisure and Socializing
    • Special Occasions and Celebrations
    • Home and DIY
    • Health and Wellness
    • Office and Corporate
  • By Type
    • Classic Bubble Tea
    • Fruit-Based Bubble Tea
    • Cream-Flavored Bubble Tea
    • Special-Tea Blends
    • Customized Bubble Tea
    • Special and Limited Editions
  • By End-Users
    • Youth and Millennials
    • Health-Conscious Consumers
    • Working Professionals
    • Families and Children
    • Foodies and Culinary Explorers
    • Cultural Enthusiasts
    • Students and Academic Communities
    • Event-Goers and Festivals
    • Tourists
  • By Price Range
    • Low
    • Medium
    • High
  • By Region
    • North America
      • Canada
      • Mexico
    • Europe
      • Germany
      • France
      • UK.
      • Italy
      • Spain
      • Rest of Europe
    • Asia Pacific
      • China
      • Japan
      • India
      • South Korea
      • South-east Asia
      • Rest of Asia Pacific
    • Latin America
      • Brazil
      • Argentina
      • Rest of Latin America
    • Middle East & Africa
      • GCC Countries
      • South Africa
      • Rest of Middle East and Africa

Adjacent Markets

In the Bubble Tea market, several adjacent markets have high revenue growth opportunities. The key adjacent markets for the Bubble Tea market are:

Report Report Report
Creamer Market Sweetener Market Tapioca Pearls Market
Black Tea Market Green Tea Market Oolong Tea Market
White Tea Market

CHAPTER NO. 1 : INTRODUCTION 23

1.1. Report Description 23

1.1.1. Purpose of the Report 23

1.1.2. USP & Key Offerings 23

1.2. Key Benefits for Stakeholders 23

1.3. Target Audience 24

1.4. Report Scope 25


CHAPTER NO. 2 : EXECUTIVE SUMMARY 27

2.1. Bubble Tea Market Snapshot 27

2.2. Global Bubble Tea Market, 2017 – 2022 (USD Million) 28


CHAPTER NO. 3 : IMPACT ANALYSIS OF COVID 19 & RUSSIA-UKRAINE WAR ON BUBBLE TEA MARKET 29

3.1. Impact Assessment of COVID-19 Pandemic, By Region 29

3.1.1. Supply chain disruptions 29

3.1.2. Demand fluctuations 29

3.1.3. Shift in product mix 29

3.1.4. Reduced industrial activity 29

3.1.5. Temporary disruptions and delays 29

3.1.6. Shift in focus towards essential services 29

3.2. Russia-Ukraine War Impacts 30

3.2.1. Uncertainty and economic instability 30

3.2.2. Supply chain disruptions 30

3.2.3. Regional market shifts 30

3.2.4. Shift in government priorities 30


CHAPTER NO. 4 : BUBBLE TEA MARKET – INDUSTRY ANALYSIS 31

4.1. Introduction 31

4.2. Market Drivers 32

4.2.1. Driving Factor 1 Analysis 32

4.2.2. Driving Factor 2 Analysis 33

4.3. Market Restraints 34

4.3.1. Restraining Factor Analysis 34

4.4. Market Opportunities 35

4.4.1. Market Opportunity Analysis 35

4.5. Porter’s Five Forces Analysis 36

4.6. Value Chain Analysis 37

4.7. Buying Criteria 38


CHAPTER NO. 5 : ANALYSIS COMPETITIVE LANDSCAPE 39

5.1. Company Market Share Analysis – 2022 39

5.1.1. Global Bubble Tea Market: Company Market Share, by Revenue2022 39

5.1.2. Global Bubble Tea Market: Top 6 Company Market Share, by Revenue2022 39

5.1.3. Global Bubble Tea Market: Top 3 Company Market Share, by Revenue2022 40

5.1. Global Bubble Tea Market Company Revenue Market Share, 2022 41

5.2. Company Assessment Metrics, 2022 42

5.2.1. Stars 42

5.2.2. Emerging Leaders 42

5.2.3. Pervasive Players 42

5.2.4. Participants 42

5.3. Start-ups /SMEs Assessment Metrics, 2022 42

5.3.1. Progressive Companies 42

5.3.2. Responsive Companies 42

5.3.3. Dynamic Companies 42

5.3.4. Starting Blocks 42

5.4. Strategic Developments 43

5.4.1. Acquisitions & Mergers 43

5.4.2. New Product Launch 43

5.4.3. Regional Expansion 43

5.5. Key Players Product Matrix 44


CHAPTER NO. 6 : PESTEL & ADJACENT MARKET ANALYSIS 45

6.1. PESTEL 45

6.1.1. Political Factors 45

6.1.2. Economic Factors 45

6.1.3. Social Factors 45

6.1.4. Technological Factors 45

6.1.5. Environmental Factors 45

6.1.6. Legal Factors 45

6.2. Adjacent Market Analysis 45


CHAPTER NO. 7 : BUBBLE TEA MARKET – BY TYPE SEGMENT ANALYSIS 46

7.1. Bubble Tea Market Overview, by Type Segment 46

7.1.1. Bubble Tea Market Revenue Share, By Type, 2022 & 2030 47

7.1.2. Bubble Tea Market Attractiveness Analysis, By Type 48

7.1.3. Incremental Revenue Growth Opportunity, by Type, 2023 – 2030 48

7.1.4. Bubble Tea Market Revenue, By Type, 2017, 2022, 2026 & 2030 49

7.2. Black Tea 50

7.2.1. Global Black Tea Bubble Tea Market Revenue, By Region, 2017 – 2022 (USD Million) 51

7.2.2. Global Black Tea Bubble Tea Market Revenue, By Region, 2017 – 2022 (USD Million) 51

7.3. Green Tea 52

7.3.1. Global Green Tea Bubble Tea Market Revenue, By Region, 2017 – 2022 (USD Million) 53

7.3.2. Global Green Tea Bubble Tea Market Revenue, By Region, 2017 – 2022 (USD Million) 53

7.4. 54

7.4.1. Global  Bubble Tea Market Revenue, By Region, 2017 – 2022 (USD Million) 55

7.4.2. Global  Bubble Tea Market Revenue, By Region, 2017 – 2022 (USD Million) 55

7.5. White Tea 56

7.5.1. Global White Tea Bubble Tea Market Revenue, By Region, 2017 – 2022 (USD Million) 57

7.5.2. Global White Tea Bubble Tea Market Revenue, By Region, 2017 – 2022 (USD Million) 57

7.6. Others 58

7.6.1. Global Others Bubble Tea Market Revenue, By Region, 2017 – 2022 (USD Million) 59

7.6.2. Global Others Bubble Tea Market Revenue, By Region, 2017 – 2022 (USD Million) 59


CHAPTER NO. 8 : BUBBLE TEA MARKET – BY FLAVOR SEGMENT ANALYSIS 60

8.1. Bubble Tea Market Overview, by Flavor Segment 60

8.1.1. Bubble Tea Market Revenue Share, By Flavor, 2022 & 2030 61

8.1.2. Bubble Tea Market Attractiveness Analysis, By Flavor 62

8.1.3. Incremental Revenue Growth Opportunity, by Flavor, 2023 – 2030 62

8.1.4. Bubble Tea Market Revenue, By Flavor, 2017, 2022, 2026 & 2030 63

8.2. Classic 64

8.2.1. Global Classic Bubble Tea Market Revenue, By Region, 2017 – 2022 (USD Million) 65

8.2.2. Global Classic Bubble Tea Market Revenue, By Region, 2017 – 2022 (USD Million) 65

8.3. Fruit 66

8.3.1. Global Fruit Bubble Tea Market Revenue, By Region, 2017 – 2022 (USD Million) 67

8.3.2. Global Fruit Bubble Tea Market Revenue, By Region, 2017 – 2022 (USD Million) 67

8.4. Chocolate 68

8.4.1. Global Chocolate Bubble Tea Market Revenue, By Region, 2017 – 2022 (USD Million) 69

8.4.2. Global Chocolate Bubble Tea Market Revenue, By Region, 2017 – 2022 (USD Million) 69

8.5. Coffee 70

8.5.1. Global Coffee Bubble Tea Market Revenue, By Region, 2017 – 2022 (USD Million) 71

8.5.2. Global Coffee Bubble Tea Market Revenue, By Region, 2017 – 2022 (USD Million) 71

8.6. Others 72

8.6.1. Global Others Bubble Tea Market Revenue, By Region, 2017 – 2022 (USD Million) 73

8.6.2. Global Others Bubble Tea Market Revenue, By Region, 2017 – 2022 (USD Million) 73


CHAPTER NO. 9 : BUBBLE TEA MARKET – BY COMPONENT SEGMENT ANALYSIS 74

9.1. Bubble Tea Market Overview, by Component Segment 74

9.1.1. Bubble Tea Market Revenue Share, By Component, 2022 & 2030 75

9.1.2. Bubble Tea Market Attractiveness Analysis, By Component 76

9.1.3. Incremental Revenue Growth Opportunity, by Component, 2023 – 2030 76

9.1.4. Bubble Tea Market Revenue, By Component, 2017, 2022, 2026 & 2030 77

9.2. Flavor 78

9.2.1. Global Flavor Bubble Tea Market Revenue, By Region, 2017 – 2022 (USD Million) 79

9.2.2. Global Flavor Bubble Tea Market Revenue, By Region, 2017 – 2022 (USD Million) 79

9.3. Creamer 80

9.3.1. Global Creamer Bubble Tea Market Revenue, By Region, 2017 – 2022 (USD Million) 81

9.3.2. Global Creamer Bubble Tea Market Revenue, By Region, 2017 – 2022 (USD Million) 81

9.4. Tapioca Pearls 82

9.4.1. Global Tapioca Pearls Bubble Tea Market Revenue, By Region, 2017 – 2022 (USD Million) 83

9.4.2. Global Tapioca Pearls Bubble Tea Market Revenue, By Region, 2017 – 2022 (USD Million) 83

9.5. Sweetener 84

9.5.1. Global Sweetener Bubble Tea Market Revenue, By Region, 2017 – 2022 (USD Million) 85

9.5.2. Global Sweetener Bubble Tea Market Revenue, By Region, 2017 – 2022 (USD Million) 85

9.6. Liquid 86

9.6.1. Global Liquid Bubble Tea Market Revenue, By Region, 2017 – 2022 (USD Million) 87

9.6.2. Global Liquid Bubble Tea Market Revenue, By Region, 2017 – 2022 (USD Million) 87


CHAPTER NO. 10 : BUBBLE TEA MARKET – BY SALES CHANNELS SEGMENT ANALYSIS 88

10.1. Bubble Tea Market Overview, by Sales Channels Segment 88

10.1.1. Bubble Tea Market Revenue Share, By Sales Channels, 2022 & 2030 89

10.1.2. Bubble Tea Market Attractiveness Analysis, By Sales Channels 90

10.1.3. Incremental Revenue Growth Opportunity, by Sales Channels, 2023 – 2030 90

10.1.4. Bubble Tea Market Revenue, By Sales Channels, 2017, 2022, 2026 & 2030 91

10.2. Chain Stores 92

10.2.1. Global Chain Stores Bubble Tea Market Revenue, By Region, 2017 – 2022 (USD Million) 93

10.2.2. Global Chain Stores Bubble Tea Market Revenue, By Region, 2017 – 2022 (USD Million) 93

10.3. Standalone Stores 94

10.3.1. Global Standalone Stores Bubble Tea Market Revenue, By Region, 2017 – 2022 (USD Million) 95

10.3.2. Global Standalone Stores Bubble Tea Market Revenue, By Region, 2017 – 2022 (USD Million) 95


CHAPTER NO. 11 : BUBBLE TEA MARKET – REGIONAL ANALYSIS 96

11.1. Bubble Tea Market Overview, by Regional Segments 96

11.2. Region 97

11.2.1. Global Bubble Tea Market Revenue Share, By Region, 2022 & 2030 97

11.2.2. Bubble Tea Market Attractiveness Analysis, By Region 98

11.2.3. Incremental Revenue Growth Opportunity, by Region, 2023 – 2030 98

11.2.4. Bubble Tea Market Revenue, By Region, 2017, 2022, 2026 & 2030 99

11.2.5. Global Bubble Tea Market Revenue, By Region, 2017 – 2022 (USD Million) 100

11.2.6. Global Bubble Tea Market Revenue, By Region, 2023 – 2030 (USD Million) 100

11.3. Type 101

11.3.1. Global Bubble Tea Market Revenue, By Type, 2017 – 2022 (USD Million) 101

11.3.2. Global Bubble Tea Market Revenue, By Type, 2023 – 2030 (USD Million) 101

11.4. Flavor 102

11.4.1. Global Bubble Tea Market Revenue, By Flavor, 2017 – 2022 (USD Million) 102

11.4.2. Global Bubble Tea Market Revenue, By Flavor, 2023 – 2030 (USD Million) 102

11.5. Component 103

11.5.1. Global Bubble Tea Market Revenue, By Component, 2017 – 2022 (USD Million) 103

11.5.2. Global Bubble Tea Market Revenue, By Component, 2023 – 2030 (USD Million) 103

11.6. Sales Channels 104

11.6.1. Global Bubble Tea Market Revenue, By Sales Channels, 2017 – 2022 (USD Million) 104

11.6.2. Global Bubble Tea Market Revenue, By Sales Channels, 2023 – 2030 (USD Million) 104


CHAPTER NO. 12 : BUBBLE TEA MARKET – NORTH AMERICA 105

12.1. North America 105

12.1. Key Highlights 105

12.1.1. North America Bubble Tea Market Revenue, By Country, 2017 – 2022 (USD Million) 106

12.1.2. North America Bubble Tea Market Revenue, By Type, 2017 – 2022 (USD Million) 107

12.1.3. North America Bubble Tea Market Revenue, By Flavor, 2017 – 2022 (USD Million) 108

12.1.4. North America Bubble Tea Market Revenue, By Component, 2017 – 2022 (USD Million) 109

12.1.5. North America Bubble Tea Market Revenue, By Sales Channels, 2017 – 2022 (USD Million) 110

12.1.6. U.S. 111

12.1.7. Canada 111

12.1.8. Mexico 111


CHAPTER NO. 13 : BUBBLE TEA MARKET – EUROPE 112

13.1. Europe 112

13.2. Key Highlights 112

13.2.1. Europe Bubble Tea Market Revenue, By Country, 2017 – 2022 (USD Million) 113

13.2.2. Europe Bubble Tea Market Revenue, By Type, 2017 – 2022 (USD Million) 114

13.2.3. Europe Bubble Tea Market Revenue, By Flavor, 2017 – 2022 (USD Million) 115

13.2.4. Europe Bubble Tea Market Revenue, By Component, 2017 – 2022 (USD Million) 116

13.2.5. Europe Bubble Tea Market Revenue, By Sales Channels, 2017 – 2022 (USD Million) 117

13.2.6. UK 118

13.2.7. France 118

13.2.8. Germany 118

13.2.9. Italy 118

13.2.10. Spain 118

13.2.11. Russia 118

13.2.12. BENELUX 118

13.2.13. Sweden 118

13.2.14. Denmark 118

13.2.15. Poland 118

13.2.16. Austria 118

13.2.17. Rest of Europe 118


CHAPTER NO. 14 : BUBBLE TEA MARKET – ASIA PACIFIC 119

14.1. Asia Pacific 119

14.2. Key Highlights 119

14.2.1. Asia Pacific Bubble Tea Market Revenue, By Country, 2017 – 2022 (USD Million) 120

14.2.2. Asia Pacific Bubble Tea Market Revenue, By Type, 2017 – 2022 (USD Million) 121

14.2.3. Asia Pacific Bubble Tea Market Revenue, By Flavor, 2017 – 2022 (USD Million) 122

14.2.4. Asia Pacific Bubble Tea Market Revenue, By Component, 2017 – 2022 (USD Million) 123

14.2.5. Asia Pacific Bubble Tea Market Revenue, By Sales Channels, 2017 – 2022 (USD Million) 124

14.2.6. China 125

14.2.7. Japan 125

14.2.8. South Korea 125

14.2.9. India 125

14.2.10. Thailand 125

14.2.11. Indonesia 125

14.2.12. Vietnam 125

14.2.13. Malaysia 125

14.2.14. Philippines 125

14.2.15. Taiwan 125

14.2.16. Rest of Asia Pacific 125


CHAPTER NO. 15 : BUBBLE TEA MARKET – LATIN AMERICA 126

15.1. Latin America 126

15.2. Key Highlights 126

15.2.1. Latin America Bubble Tea Market Revenue, By Country, 2017 – 2022 (USD Million) 127

15.2.2. Latin America Bubble Tea Market Revenue, By Type, 2017 – 2022 (USD Million) 128

15.2.3. Latin America Bubble Tea Market Revenue, By Flavor, 2017 – 2022 (USD Million) 129

15.2.4. Latin America Bubble Tea Market Revenue, By Component, 2017 – 2022 (USD Million) 130

15.2.5. Latin America Bubble Tea Market Revenue, By Sales Channels, 2017 – 2022 (USD Million) 131

15.2.6. Brazil 132

15.2.7. Argentina 132

15.2.8. Colombia 132

15.2.9. Chile 132

15.2.10. Peru 132

15.2.11. Rest of Latin America 132


CHAPTER NO. 16 : BUBBLE TEA MARKET – MIDDLE EAST 133

16.1. The Middle-East 133

16.2. Key Highlights 133

16.2.1. Middle East Bubble Tea Market Revenue, By Country, 2017 – 2022 (USD Million) 134

16.2.2. Middle East Bubble Tea Market Revenue, By Type, 2017 – 2022 (USD Million) 135

16.2.3. Middle East Bubble Tea Market Revenue, By Flavor, 2017 – 2022 (USD Million) 136

16.2.4. Middle East Bubble Tea Market Revenue, By Component, 2017 – 2022 (USD Million) 137

16.2.5. Middle East Bubble Tea Market Revenue, By Sales Channels, 2017 – 2022 (USD Million) 138

16.2.6. GCC Countries 139

16.2.7. Israel 139

16.2.8. Turkey 139

16.2.9. Iran 139

16.2.10. Rest of Middle East & Africa 139


CHAPTER NO. 17 : BUBBLE TEA MARKET – AFRICA 140

17.1. Africa 140

17.2. Key Highlights 140

17.2.1. Africa Bubble Tea Market Revenue, By Country, 2017 – 2022 (USD Million) 141

17.2.2. Africa Bubble Tea Market Revenue, By Type, 2017 – 2022 (USD Million) 142

17.2.3. Africa Bubble Tea Market Revenue, By Flavor, 2017 – 2022 (USD Million) 143

17.2.4. Africa Bubble Tea Market Revenue, By Component, 2017 – 2022 (USD Million) 144

17.2.5. Africa Bubble Tea Market Revenue, By Sales Channels, 2017 – 2022 (USD Million) 145

17.2.6. South Africa 146

17.2.7. Egypt 146

17.2.8. Nigeria 146

17.2.9. Algeria 146

17.2.10. Morocco 146

17.2.11. Rest of Africa 146


CHAPTER NO. 18 : COMPANY PROFILES 147

18.1. Boba Luca USA, Inc. 147

18.1.1. Company Overview 147

18.1.2. Product Portfolio 147

18.1.3. Swot Analysis 147

18.1.4. Business Strategy 148

18.1.5. Financial Overview 148

18.2. Bubble Tea Supply, Inc 149

18.3. Cha Time 149

18.4. CoCo Fresh Tea & Juice 149

18.5. DaBoba 149

18.6. Fokus, Inc. 149

18.7. Gong Cha 149

18.8. Happy Lemon 149

18.9. Kung Fu Tea 149

18.10. Lollicup USA, Inc. 149

18.11. Sharetea 149

18.12. T Bun International 149

18.13. Tapioca Express 149

18.14. Ten Ren’s Tea Time 149

18.15. Tiger Sugar 149

18.16. Troika JC 149


CHAPTER NO. 19 : RESEARCH METHODOLOGY 150

19.1. Research Methodology 150

19.2. Phase I – Secondary Research 151

19.3. Phase II – Data Modeling 151

19.3.1. Company Share Analysis Model 152

19.3.2. Revenue Based Modeling 152

19.4. Phase III – Primary Research 153

19.5. Research Limitations 154

19.5.1. Assumptions 154

List of Figures

FIG NO. 1. Global Bubble Tea Market Revenue, 2017 – 2022 (USD Million) 28

FIG NO. 2. Porter’s Five Forces Analysis for Global Bubble Tea Market 36

FIG NO. 3. Value Chain Analysis for Global Bubble Tea Market 37

FIG NO. 4. Company Share Analysis, 2022 39

FIG NO. 5. Company Share Analysis, 2022 39

FIG NO. 6. Company Share Analysis, 2022 40

FIG NO. 7. Bubble Tea Market – Company Revenue Market Share, 2022 41

FIG NO. 8. Bubble Tea Market Revenue Share, By Type, 2022 & 2030 47

FIG NO. 9. Market Attractiveness Analysis, By Type 48

FIG NO. 10. Incremental Revenue Growth Opportunity by Type 48

FIG NO. 11. Bubble Tea Market Revenue, By Type, 2017, 2022, 2026 & 2030 49

FIG NO. 12. Global Bubble Tea Market for Black Tea, Revenue (USD Million) 2017 – 2030 50

FIG NO. 13. Global Bubble Tea Market for Green Tea, Revenue (USD Million) 2017 – 2030 52

FIG NO. 14. Global Bubble Tea Market for , Revenue (USD Million) 2017 – 2030 54

FIG NO. 15. Global Bubble Tea Market for White Tea, Revenue (USD Million) 2017 – 2030 56

FIG NO. 16. Global Bubble Tea Market for Others, Revenue (USD Million) 2017 – 2030 58

FIG NO. 17. Bubble Tea Market Revenue Share, By Flavor, 2022 & 2030 61

FIG NO. 18. Market Attractiveness Analysis, By Flavor 62

FIG NO. 19. Incremental Revenue Growth Opportunity by Flavor 62

FIG NO. 20. Bubble Tea Market Revenue, By Flavor, 2017, 2022, 2026 & 2030 63

FIG NO. 21. Global Bubble Tea Market for Classic, Revenue (USD Million) 2017 – 2030 64

FIG NO. 22. Global Bubble Tea Market for Fruit, Revenue (USD Million) 2017 – 2030 66

FIG NO. 23. Global Bubble Tea Market for Chocolate, Revenue (USD Million) 2017 – 2030 68

FIG NO. 24. Global Bubble Tea Market for Coffee, Revenue (USD Million) 2017 – 2030 70

FIG NO. 25. Global Bubble Tea Market for Others, Revenue (USD Million) 2017 – 2030 72

FIG NO. 26. Bubble Tea Market Revenue Share, By Component, 2022 & 2030 75

FIG NO. 27. Market Attractiveness Analysis, By Component 76

FIG NO. 28. Incremental Revenue Growth Opportunity by Component 76

FIG NO. 29. Bubble Tea Market Revenue, By Component, 2017, 2022, 2026 & 2030 77

FIG NO. 30. Global Bubble Tea Market for Flavor, Revenue (USD Million) 2017 – 2030 78

FIG NO. 31. Global Bubble Tea Market for Creamer, Revenue (USD Million) 2017 – 2030 80

FIG NO. 32. Global Bubble Tea Market for Tapioca Pearls, Revenue (USD Million) 2017 – 2030 82

FIG NO. 33. Global Bubble Tea Market for Sweetener, Revenue (USD Million) 2017 – 2030 84

FIG NO. 34. Global Bubble Tea Market for Liquid, Revenue (USD Million) 2017 – 2030 86

FIG NO. 35. Bubble Tea Market Revenue Share, By Sales Channels, 2022 & 2030 89

FIG NO. 36. Market Attractiveness Analysis, By Sales Channels 90

FIG NO. 37. Incremental Revenue Growth Opportunity by Sales Channels 90

FIG NO. 38. Bubble Tea Market Revenue, By Sales Channels, 2017, 2022, 2026 & 2030 91

FIG NO. 39. Global Bubble Tea Market for Chain Stores, Revenue (USD Million) 2017 – 2030 92

FIG NO. 40. Global Bubble Tea Market for Standalone Stores, Revenue (USD Million) 2017 – 2030 94

FIG NO. 41. Global Bubble Tea Market Revenue Share, By Region, 2022 & 2030 97

FIG NO. 42. Market Attractiveness Analysis, By Region 98

FIG NO. 43. Incremental Revenue Growth Opportunity by Region 98

FIG NO. 44. Bubble Tea Market Revenue, By Region, 2017, 2022, 2026 & 2030 99

FIG NO. 45. North America Bubble Tea Market Revenue, 2017 – 2022 (USD Million) 105

FIG NO. 46. Europe Bubble Tea Market Revenue, 2017 – 2022 (USD Million) 112

FIG NO. 47. Asia Pacific Bubble Tea Market Revenue, 2017 – 2022 (USD Million) 119

FIG NO. 48. Latin America Bubble Tea Market Revenue, 2017 – 2022 (USD Million) 126

FIG NO. 49. The Middle-East Bubble Tea Market Revenue, 2017 – 2022 (USD Million) 133

FIG NO. 50. Africa Bubble Tea Market Revenue, 2017 – 2022 (USD Million) 140

FIG NO. 51. Research Methodology – Detailed View 150

FIG NO. 52. Research Methodology 151


List of Tables

TABLE NO. 1. : Global Bubble Tea Market: Snapshot 27

TABLE NO. 2. : Drivers for the Bubble Tea Market: Impact Analysis 32

TABLE NO. 3. : Restraints for the Bubble Tea Market: Impact Analysis 34

TABLE NO. 4. : Global Black Tea Bubble Tea Market Revenue, By Region, 2017 – 2022 (USD Million) 51

TABLE NO. 5. : Global Black Tea Bubble Tea Market Revenue, By Region, 2023– 2030 (USD Million) 51

TABLE NO. 6. : Global Green Tea Bubble Tea Market Revenue, By Region, 2017 – 2022 (USD Million) 53

TABLE NO. 7. : Global Green Tea Bubble Tea Market Revenue, By Region, 2023– 2030 (USD Million) 53

TABLE NO. 8. : Global  Bubble Tea Market Revenue, By Region, 2017 – 2022 (USD Million) 55

TABLE NO. 9. : Global  Bubble Tea Market Revenue, By Region, 2023– 2030 (USD Million) 55

TABLE NO. 10. : Global White Tea Bubble Tea Market Revenue, By Region, 2017 – 2022 (USD Million) 57

TABLE NO. 11. : Global White Tea Bubble Tea Market Revenue, By Region, 2023– 2030 (USD Million) 57

TABLE NO. 12. : Global Others Bubble Tea Market Revenue, By Region, 2017 – 2022 (USD Million) 59

TABLE NO. 13. : Global Others Bubble Tea Market Revenue, By Region, 2023– 2030 (USD Million) 59

TABLE NO. 14. : Global Classic Bubble Tea Market Revenue, By Region, 2017 – 2022 (USD Million) 65

TABLE NO. 15. : Global Classic Bubble Tea Market Revenue, By Region, 2023– 2030 (USD Million) 65

TABLE NO. 16. : Global Fruit Bubble Tea Market Revenue, By Region, 2017 – 2022 (USD Million) 67

TABLE NO. 17. : Global Fruit Bubble Tea Market Revenue, By Region, 2023– 2030 (USD Million) 67

TABLE NO. 18. : Global Chocolate Bubble Tea Market Revenue, By Region, 2017 – 2022 (USD Million) 69

TABLE NO. 19. : Global Chocolate Bubble Tea Market Revenue, By Region, 2023– 2030 (USD Million) 69

TABLE NO. 20. : Global Coffee Bubble Tea Market Revenue, By Region, 2017 – 2022 (USD Million) 71

TABLE NO. 21. : Global Coffee Bubble Tea Market Revenue, By Region, 2023– 2030 (USD Million) 71

TABLE NO. 22. : Global Others Bubble Tea Market Revenue, By Region, 2017 – 2022 (USD Million) 73

TABLE NO. 23. : Global Others Bubble Tea Market Revenue, By Region, 2023– 2030 (USD Million) 73

TABLE NO. 24. : Global Flavor Bubble Tea Market Revenue, By Region, 2017 – 2022 (USD Million) 79

TABLE NO. 25. : Global Flavor Bubble Tea Market Revenue, By Region, 2023– 2030 (USD Million) 79

TABLE NO. 26. : Global Creamer Bubble Tea Market Revenue, By Region, 2017 – 2022 (USD Million) 81

TABLE NO. 27. : Global Creamer Bubble Tea Market Revenue, By Region, 2023– 2030 (USD Million) 81

TABLE NO. 28. : Global Tapioca Pearls Bubble Tea Market Revenue, By Region, 2017 – 2022 (USD Million) 83

TABLE NO. 29. : Global Tapioca Pearls Bubble Tea Market Revenue, By Region, 2023– 2030 (USD Million) 83

TABLE NO. 30. : Global Sweetener Bubble Tea Market Revenue, By Region, 2017 – 2022 (USD Million) 85

TABLE NO. 31. : Global Sweetener Bubble Tea Market Revenue, By Region, 2023– 2030 (USD Million) 85

TABLE NO. 32. : Global Liquid Bubble Tea Market Revenue, By Region, 2017 – 2022 (USD Million) 87

TABLE NO. 33. : Global Liquid Bubble Tea Market Revenue, By Region, 2023– 2030 (USD Million) 87

TABLE NO. 34. : Global Chain Stores Bubble Tea Market Revenue, By Region, 2017 – 2022 (USD Million) 93

TABLE NO. 35. : Global Chain Stores Bubble Tea Market Revenue, By Region, 2023– 2030 (USD Million) 93

TABLE NO. 36. : Global Standalone Stores Bubble Tea Market Revenue, By Region, 2017 – 2022 (USD Million) 95

TABLE NO. 37. : Global Standalone Stores Bubble Tea Market Revenue, By Region, 2023– 2030 (USD Million) 95

TABLE NO. 38. : Global Bubble Tea Market Revenue, By Region, 2017 – 2022 (USD Million) 100

TABLE NO. 39. : Global Bubble Tea Market Revenue, By Region, 2023– 2030 (USD Million) 100

TABLE NO. 40. : Global Bubble Tea Market Revenue, By Type, 2017 – 2022 (USD Million) 101

TABLE NO. 41. : Global Bubble Tea Market Revenue, By Type, 2023– 2030 (USD Million) 101

TABLE NO. 42. : Global Bubble Tea Market Revenue, By Flavor, 2017 – 2022 (USD Million) 102

TABLE NO. 43. : Global Bubble Tea Market Revenue, By Flavor, 2023– 2030 (USD Million) 102

TABLE NO. 44. : Global Bubble Tea Market Revenue, By Component, 2017 – 2022 (USD Million) 103

TABLE NO. 45. : Global Bubble Tea Market Revenue, By Component, 2023– 2030 (USD Million) 103

TABLE NO. 46. : Global Bubble Tea Market Revenue, By Sales Channels, 2017 – 2022 (USD Million) 104

TABLE NO. 47. : Global Bubble Tea Market Revenue, By Sales Channels, 2023– 2030 (USD Million) 104

TABLE NO. 48. : North America Bubble Tea Market Revenue, By Country, 2017 – 2022 (USD Million) 106

TABLE NO. 49. : North America Bubble Tea Market Revenue, By Country, 2023– 2030 (USD Million) 106

TABLE NO. 50. : North America Bubble Tea Market Revenue, By Type, 2017 – 2022 (USD Million) 107

TABLE NO. 51. : North America Bubble Tea Market Revenue, By Type, 2023– 2030 (USD Million) 107

TABLE NO. 52. : North America Bubble Tea Market Revenue, By Flavor, 2017 – 2022 (USD Million) 108

TABLE NO. 53. : North America Bubble Tea Market Revenue, By Flavor, 2023– 2030 (USD Million) 108

TABLE NO. 54. : North America Bubble Tea Market Revenue, By Component, 2017 – 2022 (USD Million) 109

TABLE NO. 55. : North America Bubble Tea Market Revenue, By Component, 2023– 2030 (USD Million) 109

TABLE NO. 56. : North America Bubble Tea Market Revenue, By Sales Channels, 2017 – 2022 (USD Million) 110

TABLE NO. 57. : North America Bubble Tea Market Revenue, By Sales Channels, 2023– 2030 (USD Million) 110

TABLE NO. 58. : Europe Bubble Tea Market Revenue, By Country, 2017 – 2022 (USD Million) 113

TABLE NO. 59. : Europe Bubble Tea Market Revenue, By Country, 2023– 2030 (USD Million) 113

TABLE NO. 60. : Europe Bubble Tea Market Revenue, By Type, 2017 – 2022 (USD Million) 114

TABLE NO. 61. : Europe Bubble Tea Market Revenue, By Type, 2023– 2030 (USD Million) 114

TABLE NO. 62. : Europe Bubble Tea Market Revenue, By Flavor, 2017 – 2022 (USD Million) 115

TABLE NO. 63. : Europe Bubble Tea Market Revenue, By Flavor, 2023– 2030 (USD Million) 115

TABLE NO. 64. : Europe Bubble Tea Market Revenue, By Component, 2017 – 2022 (USD Million) 116

TABLE NO. 65. : Europe Bubble Tea Market Revenue, By Component, 2023– 2030 (USD Million) 116

TABLE NO. 66. : Europe Bubble Tea Market Revenue, By Sales Channels, 2017 – 2022 (USD Million) 117

TABLE NO. 67. : Europe Bubble Tea Market Revenue, By Sales Channels, 2023– 2030 (USD Million) 117

TABLE NO. 68. : Asia Pacific Bubble Tea Market Revenue, By Country, 2017 – 2022 (USD Million) 120

TABLE NO. 69. : Asia Pacific Bubble Tea Market Revenue, By Country, 2023– 2030 (USD Million) 120

TABLE NO. 70. : Asia Pacific Bubble Tea Market Revenue, By Type, 2017 – 2022 (USD Million) 121

TABLE NO. 71. : Asia Pacific Bubble Tea Market Revenue, By Type, 2023– 2030 (USD Million) 121

TABLE NO. 72. : Asia Pacific Bubble Tea Market Revenue, By Flavor, 2017 – 2022 (USD Million) 122

TABLE NO. 73. : Asia Pacific Bubble Tea Market Revenue, By Flavor, 2023– 2030 (USD Million) 122

TABLE NO. 74. : Asia Pacific Bubble Tea Market Revenue, By Component, 2017 – 2022 (USD Million) 123

TABLE NO. 75. : Asia Pacific Bubble Tea Market Revenue, By Component, 2023– 2030 (USD Million) 123

TABLE NO. 76. : Asia Pacific Bubble Tea Market Revenue, By Sales Channels, 2017 – 2022 (USD Million) 124

TABLE NO. 77. : Asia Pacific Bubble Tea Market Revenue, By Sales Channels, 2023– 2030 (USD Million) 124

TABLE NO. 78. : Latin America Bubble Tea Market Revenue, By Country, 2017 – 2022 (USD Million) 127

TABLE NO. 79. : Latin America Bubble Tea Market Revenue, By Country, 2023– 2030 (USD Million) 127

TABLE NO. 80. : Latin America Bubble Tea Market Revenue, By Type, 2017 – 2022 (USD Million) 128

TABLE NO. 81. : Latin America Bubble Tea Market Revenue, By Type, 2023– 2030 (USD Million) 128

TABLE NO. 82. : Latin America Bubble Tea Market Revenue, By Flavor, 2017 – 2022 (USD Million) 129

TABLE NO. 83. : Latin America Bubble Tea Market Revenue, By Flavor, 2023– 2030 (USD Million) 129

TABLE NO. 84. : Latin America Bubble Tea Market Revenue, By Component, 2017 – 2022 (USD Million) 130

TABLE NO. 85. : Latin America Bubble Tea Market Revenue, By Component, 2023– 2030 (USD Million) 130

TABLE NO. 86. : Latin America Bubble Tea Market Revenue, By Sales Channels, 2017 – 2022 (USD Million) 131

TABLE NO. 87. : Latin America Bubble Tea Market Revenue, By Sales Channels, 2023– 2030 (USD Million) 131

TABLE NO. 88. : Middle East Bubble Tea Market Revenue, By Country, 2017 – 2022 (USD Million) 134

TABLE NO. 89. : Middle East Bubble Tea Market Revenue, By Country, 2023– 2030 (USD Million) 134

TABLE NO. 90. : Middle East Bubble Tea Market Revenue, By Type, 2017 – 2022 (USD Million) 135

TABLE NO. 91. : Middle East Bubble Tea Market Revenue, By Type, 2023– 2030 (USD Million) 135

TABLE NO. 92. : Middle East Bubble Tea Market Revenue, By Flavor, 2017 – 2022 (USD Million) 136

TABLE NO. 93. : Middle East Bubble Tea Market Revenue, By Flavor, 2023– 2030 (USD Million) 136

TABLE NO. 94. : Middle East Bubble Tea Market Revenue, By Component, 2017 – 2022 (USD Million) 137

TABLE NO. 95. : Middle East Bubble Tea Market Revenue, By Component, 2023– 2030 (USD Million) 137

TABLE NO. 96. : Middle East Bubble Tea Market Revenue, By Sales Channels, 2017 – 2022 (USD Million) 138

TABLE NO. 97. : Middle East Bubble Tea Market Revenue, By Sales Channels, 2023– 2030 (USD Million) 138

TABLE NO. 98. : Africa Bubble Tea Market Revenue, By Country, 2017 – 2022 (USD Million) 141

TABLE NO. 99. : Africa Bubble Tea Market Revenue, By Country, 2023– 2030 (USD Million) 141

TABLE NO. 100. : Africa Bubble Tea Market Revenue, By Type, 2017 – 2022 (USD Million) 142

TABLE NO. 101. : Africa Bubble Tea Market Revenue, By Type, 2023– 2030 (USD Million) 142

TABLE NO. 102. : Africa Bubble Tea Market Revenue, By Flavor, 2017 – 2022 (USD Million) 143

TABLE NO. 103. : Africa Bubble Tea Market Revenue, By Flavor, 2023– 2030 (USD Million) 143

TABLE NO. 104. : Africa Bubble Tea Market Revenue, By Component, 2017 – 2022 (USD Million) 144

TABLE NO. 105. : Africa Bubble Tea Market Revenue, By Component, 2023– 2030 (USD Million) 144

TABLE NO. 106. : Africa Bubble Tea Market Revenue, By Sales Channels, 2017 – 2022 (USD Million) 145

TABLE NO. 107. : Africa Bubble Tea Market Revenue, By Sales Channels, 2023– 2030 (USD Million) 145


Frequently Asked Questions

What is Bubble Tea, and where did it originate?

Bubble Tea, also known as Boba Tea, is a popular beverage that originated in Taiwan in the 1980s. It typically consists of tea (usually black or green tea) or a fruit-based drink mixed with milk or non-dairy creamer. What makes Bubble Tea unique are the chewy tapioca pearls or fruit jelly balls at the bottom of the cup, giving it a delightful texture.

What are the key ingredients of Bubble Tea?

Bubble Tea typically includes tea (black or green), milk or non-dairy creamer, sweeteners (like syrup or honey), ice, and flavorings (such as fruit extracts or powders). Tapioca pearls, fruit jelly, or even fruit bits are added for that distinctive bubble-like texture.

How has the Bubble Tea market been growing in recent years?

The Bubble Tea market has experienced remarkable growth, with revenues surging from USD 2,931.45 million in 2022 to USD 5,184.53 million in 2030, marking a significant Compound Annual Growth Rate (CAGR) of 8.49% from 2023 to 2030. This growth can be attributed to its increasing popularity worldwide.

What are the most popular flavors of Bubble Tea?

While many flavors are available, some popular ones include classic milk tea, taro, and matcha, fruit flavors like mango and strawberry, and innovative combinations like brown sugar and pearl milk tea. Preferences can vary by region.

Which region dominates the Bubble Tea market, and why?

In 2022, Asia Pacific held the largest market share of over 50%, primarily due to the beverage’s popularity in countries like Taiwan, China, and South Korea. North America emerged as the second-largest market, reflecting Bubble Tea’s global appeal and potential for growth across diverse demographics.

What are the health implications of consuming Bubble Tea?

Bubble Tea’s nutritional profile can vary based on ingredients and preparation. While it can be high in sugar and calories, some variations use healthier options like non-dairy milk and reduced sugar syrups. Consumers should be mindful of their choices and consider moderation.

How can I start a Bubble Tea business?

Starting a Bubble Tea business involves market research, securing suppliers, obtaining permits, setting up shop, and creating a unique menu. It’s essential to create a business plan and understand local regulations.

What are the emerging trends in the Bubble Tea market?

Emerging trends include developing highly nutritious organic Bubble Tea products to cater to health-conscious consumers. There is also a focus on innovation, with new flavor combinations, ingredients, and serving methods constantly evolving to attract a broader customer base.

How has the COVID-19 pandemic affected the Bubble Tea market?

The pandemic initially led to disruptions in the Bubble Tea market due to lockdowns and restrictions on dine-in services. However, the industry demonstrated resilience by pivoting to takeout and delivery options, ensuring its survival and adaptability.

Are there any cultural variations of Bubble Tea in different regions?

Yes, Bubble Tea adapts to local tastes and preferences in various countries. For example, in Taiwan, the birthplace of Bubble Tea, it’s often enjoyed with simple flavors. In contrast, you might find more diverse and innovative variations in North America to suit the local palate.

UK Gluten Free Products Market

Published:
Report ID: 30545

India Pet Food Market

Published:
Report ID: 36785

Biostimulants Market

Published:
Report ID: 1671

Aloe Vera Extracts Market

Published:
Report ID: 11979

Sugar Alcohol Market

Published:
Report ID: 37467

Algae Oil Market

Published:
Report ID: 1288

Matcha Tea Market

Published:
Report ID: 37133

Natural Flavors Market

Published:
Report ID: 14378

Oat Milk Market

Published:
Report ID: 37052

Processed Meat Market

Published:
Report ID: 11443

Dill Juice Market

Published:
Report ID: 5087

Edible Oils Market

Published:
Report ID: 4775

Purchase Options

$2999
Delivery Format: Excel.
$4999
Designed for the individual purchaser.
$6999
Users located at a single corporate site or regional office.
$7999
Allowed for unlimited sharing globally within one company.
Smallform of Sample request

Have a question?

User Profile

Don’t settle for less – trust Mitul to help you find the best solution.

Report delivery within 24 to 48 hours

– Other Info –

What people say?-

User Review

I am very impressed with the information in this report. The author clearly did their research when they came up with this product and it has already given me a lot of ideas.

Jana Schmidt
CEDAR CX Technologies

– Connect with us –

Phone

+91 6232 49 3207


support

24/7 Research Support


sales@credenceresearch.com

– Research Methodology –

Going beyond the basics: advanced techniques in research methodology

– Trusted By –

Pepshi, LG, Nestle
Motorola, Honeywell, Johnson and johnson
LG Chem, SIEMENS, Pfizer
Unilever, Samsonite, QIAGEN