Market Overview:
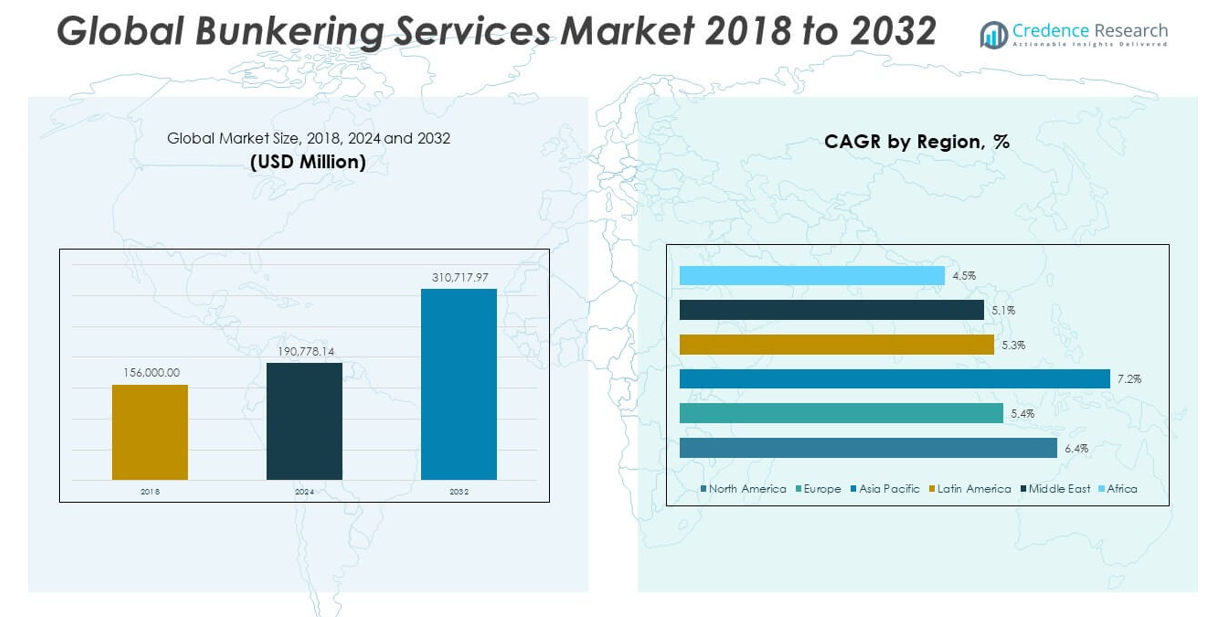
The Bunkering Services Market size was valued at USD 1,56,000.00 million in 2018 to USD 1,90,778.14 million in 2024 and is anticipated to reach USD 3,10,717.97 million by 2032, at a CAGR of 6.35% during the forecast period.
| REPORT ATTRIBUTE |
DETAILS |
| Historical Period |
2020-2023 |
| Base Year |
2024 |
| Forecast Period |
2025-2032 |
| Bunkering Services Market Size 2024 |
USD 1,90,778.14 million |
| Bunkering Services Market, CAGR |
6.35% |
| Bunkering Services Market Size 2032 |
USD 3,10,717.97 million |
The growth of the bunkering services market is primarily fueled by the rising demand for maritime transportation, which handles over 80% of global trade volume. As international shipping traffic increases, the need for efficient and accessible fuel supply services at key ports is expanding. Additionally, stricter environmental regulations, such as the IMO 2020 sulfur cap, are reshaping the industry by encouraging the adoption of low-sulfur fuel oils, marine gas oil (MGO), and liquefied natural gas (LNG). These regulations are pushing shipowners to seek compliant fuel alternatives, thereby increasing demand for advanced bunkering solutions. The shift toward cleaner fuels also presents opportunities for companies investing in LNG bunkering infrastructure and alternative fuel technologies. Furthermore, advancements in digital monitoring, automated bunkering operations, and fuel tracking systems are streamlining the bunkering process and reducing operational risk, thus supporting market growth across both traditional and emerging shipping routes.
Asia-Pacific dominates the global bunkering services market, accounting for the largest share due to the presence of high-traffic maritime hubs such as Singapore, Hong Kong, and Shanghai. These ports are strategically located along major international trade routes and are equipped with advanced fueling infrastructure, making the region the cornerstone of global marine fuel supply. Europe holds the second-largest market share, led by ports like Rotterdam and Antwerp, which are investing heavily in sustainable fuel alternatives including LNG and biofuels to meet EU decarbonization targets. North America follows closely, with significant activity centered around ports in the U.S. Gulf Coast and California, where cleaner fuel adoption is gaining momentum. The Middle East is emerging as a key player due to its oil-rich resources and geographic position as a maritime crossroads. Meanwhile, Latin America and Africa are showing moderate growth, driven by infrastructure development and increasing regional trade activity.
Market Insights:
- The Bunkering Services Market was valued at USD 1,90,778.14 million in 2024 and is expected to reach USD 3,10,717.97 million by 2032, expanding at a CAGR of 6.35% due to rising maritime fuel demand.
- Over 80% of global trade moves through seaborne routes, significantly boosting the need for efficient bunkering infrastructure at high-traffic ports worldwide.
- Regulatory frameworks like IMO 2020 have accelerated the shift from high-sulfur fuels to VLSFO, MGO, and LNG, prompting refiners and suppliers to diversify their offerings.
- LNG and bio-LNG bunkering are seeing robust growth, supported by dual-fuel engine adoption and investments in modular, low-emission fueling solutions.
- Advanced technologies such as digital monitoring, automated bunkering, and fuel tracking systems are optimizing operational workflows and reducing compliance risks.
- Market players face challenges from volatile fuel prices, evolving emission regulations, and limited infrastructure in developing regions, especially for alternative fuels.
- Asia-Pacific leads the global market due to its strategic ports and established fuel networks, followed by Europe and North America with strong regulatory support for cleaner fuel transitions.
Access crucial information at unmatched prices!
Request your sample report today & start making informed decisions powered by Credence Research Inc.!
Download Sample
Market Drivers:
Expansion of Global Maritime Trade Is Creating Steady Demand for Fuel Supply at Port Hubs
The rapid growth in global seaborne trade continues to strengthen the need for bunkering operations. More than 80% of world merchandise trade relies on shipping, leading to a constant demand for fuel at major ports. Container traffic, bulk cargo movements, and oil tanker operations all contribute to the growing dependency on reliable and timely bunkering services. The Bunkering Services Market benefits from rising vessel traffic across Asia-Pacific, the Middle East, and Europe. It supports port operations by ensuring efficient refueling, thereby reducing vessel turnaround times. Higher trade volumes, especially from emerging economies and e-commerce-driven exports, amplify the pressure on ports to provide accessible and cost-effective bunkering.
- For example, the Port of Singapore, the world’s largest bunkering port, recorded a dramatic increase in LNG bunkering volumes from 110,900 tonnes in 2023 to 463,900 tonnes in 2024 a nearly fourfold rise.
Stringent Environmental Regulations Are Accelerating the Shift to Cleaner Marine Fuels
Tighter maritime fuel regulations have become a significant growth driver. The implementation of the IMO 2020 regulation, which limits sulfur content in marine fuels to 0.5%, has compelled vessel operators to move away from high-sulfur fuel oil. This transition fuels demand for very low sulfur fuel oil (VLSFO), marine gas oil (MGO), and liquefied natural gas (LNG). The Bunkering Services Market is undergoing transformation to accommodate these fuels, with suppliers investing in new infrastructure and logistics solutions. It is driving cleaner fuel adoption by expanding LNG bunkering capabilities and promoting hybrid fueling models. Market participants are aligning with global sustainability goals by offering low-emission alternatives that meet both commercial and compliance needs.
Port Infrastructure Development and Digital Bunkering Systems Are Enhancing Efficiency
Major ports are enhancing their fueling capacities through infrastructure upgrades and digitalization. Investments in LNG terminals, floating storage units, and dual-fuel bunkering barges are enabling flexible and secure fuel supply. The integration of automated systems and remote fuel monitoring tools is improving operational visibility and reducing human error. It supports transparency in fuel quality, quantity, and delivery timelines, which is critical for shipping lines to maintain compliance. These innovations reduce turnaround time for vessels and help minimize operational risk. The expansion of bunkering fleets and real-time tracking platforms is strengthening service reliability across global port networks.
- For example, in China, CHIMBUSCOand COSCO SHIPPING completed the country’s first fully digital bonded bunkering operation at Shanghai Yangshan Deepwater Port, delivering 1,300 tons of low-sulfur fuel oil using a real-time, end-to-end digital platform integrating customs and maritime regulatory modules.
Diversification Toward Alternative Fuels Is Reshaping Competitive Positioning
Growing interest in decarbonization has shifted the industry’s focus to alternative fuels such as LNG, bio-LNG, methanol, and ammonia. The demand for LNG bunkering is surging, driven by carriers that have adopted dual-fuel engines. It is encouraging suppliers to develop flexible infrastructure that accommodates both conventional and new fuel types. Leading shipping companies are forming strategic partnerships with fuel providers to ensure long-term access to low-emission fuels. The Bunkering Services Market is adjusting to this evolving fuel mix by adopting modular fueling units and scalable storage systems. These shifts are enabling suppliers to remain competitive while supporting the maritime sector’s carbon neutrality objectives.
Market Trends:
Growing Consolidation Among Bunkering Operators Is Redefining Competitive Landscape
Mergers and acquisitions among fuel suppliers and maritime logistics firms are reshaping the structure of the bunkering industry. Larger players are acquiring regional operators to expand their global reach and standardize service offerings. This consolidation is reducing fragmentation in key port areas and improving pricing power for major companies. It allows operators to optimize fuel procurement, strengthen fleet utilization, and ensure service consistency across international ports. The Bunkering Services Market is becoming more integrated, with global players offering end-to-end fueling solutions that combine physical delivery, storage, and trading. It supports cost efficiency and reliability, which are key priorities for fleet operators managing volatile fuel expenses.
- For example, Minerva Bunkering, following its acquisition of Bomin Group in October 2024, now operates in over 150 ports globally with an annual physical delivery capacity of 25 million metric tonnesand sources over 35 million tonnes of fuel each year through its supply chain.
Rising Role of Data Analytics and AI in Operational Optimization and Fuel Forecasting
Technological advancements are driving a shift toward intelligent bunkering systems. Companies are adopting AI-powered platforms and predictive analytics to forecast fuel demand, optimize delivery schedules, and monitor vessel behavior. These tools improve bunker planning accuracy, reduce waste, and enhance compliance reporting. It enhances the customer experience by offering real-time transparency on pricing, fuel specs, and delivery timelines. The Bunkering Services Market is evolving to support digital platforms that integrate with port management systems, enabling faster and data-driven decision-making. This trend is also fostering greater collaboration between shipping lines, port authorities, and fuel suppliers for streamlined marine logistics.
Emergence of Regional Bunkering Alliances to Promote Supply Chain Resilience
Port authorities and local governments are forming strategic alliances with fuel suppliers to enhance regional energy security. These collaborations aim to diversify fuel sources, build storage capacity, and stabilize marine fuel pricing in key maritime corridors. It strengthens the ability of ports to serve high-traffic routes while minimizing disruptions caused by geopolitical tensions or supply bottlenecks. The Bunkering Services Market is responding with a surge in joint ventures and public-private partnerships, particularly in Asia-Pacific and the Middle East. These efforts are enabling smaller ports to offer competitive services and attract larger shipping lines. Localized sourcing strategies are also reducing dependence on single suppliers and fostering long-term supply resilience.
- For example, BP and Sinopec’s 50:50 joint venture, BP Sinopec Marine Fuels Pte Ltd, based in Singapore, leverages both companies’ networks to provide marine bunker sales across ten major ports, including Singapore, Fujairah, Antwerp, and several key Chinese ports.
Increasing Interest in Offshore Bunkering and Floating Storage Solutions
Offshore bunkering operations are gaining traction due to congestion in major ports and the need for flexible fuel delivery systems. Floating storage units and offshore bunkering vessels offer greater operational mobility and reduce turnaround time for deep-sea vessels. The Bunkering Services Market is adapting to support offshore fueling by upgrading barge fleets and deploying autonomous refueling systems. It enhances the ability to serve anchorages and remote locations without relying on fixed port infrastructure. This trend is especially relevant in energy-intensive sectors like offshore oil and gas or bulk commodity shipping. It also supports safer operations by reducing pressure on high-traffic berths and port terminals.
Market Challenges Analysis:
Volatile Fuel Prices and Regulatory Uncertainty Are Creating Operational Complexity
Fluctuating crude oil prices and changing marine fuel costs are major hurdles for bunkering service providers. Fuel price volatility affects profit margins, contract stability, and cost forecasting for both suppliers and shipowners. Frequent regulatory updates from global and regional maritime bodies further complicate operations. The International Maritime Organization and national agencies continue to revise emissions norms, carbon limits, and reporting requirements, demanding rapid compliance. The Bunkering Services Market must adapt quickly, often requiring capital-intensive infrastructure changes and operational shifts. It places significant pressure on smaller operators that lack the scale to absorb these disruptions or invest in flexible delivery systems.
Infrastructure Gaps and Limited Alternative Fuel Availability Are Slowing Transition
Ports in many developing regions face limitations in bunkering infrastructure, storage capacity, and refueling systems for emerging fuel types. LNG, methanol, and biofuel supply chains remain underdeveloped outside major hubs, restricting global accessibility. The Bunkering Services Market is encountering delays in alternative fuel adoption due to high setup costs and inconsistent global standards. It also struggles with fragmented policies that limit cross-border compatibility of clean fuels and fueling equipment. Lack of trained personnel, safety protocols, and quality assurance systems in some regions adds further complications. These gaps hinder smooth service delivery, limit expansion potential, and slow the maritime sector’s progress toward low-emission operations.
Market Opportunities:
Rising Investments in LNG and Biofuel Infrastructure Can Unlock New Revenue Streams
The global shift toward decarbonization is driving strong demand for cleaner marine fuels, especially LNG, bio-LNG, and methanol. Ports and energy companies are allocating capital to build dual-fuel bunkering vessels, cryogenic storage systems, and modular refueling units. The Bunkering Services Market can capture value by offering diversified fuel options and expanding services in emission-controlled areas. It opens doors for early movers to secure long-term contracts with shipping lines transitioning to eco-friendly fleets. Incentives from governments and green shipping programs further enhance the viability of low-emission fueling solutions. These developments present a path for market players to align profitability with sustainability goals.
Digital Platforms and Automation Solutions Offer Path to Service Differentiation
Automation tools, digital bunkering platforms, and blockchain-enabled documentation systems are streamlining operations across global ports. Real-time tracking, electronic fuel delivery notes, and predictive demand analytics are improving transparency and trust between suppliers and customers. The Bunkering Services Market can use these technologies to reduce errors, cut downtime, and offer tailored services. It supports a shift toward faster, smarter, and more secure transactions. Companies that leverage digital innovation can gain competitive advantage and deepen customer loyalty. Expanding these capabilities in emerging markets offers untapped growth potential.
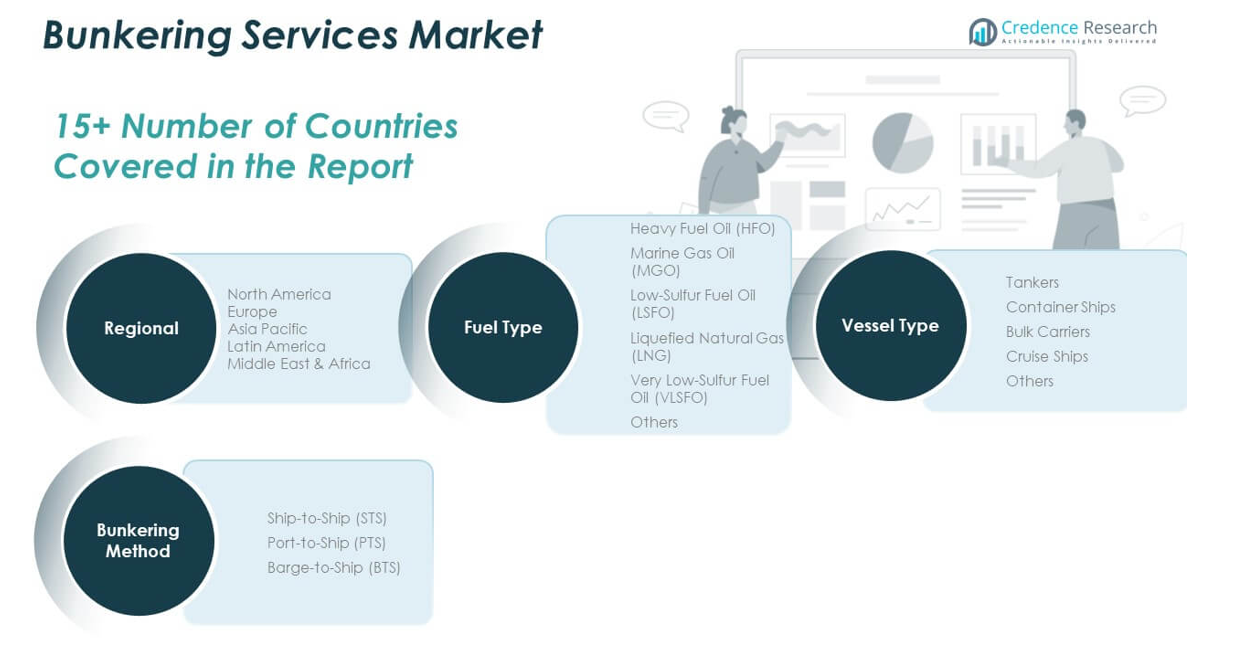
Market Segmentation Analysis:
The Bunkering Services Market is segmented by fuel type, vessel type, and bunkering method, each playing a critical role in shaping industry dynamics.
By fuel type, Very Low-Sulfur Fuel Oil (VLSFO) leads the market due to regulatory mandates under IMO 2020, followed by Marine Gas Oil (MGO) and Heavy Fuel Oil (HFO). Demand for Liquefied Natural Gas (LNG) is rising steadily as shipping lines adopt cleaner propulsion systems. Low-Sulfur Fuel Oil (LSFO) also holds a relevant share, especially in regions transitioning toward emission compliance.
- For example, at the Port of Rotterdam in 2024, VLSFO accounted for 3,076,817 tonnes, representing 0%of total fossil fuel bunker sales, making it the single largest marine fuel by volume in this major global hub.
By vessel type, Tankers dominate the market, followed by Container Ships and Bulk Carriers, which together account for a significant portion of global maritime fuel consumption. Cruise Ships and Others, including offshore support vessels and ferries, contribute moderately to segmental demand.
- For example, Eastern Pacific Shipping’s 2024 ESG report highlights a fleet of over 250 vessels, with a significant portion being bulk carriers that are increasingly powered by LNG and alternative fuels. The company’s dual-fuel fleet includes 57 delivered dual-fuel vesselsas of March 2024, supporting emissions reduction and compliance with global regulations.
By bunkering method, Ship-to-Ship (STS) bunkering remains the most widely used due to its flexibility and cost-efficiency. Port-to-Ship (PTS) and Barge-to-Ship (BTS) methods are gaining adoption in ports with structured fueling logistics. The Bunkering Services Market continues to diversify across these segments, driven by shifting fuel preferences and vessel technology.
Segmentation:
By Fuel Type
- Heavy Fuel Oil (HFO)
- Marine Gas Oil (MGO)
- Low-Sulfur Fuel Oil (LSFO)
- Liquefied Natural Gas (LNG)
- Very Low-Sulfur Fuel Oil (VLSFO)
- Others
By Vessel Type
- Tankers
- Container Ships
- Bulk Carriers
- Cruise Ships
- Others
By Bunkering Method
- Ship-to-Ship (STS)
- Port-to-Ship (PTS)
- Barge-to-Ship (BTS)
By Region
- North America
- Europe
- Germany
- France
- U.K.
- Italy
- Spain
- Rest of Europe
- Asia Pacific
- China
- Japan
- India
- South Korea
- South-east Asia
- Rest of Asia Pacific
- Latin America
- Brazil
- Argentina
- Rest of Latin America
- Middle East & Africa
- GCC Countries
- South Africa
- Rest of the Middle East and Africa
Regional Analysis:
The North America Bunkering Services Market size was valued at USD 44,772.00 million in 2018 to USD 53,912.76 million in 2024 and is anticipated to reach USD 87,654.10 million by 2032, at a CAGR of 6.4% during the forecast period. North America accounts for nearly 22% share of the global Bunkering Services Market, supported by well-established port infrastructure and a strong commercial shipping industry. Major ports like Houston, Los Angeles, and New York serve as critical fueling hubs for cargo and oil tankers. The region is seeing a shift toward cleaner fuels, with increased adoption of marine gas oil and LNG to meet environmental compliance standards. It benefits from regulatory clarity and steady investment in sustainable maritime solutions. Companies are expanding LNG bunkering fleets along the Gulf Coast and West Coast to meet the rising demand. Digital tools and fuel management systems are also gaining traction, improving operational efficiency and delivery accuracy.
The Europe Bunkering Services Market size was valued at USD 33,976.80 million in 2018 to USD 39,600.32 million in 2024 and is anticipated to reach USD 60,140.29 million by 2032, at a CAGR of 5.4% during the forecast period. Europe holds a 17% share of the global Bunkering Services Market, driven by robust maritime trade and strong environmental policies. Ports like Rotterdam, Antwerp, and Hamburg are at the forefront of green fueling innovation, offering LNG, biofuels, and hybrid bunkering services. The market is evolving with the EU’s Fit for 55 initiative and FuelEU Maritime strategy, which are pushing the sector toward carbon-neutral shipping. It reflects consistent investment in low-emission infrastructure and smart bunkering technologies. The presence of multinational fuel suppliers and integrated logistics chains adds to market maturity. Regional demand is shifting from traditional fuels to low-sulfur and alternative fuel variants, creating new business models.
The Asia Pacific Bunkering Services Market size was valued at USD 57,330.00 million in 2018 to USD 72,180.11 million in 2024 and is anticipated to reach USD 125,778.88 million by 2032, at a CAGR of 7.2% during the forecast period. Asia Pacific commands the largest share around 40% of the global Bunkering Services Market. It is anchored by high-volume ports in Singapore, Shanghai, and Hong Kong that handle a significant portion of global shipping traffic. The region benefits from strategic geographic positioning and government support for marine fuel supply infrastructure. It is rapidly scaling LNG and methanol bunkering capacities to support decarbonization. Strong economic growth, regional trade, and rising exports are increasing fuel demand from commercial vessels. Ongoing partnerships between energy firms and port authorities are accelerating investments in multi-fuel delivery platforms.
The Latin America Bunkering Services Market size was valued at USD 9,016.80 million in 2018 to USD 10,910.60 million in 2024 and is anticipated to reach USD 16,365.51 million by 2032, at a CAGR of 5.3% during the forecast period. Latin America holds close to 5% share in the global Bunkering Services Market, with growth concentrated in ports across Brazil, Panama, and Mexico. Expanding oil exports and regional shipping routes are supporting bunkering demand in both Atlantic and Pacific corridors. It is undergoing gradual modernization, with select ports introducing cleaner fuel solutions and digital refueling systems. Investment from international fuel suppliers is enhancing regional supply capabilities and improving service standards. Regulatory progress and port upgrades are driving competitiveness. The region has potential for LNG bunkering growth as fleet renewal and decarbonization strategies advance.
The Middle East Bunkering Services Market size was valued at USD 6,396.00 million in 2018 to USD 7,362.80 million in 2024 and is anticipated to reach USD 10,907.91 million by 2032, at a CAGR of 5.1% during the forecast period. The Middle East contributes around 4% of the global Bunkering Services Market, driven by its role as a strategic maritime passage between Europe and Asia. Key ports such as Fujairah and Dubai act as regional refueling hubs, offering competitive pricing and large-scale storage. It has strong availability of conventional marine fuels but is now exploring LNG and hybrid fueling to meet growing demand for sustainability. National oil companies and private operators are collaborating to build future-ready bunkering infrastructure. It faces competition from Asia-Pacific but benefits from regional stability and upstream fuel production. Market growth is steady, supported by port expansion and energy diversification plans.
The Africa Bunkering Services Market size was valued at USD 4,508.40 million in 2018 to USD 6,811.55 million in 2024 and is anticipated to reach USD 9,871.28 million by 2032, at a CAGR of 4.5% during the forecast period. Africa accounts for roughly 3% of the global Bunkering Services Market and is experiencing slow but steady growth. South Africa, Nigeria, and Egypt are emerging as bunkering hotspots, serving both regional and international maritime routes. Infrastructure limitations and inconsistent regulatory enforcement remain barriers to wider adoption of advanced fueling systems. It is beginning to attract investment in fuel storage, quality control, and digital tracking systems. Governments are recognizing the strategic importance of bunkering in port development plans. The opportunity exists to expand services by leveraging natural fuel reserves and aligning with global green shipping trends.
Shape Your Report to Specific Countries or Regions & Enjoy 30% Off!
Key Player Analysis:
- Peninsula Group Limited
- Bunker Holding Group (BH Group)
- Bomin Bunker Holding GmbH & Co. KG
- ExxonMobil Corporation
- Shell plc
- TotalEnergies SE
- Chevron Corporation
- KPI OceanConnect A/S
Competitive Analysis:
The Bunkering Services Market is highly competitive, with a mix of global fuel suppliers, regional operators, and integrated logistics companies vying for market share. Leading players focus on expanding their global footprint through mergers, acquisitions, and long-term partnerships with port authorities and shipping lines. It is characterized by service differentiation based on fuel quality, delivery speed, digital capabilities, and environmental compliance. Companies are investing in cleaner fuel offerings such as LNG and biofuels to align with evolving regulations and customer preferences. The market also sees competition intensify in major port hubs, where large players leverage scale to offer bundled services. Smaller regional providers remain relevant by offering flexible pricing and localized expertise. The competitive landscape is shifting toward integrated service models that combine physical fuel supply with digital platforms and sustainability-focused solutions. This transition supports customer retention while creating barriers for new entrants in established maritime corridors.
Recent Developments:
- In May 2025, Shell completed the acquisition of an increased working interest in the Ursa platform in the Gulf of America, raising its stake from 45.39% to 61.35%. While this acquisition is upstream-focused, it reinforces Shell’s integrated approach to energy supply, including marine fuels.In the lubricants segment.
- In October 2024, Peninsula expanded its physical supply operations for conventional marine fuels by launching new bunkering services in Abu Dhabi and Jebel Ali, complementing its existing presence in Fujairah. This move strengthens Peninsula’s footprint in the Middle East and comes alongside an increased focus on supplying alternative marine fuels, such as LNG and biofuels, in response to tightening emissions regulations.
- In October 2024, Minerva Bunkering, a subsidiary of Mercuria Energy Group, acquired Bomin Bunker Oil from Mabanaft. This acquisition extends Minerva’s operations and supply network across the Americas, notably establishing a physical supply operation in Houston for the first time. Bomin’s assets in the US Gulf Coast, Norfolk, Panama, and Ecuador will now be integrated into Minerva’s global supply chain.
Market Concentration & Characteristics:
The Bunkering Services Market exhibits moderate to high market concentration, with a few dominant players controlling a significant share in major global ports. It features a blend of multinational oil companies, specialized fuel service providers, and regional operators. The market is capital-intensive, driven by infrastructure investments, regulatory compliance, and technological integration. It tends to favor firms with strong port access, diversified fuel portfolios, and advanced digital platforms. Service quality, fuel availability, and adherence to environmental standards shape competitive positioning. The market remains highly dependent on global trade flows, port activity, and shipping regulations. It shows a trend toward consolidation and integration, where established players expand through strategic alliances and acquisitions to strengthen global coverage.
Report Coverage:
The research report offers an in-depth analysis based on fuel type, vessel type, and bunkering method. It details leading market players, providing an overview of their business, product offerings, investments, revenue streams, and key applications. Additionally, the report includes insights into the competitive environment, SWOT analysis, current market trends, as well as the primary drivers and constraints. Furthermore, it discusses various factors that have driven market expansion in recent years. The report also explores market dynamics, regulatory scenarios, and technological advancements that are shaping the industry. It assesses the impact of external factors and global economic changes on market growth. Lastly, it provides strategic recommendations for new entrants and established companies to navigate the complexities of the market.
Future Outlook:
- LNG and biofuel bunkering will expand significantly, driven by global emission regulations and fleet transitions.
- Digital platforms and AI-based fuel management systems will become standard across major bunkering hubs.
- Consolidation among service providers will increase, enhancing operational efficiency and global reach.
- Ports in Asia Pacific will lead infrastructure upgrades to support multi-fuel capabilities.
- Carbon pricing mechanisms and decarbonization policies will reshape fuel sourcing and delivery models.
- Offshore bunkering and floating storage units will gain traction in congested or remote shipping lanes.
- Demand for dual-fuel vessels will rise, prompting investment in flexible refueling infrastructure.
- Strategic public-private partnerships will improve fuel supply resilience in emerging economies.
- Quality assurance protocols and digital documentation will reduce disputes and enhance transparency.
- Bunkering services will play a key role in supporting green shipping corridors and low-emission trade routes.


