
Market Overview
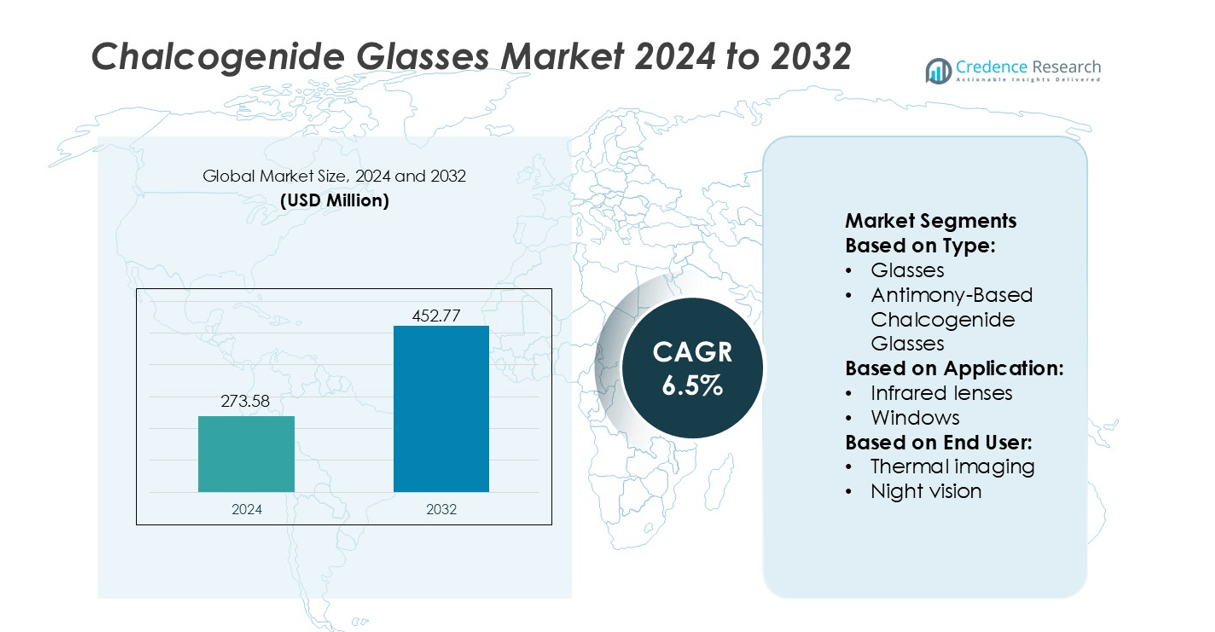
Chalcogenide Glasses Market size was valued USD 273.58 million in 2024 and is anticipated to reach USD 452.77 million by 2032, at a CAGR of 6.5% during the forecast period.
| REPORT ATTRIBUTE | DETAILS |
|---|---|
| Historical Period | 2020-2023 |
| Base Year | 2024 |
| Forecast Period | 2025-2032 |
| Chalcogenide Glasses Market Size 2024 | USD 273.58 million |
| Chalcogenide Glasses Market, CAGR | 6.5% |
| Chalcogenide Glasses Market Size 2032 | USD 452.77 million |
The chalcogenide glasses market includes major participants such as De Rigo Vision S.p.A., HOYA Corporation, Johnson & Johnson Vision Care Inc., CHARMANT INC., Marchon Eyewear Inc., Fielmann AG, CooperVision Limited, ESSILORLUXOTTICA, JINS Inc., and CHEMIGLAS CORPORATION. These companies focus on advanced optical materials, infrared components, and fiber technologies used in defense, medical devices, spectroscopy, and photonic systems. Leading manufacturers invest in precision molding, thin-film coatings, and high-purity glass formulations to enhance transmission performance and thermal stability. Strategic partnerships with research institutes and semiconductor companies support development of custom glass compositions for sensors, lasers, and integrated photonics. Asia-Pacific remains the leading region with 34% market share, driven by strong electronics production, expanding telecom infrastructure, and adoption of IR imaging across automotive, industrial, and surveillance applications.
Market Insights
- The Chalcogenide Glasses Market was valued at USD 273.58 million in 2024 and will reach USD 452.77 million by 2032 at a 6.5% CAGR, driven by growing demand for infrared optics and photonics.
- Rising deployment of infrared cameras, fiber sensors, spectroscopy tools, and medical imaging devices is a major market driver, supported by advanced manufacturing and strong R&D funding.
- Key players focus on thin-film coatings, precision molding, custom wavelength designs, and semiconductor partnerships to strengthen competitive positioning across industrial and defense sectors.
- High material cost, complex fabrication, and dependence on specialized raw materials act as restraints, mainly affecting small-scale producers and limiting production flexibility.
- Asia-Pacific leads with 34% market share, followed by North America and Europe, while fiber-optic components hold a significant segment share due to expanding telecom networks, data-center growth, and adoption of mid-IR photonics in autonomous and industrial applications.
Market Segmentation Analysis:
By Type
Among type segments, Glasses dominate the market with a strong preference for As-Se due to its superior infrared transmission and thermal stability. As-Se glasses are widely used in high-performance optical and fiber applications because they maintain low optical loss across 1–15 µm wavelengths. For instance, commercial suppliers report that As-Se fibers achieve attenuation as low as 0.5 dB/m at 10.6 µm, supporting precise infrared imaging and sensing. Antimony- and gallium-based glasses show growth in specialized applications like photonic devices, but As-Se retains the largest market share due to its versatility and scalability in industrial production.
- For instance, Johnson & Johnson Vision reported that their ACUVUE OASYS MAX 1-Day for Astigmatism lenses showed that 62% of wearers preferred the lens for overall vision versus 18% preferring the competitor lens in a head-to-head study.
By Application
In applications, Optical components lead the market, with Infrared lenses being the dominant sub-segment. Infrared lenses made from chalcogenide glasses provide high refractive indices, low dispersion, and excellent thermal stability, crucial for defense and industrial imaging systems. For instance, suppliers such as Umicore report lens fabrication achieving surface roughness below 2 nm, enhancing infrared clarity. Fiber optics follow closely, with infrared fibers expanding for sensing and communication, while phase change memory and photonic integrated circuits grow in niche electronics sectors. The dominance of optical components is driven by demand for high-precision imaging and sensor technologies.
- For instance, CHARMANT INC. uses titanium alloy frames engineered through its EXCELLENCE TITANIUM process, achieving elastic recovery of up to 98% after mechanical flex tests and maintaining frame weight as low as 9.1 g.
By End User
The Defense and Security sector leads end-user adoption, primarily through Thermal Imaging applications. Chalcogenide-based infrared lenses and fibers improve night vision and surveillance capabilities by providing high sensitivity in the 3–12 µm range. For instance, manufacturers like Lumerical achieve infrared sensor arrays with 15 µm pixel pitch, enhancing detection resolution. Healthcare and industrial users adopt chalcogenide glasses for imaging, diagnostics, and process monitoring, but defense remains dominant due to continuous investment in advanced thermal and optical technologies. This drives consistent demand for large-scale production and innovation in chalcogenide materials.
Key Growth Drivers
Rising Adoption in Infrared Optics and Defense
Defense and homeland security agencies use chalcogenide glasses for thermal imaging, night-vision systems, and advanced infrared optics. These glasses deliver high refractive index, wide transparency range, and lower processing temperatures than germanium, which helps reduce system cost. Growth in border surveillance, drones, and smart weapon systems boosts demand for precision IR lenses and windows. Increasing deployment of thermal cameras in firefighting, industrial inspection, and automotive safety further accelerates commercial volumes.
- For instance, Edmund Optics and other optics suppliers offer high-purity sapphire optical components, which can achieve very low surface roughness (below 0.3 nm RMS with super-polishing) and high transmittance (over 99.8% with appropriate anti-reflective coatings) at wavelengths such as 1,064 nm.
Advancements in Integrated Photonics
Expanding need for faster and energy-efficient data transmission accelerates the use of chalcogenide glasses in photonic integrated circuits. Their high nonlinearity and fast optical response enable compact waveguides, resonators, and modulators for telecom and data center networks. The material supports on-chip light routing and phase change functionality, helping reduce size and power use compared to traditional photonic components. Ongoing R&D in silicon-compatible processes supports mass-production strategies and wider commercial scalability.
- For instance, CooperVision clariti® 1 day multifocal 3 Add lens is available in power ranges from +8.00 D to −12.00 D. It also achieved a fitting success rate of 98%, with patients using two lens pairs or fewer in a clinical trial.
Growing Use in Phase Change Memory Devices
Chalcogenide materials play a central role in non-volatile phase change memory. Electronics and computing companies invest in these materials to support high-speed switching and greater endurance for next-generation storage hardware. Their reversible solid-to-amorphous transitions deliver faster read-write cycles than flash technology and support long data retention. Expanding AI servers, edge computing, and IoT devices increase demand for memory architectures with low power draw and stable performance, strengthening industrial adoption.
Key Trends & Opportunities
Miniaturization and 3D Sensing Technologies
Consumer electronics and autonomous systems adopt miniaturized IR sensors, compact LiDAR, and depth-sensing modules, creating opportunities for chalcogenide-based lenses and waveguides. Smartphone OEMs use these materials in facial recognition and AR systems that operate under low-light conditions. Compact manufacturing methods enable thin-film designs suited for high-resolution thermal cameras. Growth in gesture control, robotics, and machine vision increases long-term commercial demand.
- For instance, Encirc, a leading glass manufacturer, collaborated with Belu Mineral Water to optimize their packaging. Through new techniques and the production of lighter containers, Encirc produced a 750ml bottle that was 70g lighter than the previous Belu design.
Shift Toward Sustainable Manufacturing
Producers focus on cleaner melting processes, recycling of glass scrap, and controlled volatile emissions. Research centers test low-energy fabrication techniques and additive manufacturing to reduce waste and improve yield. Industries adopt precision molding and roll-to-roll processing to cut production time and improve uniformity in optical components. These improvements lower cost barriers for consumer applications, expanding usage across healthcare imaging, industrial monitoring, and smart city infrastructure.
- For instance, Ardagh commissioned its NextGen hybrid furnace in Obernkirchen, achieving a 64 % reduction in emissions per bottle at that line.It built a hydrogen electrolyser in Limmared (Sweden) to feed low-carbon hydrogen into its glass melting system.
Key Challenges
High Material and Production Costs
Chalcogenide glass fabrication requires strict thermal control and advanced purification steps. Specialized coatings, molding equipment, and toxic-element handling add cost for producers and end-users. Limited large-scale manufacturing capacity restricts economies of scale, increasing product prices for cameras, sensors, and photonics modules. These issues make low-cost alternatives like germanium, silicon, and polymers more attractive in some applications, especially in consumer markets with price sensitivity.
Handling and Environmental Regulations
Some chalcogenide glasses contain elements such as arsenic and selenium that require safe disposal and restricted workplace exposure. Compliance with environmental standards raises operational complexity and waste-management costs for manufacturers. Regulatory scrutiny is growing as markets expand into medical imaging, consumer electronics, and automotive sectors. Producers must invest in safer formulations and improved processing technologies to maintain long-term adoption in regulated industries.
Regional Analysis
North America
North America holds 29% share of the chalcogenide glasses market, driven by strong investment in infrared optics, defense imaging, and sensor technologies. The region benefits from advanced aerospace programs and strict military specifications that require high-performance infrared materials. U.S. research labs and photonics companies continue to develop mid-wave and long-wave IR components for thermal cameras, night-vision systems, and space-grade sensors. Canada supports demand with growing fiber-optic sensing and geological monitoring needs. Strong collaboration between universities, defense agencies, and photonics firms supports faster commercialization of new chalcogenide glass compositions with improved thermal stability and transmission efficiency.
Europe
Europe accounts for 24% share and remains a key hub for fiber-optic innovations, laser technologies, spectroscopy instruments, and precision imaging. Demand increases across Germany, France, the U.K., and Switzerland due to advanced research investments and industrial automation. European photonics companies use chalcogenide glasses in medical diagnostics, atmospheric gas detection, and machine-vision systems. Rising semiconductor research and chip-level optical components support stronger adoption for integrated photonics. Aerospace and automotive manufacturers also deploy IR sensors for autonomous systems, emissions analysis, and engine diagnostics. EU-backed funding programs strengthen local manufacturing capacity and reduce dependence on imported infrared materials.
Asia-Pacific
Asia-Pacific leads the global market with 34% share, supported by rapid expansion of electronics manufacturing, fiber-optic communication networks, and semiconductor fabrication. China, Japan, and South Korea invest in infrared imaging, LiDAR, and photonic integrated circuits for consumer electronics, automotive, and industrial automation. Manufacturers scale production of mid-IR fibers and lenses for security surveillance and smart-city systems. India and Southeast Asian regions adopt chalcogenide-based fiber sensors for oil, gas, and chemical industries. Growing demand for low-loss materials in telecom and data-center networks strengthens regional consumption. Strong government research initiatives accelerate development of new chalcogenide compositions for advanced photonics.
Latin America
Latin America holds 6% share and shows steady growth, mainly driven by expanding industrial automation, mining, and energy infrastructure. Governments across Brazil, Argentina, and Chile deploy infrared sensing systems for safety monitoring, pipeline inspection, and geological surveys. Research institutions increase adoption of mid-IR spectroscopy for chemical, agricultural, and environmental analysis. Import dependence remains high, leading to limited domestic production; however, partnerships with U.S. and European photonics suppliers support access to high-precision components. Rising fiber-optic network deployment and data-center expansion are expected to increase demand for chalcogenide-based optical fibers and infrared connectors.
Middle East & Africa
The Middle East & Africa region holds 7%, supported by solid demand for infrared surveillance, oil-field monitoring, and border security systems. The UAE, Saudi Arabia, and Israel invest in thermal imaging, fiber-optic sensing, and gas detection technologies for industrial safety and defense. Chalcogenide glasses gain traction in infrared spectroscopy for petrochemical analysis and pipeline leakage monitoring. African nations adopt fiber-optic sensors in mining and power infrastructure. Although local manufacturing capacity is limited, rising defense spending and smart-infrastructure projects create a high-value market for imported mid-IR lenses, fibers, and photonic components.
Market Segmentations:
By Type:
- Glasses
- Antimony-Based Chalcogenide Glasses
By Application:
- Infrared lenses
- Windows
By End User:
- Thermal imaging
- Night vision
By Geography
- North America
- U.S.
- Canada
- Mexico
- Europe
- Germany
- France
- U.K.
- Italy
- Spain
- Rest of Europe
- Asia Pacific
- China
- Japan
- India
- South Korea
- South-east Asia
- Rest of Asia Pacific
- Latin America
- Brazil
- Argentina
- Rest of Latin America
- Middle East & Africa
- GCC Countries
- South Africa
- Rest of the Middle East and Africa
Competitive Landscape
The competitive landscape of the Chalcogenide Glasses Market includes De Rigo Vision S.p.A., HOYA Corporation, Johnson & Johnson Vision Care Inc., CHARMANT INC., Marchon Eyewear Inc., Fielmann AG, CooperVision Limited, ESSILORLUXOTTICA, JINS Inc., and CHEMIGLAS CORPORATION. The chalcogenide glasses market remains highly competitive due to strong innovation, rising demand for infrared optics, and the push toward integrated photonic solutions. Manufacturers invest in advanced glass formulations with wider transmission windows, improved chemical durability, and higher thermal stability to meet the needs of defense imaging, spectroscopy, fiber sensing, and medical equipment. Many companies focus on scalable manufacturing, including precision molding, automated casting, and thin-film coating technologies, to reduce production costs and deliver consistent optical quality. Partnerships with semiconductor foundries and research institutes accelerate development of chalcogenide-based components for data centers, LiDAR, and space instruments. Several producers expand global footprints with new R&D centers, distribution networks, and acquisitions in Asia-Pacific and North America. Customization for wavelength-specific applications strengthens competitive positioning, while sustainability goals encourage eco-friendly material processing and waste reduction. Overall, competition is driven by technology upgrades, specialty glass performance, and the ability to supply high-precision infrared components at commercial scale.
Key Player Analysis
- De Rigo Vision S.p.A.
- HOYA Corporation
- Johnson & Johnson Vision Care Inc.
- CHARMANT INC.
- Marchon Eyewear Inc.
- Fielmann AG
- CooperVision Limited
- ESSILORLUXOTTICA
- JINS Inc.
- CHEMIGLAS CORPORATION
Recent Developments
- In April 2025, Bruker Corporation has developed the world's first 1.3 GHz high-resolution Nuclear Magnetic Resonance (NMR) spectrometer, which features a 30.5 Tesla superconducting magnet with a new ReBCO high-temperature superconductor (HTS) insert.
- In February 2025, EssilorLuxottica announced plans to increase its smart glasses production capacity to 10 million units annually by the end of 2026, expanding manufacturing in China and Southeast Asia. The company aims to enhance its collaboration with Meta and integrate additional third-party brands and features into its smart eyewear platform.
- In February 2025, Innovative Eyewear unveiled its Reebok Smart Eyewear line at MIDO 2025 in Milan, introducing sport-focused frames with open-ear audio, voice assistant integration, and customizable lenses. The collection features upgraded hi-fi speakers and amplifiers for enhanced sound quality, catering to active lifestyles
Report Coverage
The research report offers an in-depth analysis based on Type, Application, End-User and Geography. It details leading market players, providing an overview of their business, product offerings, investments, revenue streams, and key applications. Additionally, the report includes insights into the competitive environment, SWOT analysis, current market trends, as well as the primary drivers and constraints. Furthermore, it discusses various factors that have driven market expansion in recent years. The report also explores market dynamics, regulatory scenarios, and technological advancements that are shaping the industry. It assesses the impact of external factors and global economic changes on market growth. Lastly, it provides strategic recommendations for new entrants and established companies to navigate the complexities of the market.
Future Outlook
- Demand will rise for infrared imaging systems used in defense, aerospace, and surveillance.
- Telecom and data-center expansion will boost adoption of chalcogenide-based fiber optics.
- Photonic integrated circuits will create new opportunities for compact, chip-level optical devices.
- Growth in LiDAR and autonomous vehicles will increase need for mid-infrared components.
- Medical imaging and spectroscopy applications will drive investment in high-purity glass formulations.
- Manufacturers will expand automated casting, molding, and coating processes to scale production.
- Research partnerships will accelerate development of glasses with higher thermal stability.
- Asia-Pacific will remain a major production and consumption hub due to strong electronics manufacturing.
- Custom, wavelength-specific glass designs will support niche industrial and scientific uses.
- Sustainability targets will encourage cleaner processing and lower-waste material engineering.

Request a Free Sample
Fill in your details and we'll send you a free sample report.
- Sample data tables & charts
- Research methodology
Need a Custom Version of This Report?
Tailor the scope, geography, or segments to your exact requirements.
- Custom geography or segment scope
- Direct access to our analyst team
Frequently Asked Questions
What is the current market size for the Chalcogenide Glasses Market, and what is its projected size in 2032?
At what Compound Annual Growth Rate is the Chalcogenide Glasses Market projected to grow between 2025 and 2032?
Which Chalcogenide Glasses Market segment held the largest share in 2024?
What are the primary factors fueling the growth of the Chalcogenide Glasses Market?
Who are the leading companies in the Chalcogenide Glasses Market?
Table of Content
Chapter 1. Report Introduction
- 1.1 Report Description & Purpose
- 1.1.1 Report Title & Market Definition
- 1.1.2 Unique Selling Propositions (USP) & Key Differentiators
- 1.1.3 Value Proposition for Stakeholders
- 1.2 Research Objectives
- 1.2.1 Market Sizing Objectives (Volume & Revenue) (Volume Where Applicable)
- 1.2.2 Segmentation Objectives
- 1.2.3 Competitive Intelligence Objectives
- 1.2.4 Forecast & Scenario Objectives
- 1.3 Report Scope
- 1.3.1 Chalcogenide Glasses Scope – Segments & Subsegments Covered
- 1.3.2 Geographic Scope – Regions & Countries Covered
- 1.3.3 Historical Period, Base Year & Forecast Period (2024; forecast to 2032)
- 1.3.4 Inclusions & Exclusions
- 1.4 Industry Classification & Applicable Codes
- 1.5 Currency, Measurement Units & Valuation Basis
- 1.6 Target Stakeholders
- 1.7 Limitations & Assumptions
Chapter 2. Executive Summary
- 2.1 Global Chalcogenide Glasses Market Snapshot
- 2.1.1 Market Size – Historical (2024) & Forecast (2024-2032) (2024: USD 273.58 million → 2032: USD 452.77 million)
- 2.1.2 Volume & Revenue – Global Totals (Volume Where Applicable)
- 2.1.3 Key Market Highlights – Top Five Facts
- 2.2 Chalcogenide Glasses Market Segmentation Snapshot
- 2.2.1 Market Split by Region – 2024 vs. 2032
- 2.3 Competitive Snapshot
- 2.3.1 Top 10 Players by Revenue Share – 2024
- 2.3.2 Top 10 Players by Volume Share – 2024 (Volume Where Applicable)
- 2.3.3 Recent Strategic Developments (18-Month Summary)
- 2.4 Key Investment Highlights & Strategic Conclusions
Chapter 3. Chalcogenide Glasses Market Dynamics & Industry Analysis
- 3.1 Market Overview & Context
- 3.1.1 Chalcogenide Glasses Market Position in the Broader Industry Value Chain
- 3.1.2 Demand Structure & Purchasing Dynamics
- 3.1.3 Market Maturity & Development Stage by Region
- 3.2 Chalcogenide Glasses Market Drivers
- 3.3 Chalcogenide Glasses Market Restraints & Challenges
- 3.4 Chalcogenide Glasses Market Opportunities
- 3.5 Porter's Five Forces Analysis
- 3.5.1 Threat of New Entrants
- 3.5.2 Bargaining Power of Suppliers
- 3.5.3 Bargaining Power of Buyers
- 3.5.4 Threat of Substitutes
- 3.5.5 Competitive Rivalry – Intensity Assessment
- 3.6 Chalcogenide Glasses Value Chain Analysis
- 3.6.1 Upstream – Key Inputs, Resources & Suppliers
- 3.6.1.1 Key Input/Resource 1
- 3.6.1.2 Key Input/Resource 2
- 3.6.1.3 Key Input/Resource 3
- 3.6.2 Midstream – Core Operations & Value Creation
- 3.6.2.1 Operating Model & Process Overview
- 3.6.2.2 Key Operating Locations & Capabilities by Company
- 3.6.3 Downstream – Market Channels & End Users
- 3.6.3.1 Direct Sales & Customer Engagement Channels
- 3.6.3.2 Indirect Sales, Intermediaries & Partner Channels
- 3.6.4 Value Chain Profitability Analysis
- 3.6.1 Upstream – Key Inputs, Resources & Suppliers
- 3.7 PESTEL Analysis
- 3.7.1 Political Factors
- 3.7.2 Economic Factors
- 3.7.3 Social Factors
- 3.7.4 Technological Factors
- 3.7.5 Environmental Factors
- 3.7.6 Legal Factors
- 3.8 Chalcogenide Glasses Supply Chain Analysis
- 3.8.1 Critical Input & Resource Availability Risk Assessment
- 3.8.2 Supplier & Operational Concentration Risk (Geographic Exposure)
- 3.8.3 Supply & Service Disruption Impact Analysis
- 3.9 Regulatory & Policy Landscape
Note: The regulatory and policy landscape section covers regulations based on their applicability to the market, Chalcogenide Glasses category, geography, and scope of the study. Only regulatory frameworks with a material impact on operations, compliance, trade, sustainability, or market access are analyzed in detail.
Chapter 4. Key Investment Pockets & Opportunity Analysis
- 4.1 Chalcogenide Glasses Market Attractiveness Analysis
- 4.1.1 By Region – Investment Attractiveness Matrix (Market Size × CAGR)
- 4.2 Absolute Revenue Growth Opportunity
- 4.2.1 By Region – Absolute Revenue Growth Through 2032
- 4.3 Incremental Demand Opportunity
- 4.3.1 By Region – Incremental Demand Through 2032
- 4.3.2 Segment – Incremental Demand
- 4.4 Emerging Submarket Opportunity Deep Dive (Subject to Applicability)
- 4.5 Priority Market Opportunity Scorecards
- 4.5.1 United States
- 4.5.2 Europe
- 4.5.3 Asia
- 4.5.4 Middle East & Africa
Note: Priority market opportunity scorecards reflect the geographic scope and strategic relevance of the study. Listed markets are indicative and may be adapted to the industry.
Chapter 5. Chalcogenide Glasses Cross-Border Trade & Market Access Analysis
- 5.1 International Trade & Cross-Border Activity Overview
- 5.1.1 Global Export Value by Country (2024)
- 5.1.2 Global Export Volume by Country (2024) (Volume Where Applicable)
- 5.1.3 Global Import Value by Country (2024)
- 5.1.4 Global Import Volume by Country (2024) (Volume Where Applicable)
- 5.1.5 Net Trade Balance by Country (2024)
- 5.2 Export Analysis – Segment
- 5.2.1 Category 1 (Applicable Classification Code)
- 5.2.2 Category 2 (Applicable Classification Code)
- 5.2.3 Category 3 (Applicable Classification Code)
- 5.2.4 Category 4 (Applicable Classification Code)
- 5.2.5 Category 5 (Applicable Classification Code)
- 5.3 Import Analysis – Segment
- 5.3.1 Category 1 (Applicable Classification Code)
- 5.3.2 Category 2 (Applicable Classification Code)
- 5.3.3 Category 3 (Applicable Classification Code)
- 5.3.4 Category 4 (Applicable Classification Code)
- 5.3.5 Category 5 (Applicable Classification Code)
- 5.4 Cross-Border Pricing & Transaction Benchmarks
- 5.4.1 Export Pricing – Segment & Country
- 5.4.2 Import Pricing – Segment & Source Country
- 5.4.3 Price Trends (2024)
- 5.5 Key Cross-Border Trade & Delivery Routes
- 5.5.1 Cross-Border Trade/Delivery Route 1
- 5.5.2 Cross-Border Trade/Delivery Route 2
- 5.5.3 Cross-Border Trade/Delivery Route 3
- 5.5.4 Cross-Border Trade/Delivery Route 4
- 5.5.5 Cross-Border Trade/Delivery Route 5
- 5.6 Trade Policy & Market Access Impact Assessment
- 5.6.1 Tariff & Non-Tariff Barriers
- 5.6.2 Regional Trade & Economic Integration Frameworks
- 5.6.3 Bilateral & Multilateral Trade Agreements
- 5.6.4 Cross-Border Operating, Licensing & Localization Requirements
Note: This chapter applies where cross-border trade or delivery is relevant to Chalcogenide Glasses. Goods, services, and digital offerings are assessed using applicable classifications and transaction measures. Import-export volumes, trade balances, and route analyses are included only where meaningful to the market.
Chapter 6. Competitive Landscape & Company Benchmarking
- 6.1 Chalcogenide Glasses Market Concentration & Structure
- 6.1.1 Herfindahl-Hirschman Index (HHI) – vs. 2024
- 6.1.2 Leading, Mid-Sized & Emerging Player Structure
- 6.1.3 Global, Regional & Local Player Dynamics
- 6.2 Chalcogenide Glasses Market Share Analysis – 2024
- 6.2.1 Global Revenue Share by Company
- 6.2.2 Global Volume Share by Company (Volume Where Applicable)
- 6.2.3 Regional Revenue Share
- 6.2.4 Market Share Evolution ( vs. 2024)
- 6.2.5 Company Market Share by Key Segment
- 6.2.6 Company Market Share by Customer Group
- 6.3 Operating Scale, Capacity & Infrastructure Analysis
- 6.3.1 Global Operating Scale & Supply Capacity
- 6.3.2 Resource Utilization & Operating Efficiency
- 6.3.3 Output, Service Delivery & Activity Metrics
- 6.3.4 Operating Footprint & Infrastructure Map
- 6.3.5 Planned Operational & Capacity Expansion
- 6.4 Chalcogenide Glasses Competitive Benchmarking Matrix
- 6.4.1 Revenue, Growth, Profitability & Operating Metric Comparison
- 6.4.2 Channel Revenue Mix
- 6.4.3 Geographic Revenue Exposure
- 6.4.4 R&D Intensity
- 6.4.5 Sustainability Maturity
- 6.5 Strategic Developments in Chalcogenide Glasses (Last 24 Months)
- 6.5.1 Mergers, Acquisitions & Divestments
- 6.5.2 New Products, Services & Solutions in Chalcogenide Glasses
- 6.5.3 Operational & Infrastructure Expansions
- 6.5.4 Strategic Alliances, Joint Ventures & Partnerships
- 6.5.5 Distribution Expansion & Market Entry
- 6.5.6 Sustainability & ESG Initiatives
- 6.6 Competitive Strategy Mapping
- 6.6.1 Leader, Challenger, Follower & Niche Classification
- 6.6.2 Pricing Strategy Comparison
- 6.6.3 Channel Strategy Matrix
Note: Strategic developments are included based on their materiality and the availability of reliable information.
Chapter 7. Global Chalcogenide Glasses Market – By Sales & Delivery Channel
- 7.1 Segment Overview
- 7.1.1 Volume & Revenue Split by Channel (2024 & 2032) (Volume Where Applicable)
- 7.1.2 Channel Mix Evolution (2024-2032)
Chapter 8. Regional Market Analysis – Global Overview
- 8.1 Global Regional Overview
- 8.1.1 Regional Volume Share (Volume Where Applicable)
- 8.1.2 Regional Revenue Share
- 8.1.3 Regional Volume by Region (Volume Where Applicable)
- 8.1.4 Regional Revenue by Region
- 8.1.5 Regional Forecast Through 2032
- 8.2 Cross-Regional Segment Analysis
- 8.2.1 By Sales & Delivery Channel
- 8.2.2 By Competitive Positioning & Price Tier
Chapter 9. North America Chalcogenide Glasses Market
- 9.1 United States
- 9.2 Canada
- 9.3 Mexico
Chapter 10. Europe Chalcogenide Glasses Market
- 10.1 Germany
- 10.2 France
- 10.3 Italy
- 10.4 United Kingdom
- 10.5 Spain
- 10.6 Poland
- 10.7 Russia
- 10.8 Netherlands
- 10.9 Belgium
- 10.10 Sweden
- 10.11 Denmark
- 10.12 Norway
- 10.13 Rest of Europe
Chapter 11. Asia Pacific Chalcogenide Glasses Market
- 11.1 China
- 11.2 India
- 11.3 Japan
- 11.4 South Korea
- 11.5 Thailand
- 11.6 Indonesia
- 11.7 Vietnam
- 11.8 Malaysia
- 11.9 Australia
- 11.10 Rest of Asia Pacific
Chapter 12. Latin America Chalcogenide Glasses Market
- 12.1 Brazil
- 12.2 Argentina
- 12.3 Colombia
- 12.4 Chile
- 12.5 Rest of Latin America
Chapter 13. Middle East Chalcogenide Glasses Market
- 13.1 Saudi Arabia
- 13.2 United Arab Emirates
- 13.3 Turkey
- 13.4 Israel
- 13.5 Iran
- 13.6 Rest of the Middle East
Chapter 14. Africa Chalcogenide Glasses Market
- 14.1 South Africa
- 14.2 Egypt
- 14.3 Nigeria
- 14.4 Morocco
- 14.5 Rest of Africa
Chapter 15. Chalcogenide Glasses Company Profiles
- 15.1 [Company 01]
- 15.1.1 Company Overview
- 15.1.2 Key Management Personnel
- 15.1.3 Products & Services Portfolio
- 15.1.4 Financial Performance
- 15.1.5 Key Market Focus & Geographic Presence
- 15.1.6 Recent Developments & Strategic Initiatives
Note: The company profile list is preliminary and may change based on research findings, market developments, data availability, and client requirements.
Chapter 16. Appendices
- Appendix A – List of Abbreviations & Acronyms
- Appendix B – Industry Classification Code Reference – Full Series
- Appendix C – Supply, Output & Operating Capacity Data Tables
- Appendix D – End-Use & Demand Base Tables
- Appendix E – Demand, Adoption & Usage Assumptions
- Appendix F – Pricing & Revenue Metric Reference Tables
- Appendix G – Company Operations & Infrastructure Database
- Appendix H – Cross-Border Trade & Activity Data Tables (Where Applicable)
- Appendix I – Regulatory Summary Tables
- Appendix J – Primary Research Participant List (Anonymized)
- Appendix K – Primary Research Questionnaire Framework
- Appendix L – Data Sources & Bibliography
- Appendix M – Market Size Divergence & Source Comparison
Chapter 17. Research Methodology
- 17.1 Research Framework & Philosophy
- 17.2 Secondary Research – Sources, Hierarchy & Data Extraction
- 17.3 Data Modeling – Bottom-Up & Top-Down Market Sizing
- 17.4 Primary Research – Stakeholder Framework, LOI & Sample Sizes
- 17.5 Forecast Methodology – Regression, Scenario & Sensitivity Analysis
- 17.6 Quality Control – Four-Layer Validation Framework
- 17.7 Limitations & Standard Assumptions
- 17.8 Disclaimer
