
3D Printing Photopolymers Market Overview:
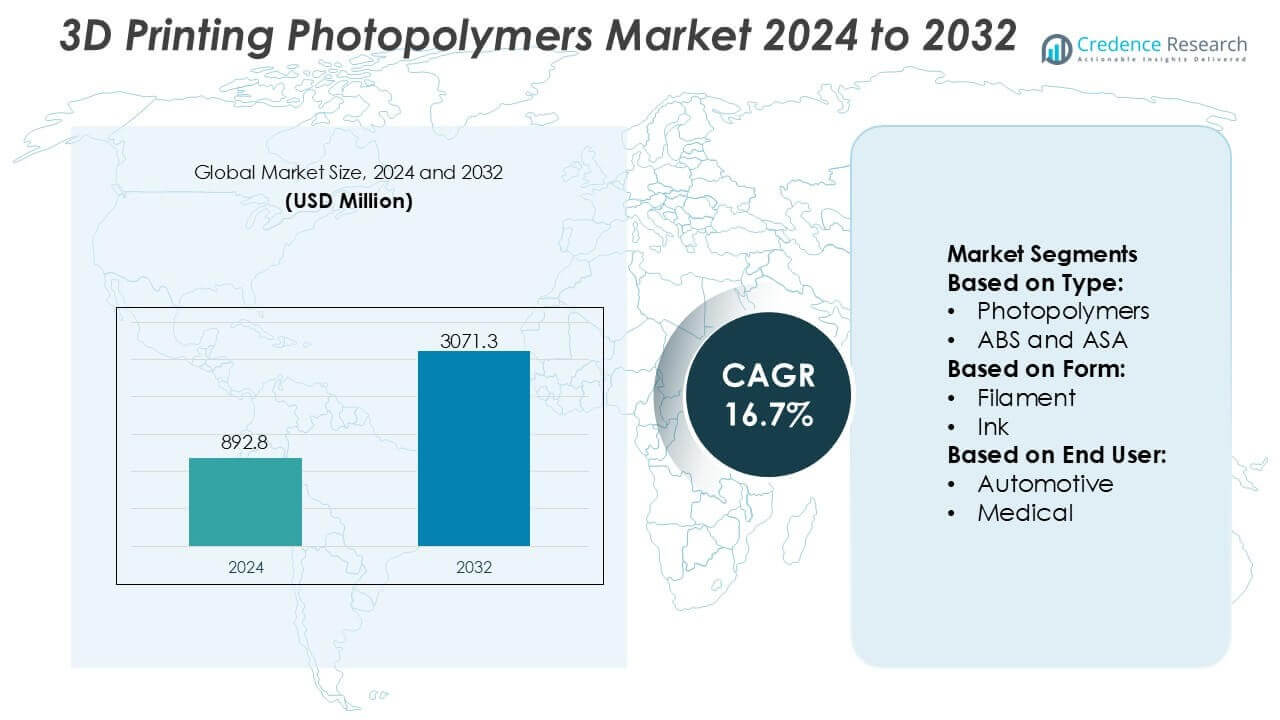
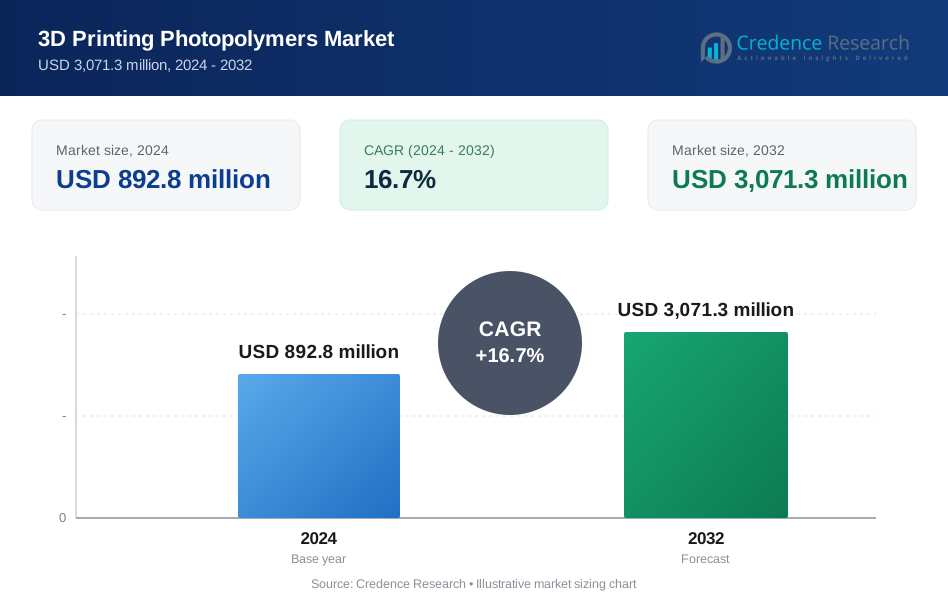
3D Printing Photopolymers Market size was valued USD 892.8 million in 2024 and is anticipated to reach USD 3071.3 million by 2032, at a CAGR of 16.7% during the forecast period.
| REPORT ATTRIBUTE | DETAILS |
|---|---|
| Historical Period | 2020-2023 |
| Base Year | 2024 |
| Forecast Period | 2025-2032 |
| 3D Printing Photopolymers Market Size 2024 | USD 892.8 million |
| 3D Printing Photopolymers Market , CAGR | 16.7% |
| 3D Printing Photopolymers Market Size 2032 | USD 3071.3 million |
3D Printing Photopolymers Market Insights
- Market growth is driven by rising demand for high-precision, light-curable resins offering superior mechanical strength, thermal stability, and surface finish, particularly for functional prototyping, tooling, and end-use part production.
- Key market trends include the shift toward sustainable and low-VOC photopolymers, increasing compatibility with SLA, DLP, and LCD platforms, and growing demand for application-specific resin customization across healthcare and automotive sectors.
- Competitive dynamics are shaped by continuous R&D investment, proprietary resin chemistries, close collaboration with printer OEMs, and expansion of regional manufacturing capabilities to improve supply reliability.
- Regionally, North America dominates with an exact 41% market share, supported by advanced manufacturing infrastructure, while industrial-grade photopolymers remain the leading segment due to their widespread use in high-performance applications.
3D Printing Photopolymers Market Segmentation Analysis:
By Type
By type, photopolymers dominate the 3D Printing Photopolymers Market, accounting for approximately 41% market share due to their superior resolution, smooth surface finish, and rapid curing characteristics in SLA, DLP, and PolyJet technologies. Demand is driven by applications requiring high dimensional accuracy and fine feature reproduction, particularly in medical models and dental components. Polyamide/nylon follows, supported by strength and thermal resistance for functional parts, while ABS and ASA gain traction for impact resistance. Polylactic acid (PLA) remains relevant for prototyping due to biodegradability and ease of processing.
- For instance, Autonomic Materials has developed microencapsulated polymer systems capable of autonomic repair at crack widths below 50 micrometers, with healing reactions initiating in under 10 minutes after fracture, demonstrating the level of precision and functional reliability achievable with advanced photopolymer chemistries.
By Form
By form, ink-based photopolymers hold the dominant position with around 46% market share, driven by their direct compatibility with vat photopolymerization and material jetting systems. Liquid inks enable precise layer control, uniform curing, and minimal material waste, making them essential for high-detail industrial and healthcare applications. Filament-based forms maintain steady adoption in hybrid systems and prototyping workflows due to handling convenience. Powder forms represent a smaller share, primarily used in niche photoreactive composite applications, with growth constrained by limited printer compatibility compared to liquid photopolymer formulations.
- For instance, Merck KGaA supplies high-performance photopolymer resins through its Advanced Materials division, including inks formulated for inkjet and DLP systems that achieve printable layer thicknesses of 20 micrometers and exhibit photoinitiator activation at wavelengths of 365 nm and 405 nm, enabling precise feature definition in microfluidic and biomedical components.
By End-user
By end-user, the medical segment leads the market with nearly 38% market share, driven by increasing adoption of photopolymers for surgical guides, dental models, anatomical replicas, and patient-specific devices. High biocompatibility, sterilization compatibility, and fine-detail accuracy make photopolymers well suited for clinical use. Prosthetics and implants represent the fastest-growing sub-segment as customization demand rises. Automotive applications focus on design validation and tooling, while surgical instruments leverage photopolymers for rapid prototyping and limited-use components, supporting broader healthcare-driven demand expansion.
Key Growth Drivers
Expanding Adoption in Medical and Dental Applications
Rising use of 3D printing in medical and dental workflows is a primary growth driver for photopolymers. These materials offer high resolution, smooth surface finish, and controlled mechanical properties, making them ideal for surgical guides, dental models, aligners, and anatomical replicas. Increasing demand for patient-specific devices and rapid turnaround times in clinical settings accelerates adoption. In addition, continuous improvements in biocompatible and sterilizable photopolymer formulations support broader regulatory acceptance, strengthening long-term demand from hospitals, dental laboratories, and medical device manufacturers.
- For instance, SMP Technologies Inc. has commercialized shape-memory polymer formulations suitable for medical device prototyping that exhibit a programmable glass transition temperature range from 45 °C to 70 °C, shape recovery ratios exceeding 98 units per 100 units of deformation, and repeatable actuation performance over 1,000 thermal cycles, enabling precise fit and functional reliability in customized dental and surgical components.
Advancements in Vat Photopolymerization Technologies
Technological progress in SLA, DLP, and material jetting systems significantly drives photopolymer consumption. Higher light engine efficiency, faster curing speeds, and improved build accuracy enable scalable production rather than simple prototyping. These advancements reduce print times while maintaining precision, improving cost efficiency for manufacturers. Enhanced printer–material compatibility also allows tailored resin properties for strength, flexibility, or heat resistance. As industrial users increasingly adopt high-throughput photopolymer printers, material demand grows in parallel with installed hardware capacity.
- For instance, BASF SE has expanded its Forward AM resin portfolio with Ultracur3D® formulations engineered for vat photopolymerization, including grades that deliver tensile strengths above 80 MPa, heat deflection temperatures up to 200 °C, and curing compatibility with 385 nm and 405 nm light sources, supporting
Demand for High-Precision Prototyping and Tooling
Industries requiring precise visual and functional prototypes increasingly prefer photopolymers over thermoplastics. Automotive, electronics, and consumer goods manufacturers value fine feature resolution, dimensional stability, and aesthetic quality for design validation and low-volume tooling. Photopolymers enable rapid iteration cycles and reduce product development timelines. As companies emphasize faster innovation and reduced time-to-market, investment in photopolymer-based additive manufacturing expands, reinforcing steady material demand across both industrial design studios and contract manufacturing environments.
Key Trends & Opportunities
Development of Functional and Engineering-Grade Photopolymers
A major trend is the shift from purely aesthetic resins toward engineering-grade photopolymers with improved toughness, thermal stability, and chemical resistance. These materials enable end-use parts, jigs, fixtures, and housings, expanding application scope beyond prototyping. Opportunities exist in replacing traditionally machined or molded components in low- to mid-volume production. As resin formulations increasingly mimic thermoplastic performance, adoption grows in automotive interiors, electronics enclosures, and industrial tooling applications.
- For instance, DuPont’s DuPont™ Cyrel® DPI digital flexographic plates deliver printing performance with minimum positive line widths down to 0.050 mm (50 µm) and isolated dot reproduction at 200 µm, while offering plate thickness options ranging from 0.76 mm to 1.70 mm with corresponding durometer hardness from 82 Sh A to 70 Sh A-data drawn directly from DuPont technical product literature.
Rising Focus on Sustainable and Low-Toxicity Resins
Sustainability considerations are shaping material innovation within the photopolymers market. Manufacturers are developing low-odor, low-toxicity, and partially bio-based resins to address environmental and workplace safety concerns. This trend creates opportunities in education, healthcare, and office-based printing environments where material handling safety is critical. Regulatory pressure and corporate sustainability goals further support adoption of eco-friendlier photopolymers, encouraging R&D investment in recyclable formulations and reduced volatile organic compound content.
- For instance, Evonik Industries AG has advanced its INFINAM® photopolymer portfolio with formulations designed for industrial SLA and DLP applications where performance and safety converge, including INFINAM® ST 6100 L, which delivers a tensile strength of 89 MPa, flexural stress of 145 MPa, and heat deflection temperature of 120 °C when cured, representing industrial-grade mechanical performance with processable features for demanding applications.
Growth of Digital Dentistry and Mass Customization
Digital dentistry represents a strong opportunity for photopolymers, driven by widespread adoption of intraoral scanning and chairside manufacturing. High accuracy, smooth finish, and predictable curing behavior make photopolymers essential for dental models, crowns, and orthodontic applications. The broader trend toward mass customization in healthcare and consumer products also benefits photopolymers, as they support efficient production of individualized parts without tooling changes, enhancing scalability and economic viability.
Key Challenges
Material Cost and Post-Processing Complexity
High material costs compared to standard thermoplastics remain a key challenge for photopolymers. In addition, post-processing requirements such as washing, UV curing, and support removal increase labor and operational expenses. These factors limit adoption in cost-sensitive applications and high-volume production. Small and mid-sized manufacturers may hesitate to invest due to total cost of ownership concerns, slowing penetration outside premium or high-value use cases despite performance advantages.
Limited Long-Term Mechanical and Environmental Stability
Photopolymers often face challenges related to long-term durability, including UV sensitivity, brittleness over time, and limited resistance to heat or moisture compared to traditional engineering plastics. These constraints restrict use in demanding outdoor or structural applications. Although material science advances continue to improve performance, concerns about aging behavior and reliability slow adoption for critical end-use components, particularly in automotive and industrial environments requiring extended service life.
Regional Analysis
North America
North America leads the 3D Printing Photopolymers Market with an estimated 38% market share, driven by early technology adoption, strong R&D investment, and advanced manufacturing infrastructure across the United States and Canada. The region benefits from widespread use of photopolymer-based additive manufacturing in aerospace, medical devices, dental applications, and automotive prototyping. High demand for precision parts, rapid prototyping, and customized healthcare solutions continues to support photopolymer consumption. Additionally, the presence of major 3D printing technology developers, material innovators, and service bureaus accelerates commercialization of high-performance resins, reinforcing North America’s dominant position in both volume and value terms.
Europe
Europe accounts for approximately 27% of the global market share, supported by strong industrial manufacturing, automotive engineering, and medical technology sectors across Germany, France, the UK, and Italy. The region emphasizes high-accuracy and functional photopolymer materials for tooling, dental models, and industrial end-use components. Strict quality standards and regulatory frameworks drive demand for advanced, certified photopolymer formulations with improved mechanical and thermal properties. Europe also benefits from close collaboration between research institutes and manufacturers, accelerating material innovation. Growing adoption of additive manufacturing in sustainable production and lightweight component design further sustains steady photopolymer demand across the region.
Asia-Pacific
Asia-Pacific holds nearly 29% market share and represents the fastest-expanding regional market due to rapid industrialization, expanding electronics manufacturing, and increasing adoption of additive manufacturing in China, Japan, South Korea, and India. Cost-effective production capabilities, rising investments in smart manufacturing, and government support for advanced manufacturing technologies drive photopolymer usage. The region shows strong demand for photopolymers in consumer electronics, automotive components, and healthcare devices. Expanding local 3D printer installations and growing availability of domestically produced photopolymer resins further strengthen market penetration, positioning Asia-Pacific as a key growth engine over the forecast period.
Latin America
Latin America captures around 4% of the global market share, with growth primarily driven by Brazil and Mexico. The region is gradually adopting 3D printing photopolymers for industrial prototyping, tooling, and customized medical applications. Increasing awareness of additive manufacturing benefits among small and mid-sized manufacturers supports moderate demand growth. However, limited local material production and reliance on imports constrain large-scale adoption. Ongoing investments in automotive manufacturing, aerospace maintenance, and dental laboratories are improving photopolymer utilization, while expanding technical education and digital manufacturing initiatives are expected to strengthen the region’s market presence over time.
Middle East & Africa
The Middle East & Africa region accounts for approximately 2% market share, reflecting early-stage adoption of 3D printing photopolymers. Demand is concentrated in the UAE, Saudi Arabia, and South Africa, where additive manufacturing supports construction modeling, aerospace maintenance, healthcare applications, and industrial prototyping. Government-led initiatives promoting digital manufacturing and smart infrastructure are key growth drivers. Although limited local resin production and high material costs restrict widespread usage, increasing investments in advanced manufacturing hubs and healthcare infrastructure are gradually expanding photopolymer adoption, positioning the region for incremental long-term growth.
3D Printing Photopolymers Market Segmentations:
By Type:
- Photopolymers
- ABS and ASA
By Form:
- Filament
- Ink
By End User:
- Automotive
- Medical
By Geography
- North America
- U.S.
- Canada
- Mexico
- Europe
- Germany
- France
- U.K.
- Italy
- Spain
- Rest of Europe
- Asia Pacific
- China
- Japan
- India
- South Korea
- South-east Asia
- Rest of Asia Pacific
- Latin America
- Brazil
- Argentina
- Rest of Latin America
- Middle East & Africa
- GCC Countries
- South Africa
- Rest of the Middle East and Africa
Competitive Landscape
The competitive landscape of the 3D Printing Photopolymers Market players such as Autonomic Materials, Covestro AG, Merck KGaA, SMP Technologies Inc., BASF SE, Akina, Inc., DuPont, Evonik Industries AG, The Lubrizol Corporation, Huntsman International LLC. the 3D Printing Photopolymers Market is characterized by intense competition driven by rapid material innovation, application-specific customization, and performance differentiation.
Market participants focus on advancing resin chemistries that enhance mechanical strength, thermal resistance, surface finish, and curing efficiency to meet the evolving demands of industrial additive manufacturing. Strong emphasis is placed on developing photopolymers compatible with multiple printing technologies, including SLA, DLP, and LCD systems, to broaden addressable applications. Sustainability has emerged as a critical competitive factor, with increasing investments in low-VOC formulations, recyclable materials, and bio-based photopolymers aligned with regulatory and environmental expectations.
Strategic collaborations with printer manufacturers, software developers, and end-use industries support faster material validation and commercial adoption. In parallel, companies pursue process optimization, intellectual property development, and regional production expansion to improve supply reliability, reduce lead times, and maintain long-term competitive advantage in a rapidly maturing market.
Key Player Analysis
- Autonomic Materials
- Covestro AG
- Merck KGaA
- SMP Technologies Inc.
- BASF SE
- Akina, Inc.
- DuPont
- Evonik Industries AG
- The Lubrizol Corporation
- Huntsman International LLC.
Recent Developments
- In May 2025, Siraya Tech launched three new flexible 3D printing materials: TPU Air, a tunable foaming filament for lightweight parts (Shore 63A-85A); TPU 64D, a more rigid, biocompatible, AMS-compatible filament; and Rebound 55A, a highly flexible and elastic resin, expanding their elastomer offerings for diverse applications.
- In March 2025, Stratasys today announced the launch of AIS™ Antero® 800NA and AIS™ Antero 840CN03 as validated materials for the Stratasys F900®, marking a new milestone in qualified additive manufacturing for aerospace, defense, and other highly regulated industries.
- In February 2025, NatureWorks launched Ingeo 3D300 a high-performance PLA filament for 3D printing that enables much faster speeds (up to 300 mm/s) without sacrificing quality, clarity, or detail, reducing print times and costs for prototyping and functional parts, and offering easier color matching due to its transparency, making it a significant advance in sustainable additive manufacturing.
Report Coverage
The research report offers an in-depth analysis based on Type, Form, End-User and Geography. It details leading market players, providing an overview of their business, product offerings, investments, revenue streams, and key applications. Additionally, the report includes insights into the competitive environment, SWOT analysis, current market trends, as well as the primary drivers and constraints. Furthermore, it discusses various factors that have driven market expansion in recent years. The report also explores market dynamics, regulatory scenarios, and technological advancements that are shaping the industry. It assesses the impact of external factors and global economic changes on market growth. Lastly, it provides strategic recommendations for new entrants and established companies to navigate the complexities of the market.
Future Outlook
- Adoption of high-performance photopolymers will accelerate as end users demand greater strength, heat resistance, and long-term durability in printed parts.
- Integration of photopolymers with faster curing and higher printing speeds will support scalable industrial production.
- Sustainability-focused formulations, including low-VOC and bio-based resins, will gain wider acceptance across regulated industries.
- Compatibility with multiple printing platforms will remain a key focus to ensure flexible deployment across diverse manufacturing environments.
- Advancements in resin chemistry will improve surface finish, dimensional accuracy, and functional performance of printed components.
- Custom photopolymer development tailored to specific applications will increase differentiation among material suppliers.
- Growing use in healthcare, dental, automotive, and electronics sectors will expand the application base.
- Digital material validation and simulation tools will reduce development cycles and accelerate commercialization.
- Regional manufacturing expansion will strengthen supply reliability and reduce lead times for industrial customers.
- Collaboration across printer, material, and software ecosystems will drive standardized workflows and broader market adoption.
Request a Free Sample
Fill in your details and we'll send you a free sample report.
- Sample data tables & charts
- Research methodology
Need a Custom Version of This Report?
Tailor the scope, geography, or segments to your exact requirements.
- Custom geography or segment scope
- Direct access to our analyst team
Frequently Asked Questions
What is the current market size for the 3D Printing Photopolymers Market, and what is its projected size in 2032?
At what Compound Annual Growth Rate is the 3D Printing Photopolymers Market projected to grow between 2024 and 2032?
Which 3D Printing Photopolymers Market segment held the largest share in 2024?
What are the primary factors fueling the growth of the 3D Printing Photopolymers Market?
Who are the leading companies in the 3D Printing Photopolymers Market?
Which region commanded the largest share of the 3D Printing Photopolymers Market in 2024?
Table of Content
Chapter 1. Report Introduction
- 1.1 Report Description & Purpose
- 1.1.1 Report Title & Market Definition
- 1.1.2 Unique Selling Propositions (USP) & Key Differentiators
- 1.1.3 Value Proposition for Stakeholders
- 1.2 Research Objectives
- 1.2.1 Market Sizing Objectives (Volume & Revenue) (Volume Where Applicable)
- 1.2.2 Segmentation Objectives
- 1.2.3 Competitive Intelligence Objectives
- 1.2.4 Forecast & Scenario Objectives
- 1.3 Report Scope
- 1.3.1 3D Printing Photopolymers Scope – Segments & Subsegments Covered
- 1.3.2 Geographic Scope – Regions & Countries Covered
- 1.3.3 Historical Period, Base Year & Forecast Period (2024; forecast to 2032)
- 1.3.4 Inclusions & Exclusions
- 1.4 Industry Classification & Applicable Codes
- 1.5 Currency, Measurement Units & Valuation Basis
- 1.6 Target Stakeholders
- 1.7 Limitations & Assumptions
Chapter 2. Executive Summary
- 2.1 Global 3D Printing Photopolymers Market Snapshot
- 2.1.1 Market Size – Historical (2024) & Forecast (2024-2032) (2024: USD 892.8 million → 2032: USD 3,071.3 million)
- 2.1.2 Volume & Revenue – Global Totals (Volume Where Applicable)
- 2.1.3 Key Market Highlights – Top Five Facts
- 2.2 3D Printing Photopolymers Market Segmentation Snapshot
- 2.2.1 Market Split by Region – 2024 vs. 2032
- 2.3 Competitive Snapshot
- 2.3.1 Top 10 Players by Revenue Share – 2024
- 2.3.2 Top 10 Players by Volume Share – 2024 (Volume Where Applicable)
- 2.3.3 Recent Strategic Developments (18-Month Summary)
- 2.4 Key Investment Highlights & Strategic Conclusions
Chapter 3. 3D Printing Photopolymers Market Dynamics & Industry Analysis
- 3.1 Market Overview & Context
- 3.1.1 3D Printing Photopolymers Market Position in the Broader Industry Value Chain
- 3.1.2 Demand Structure & Purchasing Dynamics
- 3.1.3 Market Maturity & Development Stage by Region
- 3.2 3D Printing Photopolymers Market Drivers
- 3.3 3D Printing Photopolymers Market Restraints & Challenges
- 3.4 3D Printing Photopolymers Market Opportunities
- 3.5 Porter's Five Forces Analysis
- 3.5.1 Threat of New Entrants
- 3.5.2 Bargaining Power of Suppliers
- 3.5.3 Bargaining Power of Buyers
- 3.5.4 Threat of Substitutes
- 3.5.5 Competitive Rivalry – Intensity Assessment
- 3.6 3D Printing Photopolymers Value Chain Analysis
- 3.6.1 Upstream – Key Inputs, Resources & Suppliers
- 3.6.1.1 Key Input/Resource 1
- 3.6.1.2 Key Input/Resource 2
- 3.6.1.3 Key Input/Resource 3
- 3.6.2 Midstream – Core Operations & Value Creation
- 3.6.2.1 Operating Model & Process Overview
- 3.6.2.2 Key Operating Locations & Capabilities by Company
- 3.6.3 Downstream – Market Channels & End Users
- 3.6.3.1 Direct Sales & Customer Engagement Channels
- 3.6.3.2 Indirect Sales, Intermediaries & Partner Channels
- 3.6.4 Value Chain Profitability Analysis
- 3.6.1 Upstream – Key Inputs, Resources & Suppliers
- 3.7 PESTEL Analysis
- 3.7.1 Political Factors
- 3.7.2 Economic Factors
- 3.7.3 Social Factors
- 3.7.4 Technological Factors
- 3.7.5 Environmental Factors
- 3.7.6 Legal Factors
- 3.8 3D Printing Photopolymers Supply Chain Analysis
- 3.8.1 Critical Input & Resource Availability Risk Assessment
- 3.8.2 Supplier & Operational Concentration Risk (Geographic Exposure)
- 3.8.3 Supply & Service Disruption Impact Analysis
- 3.9 Regulatory & Policy Landscape
Note: The regulatory and policy landscape section covers regulations based on their applicability to the market, 3D Printing Photopolymers category, geography, and scope of the study. Only regulatory frameworks with a material impact on operations, compliance, trade, sustainability, or market access are analyzed in detail.
Chapter 4. Key Investment Pockets & Opportunity Analysis
- 4.1 3D Printing Photopolymers Market Attractiveness Analysis
- 4.1.1 By Region – Investment Attractiveness Matrix (Market Size × CAGR)
- 4.2 Absolute Revenue Growth Opportunity
- 4.2.1 By Region – Absolute Revenue Growth Through 2032
- 4.3 Incremental Demand Opportunity
- 4.3.1 By Region – Incremental Demand Through 2032
- 4.3.2 Segment – Incremental Demand
- 4.4 Emerging Submarket Opportunity Deep Dive (Subject to Applicability)
- 4.5 Priority Market Opportunity Scorecards
- 4.5.1 United States
- 4.5.2 Europe
- 4.5.3 Asia
- 4.5.4 Middle East & Africa
Note: Priority market opportunity scorecards reflect the geographic scope and strategic relevance of the study. Listed markets are indicative and may be adapted to the industry.
Chapter 5. 3D Printing Photopolymers Cross-Border Trade & Market Access Analysis
- 5.1 International Trade & Cross-Border Activity Overview
- 5.1.1 Global Export Value by Country (2024)
- 5.1.2 Global Export Volume by Country (2024) (Volume Where Applicable)
- 5.1.3 Global Import Value by Country (2024)
- 5.1.4 Global Import Volume by Country (2024) (Volume Where Applicable)
- 5.1.5 Net Trade Balance by Country (2024)
- 5.2 Export Analysis – Segment
- 5.2.1 Category 1 (Applicable Classification Code)
- 5.2.2 Category 2 (Applicable Classification Code)
- 5.2.3 Category 3 (Applicable Classification Code)
- 5.2.4 Category 4 (Applicable Classification Code)
- 5.2.5 Category 5 (Applicable Classification Code)
- 5.3 Import Analysis – Segment
- 5.3.1 Category 1 (Applicable Classification Code)
- 5.3.2 Category 2 (Applicable Classification Code)
- 5.3.3 Category 3 (Applicable Classification Code)
- 5.3.4 Category 4 (Applicable Classification Code)
- 5.3.5 Category 5 (Applicable Classification Code)
- 5.4 Cross-Border Pricing & Transaction Benchmarks
- 5.4.1 Export Pricing – Segment & Country
- 5.4.2 Import Pricing – Segment & Source Country
- 5.4.3 Price Trends (2024)
- 5.5 Key Cross-Border Trade & Delivery Routes
- 5.5.1 Cross-Border Trade/Delivery Route 1
- 5.5.2 Cross-Border Trade/Delivery Route 2
- 5.5.3 Cross-Border Trade/Delivery Route 3
- 5.5.4 Cross-Border Trade/Delivery Route 4
- 5.5.5 Cross-Border Trade/Delivery Route 5
- 5.6 Trade Policy & Market Access Impact Assessment
- 5.6.1 Tariff & Non-Tariff Barriers
- 5.6.2 Regional Trade & Economic Integration Frameworks
- 5.6.3 Bilateral & Multilateral Trade Agreements
- 5.6.4 Cross-Border Operating, Licensing & Localization Requirements
Note: This chapter applies where cross-border trade or delivery is relevant to 3D Printing Photopolymers. Goods, services, and digital offerings are assessed using applicable classifications and transaction measures. Import-export volumes, trade balances, and route analyses are included only where meaningful to the market.
Chapter 6. Competitive Landscape & Company Benchmarking
- 6.1 3D Printing Photopolymers Market Concentration & Structure
- 6.1.1 Herfindahl-Hirschman Index (HHI) – vs. 2024
- 6.1.2 Leading, Mid-Sized & Emerging Player Structure
- 6.1.3 Global, Regional & Local Player Dynamics
- 6.2 3D Printing Photopolymers Market Share Analysis – 2024
- 6.2.1 Global Revenue Share by Company
- 6.2.2 Global Volume Share by Company (Volume Where Applicable)
- 6.2.3 Regional Revenue Share
- 6.2.4 Market Share Evolution ( vs. 2024)
- 6.2.5 Company Market Share by Key Segment
- 6.2.6 Company Market Share by Customer Group
- 6.3 Operating Scale, Capacity & Infrastructure Analysis
- 6.3.1 Global Operating Scale & Supply Capacity
- 6.3.2 Resource Utilization & Operating Efficiency
- 6.3.3 Output, Service Delivery & Activity Metrics
- 6.3.4 Operating Footprint & Infrastructure Map
- 6.3.5 Planned Operational & Capacity Expansion
- 6.4 3D Printing Photopolymers Competitive Benchmarking Matrix
- 6.4.1 Revenue, Growth, Profitability & Operating Metric Comparison
- 6.4.2 Channel Revenue Mix
- 6.4.3 Geographic Revenue Exposure
- 6.4.4 R&D Intensity
- 6.4.5 Sustainability Maturity
- 6.5 Strategic Developments in 3D Printing Photopolymers (Last 24 Months)
- 6.5.1 Mergers, Acquisitions & Divestments
- 6.5.2 New Products, Services & Solutions in 3D Printing Photopolymers
- 6.5.3 Operational & Infrastructure Expansions
- 6.5.4 Strategic Alliances, Joint Ventures & Partnerships
- 6.5.5 Distribution Expansion & Market Entry
- 6.5.6 Sustainability & ESG Initiatives
- 6.6 Competitive Strategy Mapping
- 6.6.1 Leader, Challenger, Follower & Niche Classification
- 6.6.2 Pricing Strategy Comparison
- 6.6.3 Channel Strategy Matrix
Note: Strategic developments are included based on their materiality and the availability of reliable information.
Chapter 7. Global 3D Printing Photopolymers Market – By Sales & Delivery Channel
- 7.1 Segment Overview
- 7.1.1 Volume & Revenue Split by Channel (2024 & 2032) (Volume Where Applicable)
- 7.1.2 Channel Mix Evolution (2024-2032)
Chapter 8. Regional Market Analysis – Global Overview
- 8.1 Global Regional Overview
- 8.1.1 Regional Volume Share (Volume Where Applicable)
- 8.1.2 Regional Revenue Share
- 8.1.3 Regional Volume by Region (Volume Where Applicable)
- 8.1.4 Regional Revenue by Region
- 8.1.5 Regional Forecast Through 2032
- 8.2 Cross-Regional Segment Analysis
- 8.2.1 By Sales & Delivery Channel
- 8.2.2 By Competitive Positioning & Price Tier
Chapter 9. North America 3D Printing Photopolymers Market
- 9.1 United States
- 9.2 Canada
- 9.3 Mexico
Chapter 10. Europe 3D Printing Photopolymers Market
- 10.1 Germany
- 10.2 France
- 10.3 Italy
- 10.4 United Kingdom
- 10.5 Spain
- 10.6 Poland
- 10.7 Russia
- 10.8 Netherlands
- 10.9 Belgium
- 10.10 Sweden
- 10.11 Denmark
- 10.12 Norway
- 10.13 Rest of Europe
Chapter 11. Asia Pacific 3D Printing Photopolymers Market
- 11.1 China
- 11.2 India
- 11.3 Japan
- 11.4 South Korea
- 11.5 Thailand
- 11.6 Indonesia
- 11.7 Vietnam
- 11.8 Malaysia
- 11.9 Australia
- 11.10 Rest of Asia Pacific
Chapter 12. Latin America 3D Printing Photopolymers Market
- 12.1 Brazil
- 12.2 Argentina
- 12.3 Colombia
- 12.4 Chile
- 12.5 Rest of Latin America
Chapter 13. Middle East 3D Printing Photopolymers Market
- 13.1 Saudi Arabia
- 13.2 United Arab Emirates
- 13.3 Turkey
- 13.4 Israel
- 13.5 Iran
- 13.6 Rest of the Middle East
Chapter 14. Africa 3D Printing Photopolymers Market
- 14.1 South Africa
- 14.2 Egypt
- 14.3 Nigeria
- 14.4 Morocco
- 14.5 Rest of Africa
Chapter 15. 3D Printing Photopolymers Company Profiles
- 15.1 [Company 01]
- 15.1.1 Company Overview
- 15.1.2 Key Management Personnel
- 15.1.3 Products & Services Portfolio
- 15.1.4 Financial Performance
- 15.1.5 Key Market Focus & Geographic Presence
- 15.1.6 Recent Developments & Strategic Initiatives
Note: The company profile list is preliminary and may change based on research findings, market developments, data availability, and client requirements.
Chapter 16. Appendices
- Appendix A – List of Abbreviations & Acronyms
- Appendix B – Industry Classification Code Reference – Full Series
- Appendix C – Supply, Output & Operating Capacity Data Tables
- Appendix D – End-Use & Demand Base Tables
- Appendix E – Demand, Adoption & Usage Assumptions
- Appendix F – Pricing & Revenue Metric Reference Tables
- Appendix G – Company Operations & Infrastructure Database
- Appendix H – Cross-Border Trade & Activity Data Tables (Where Applicable)
- Appendix I – Regulatory Summary Tables
- Appendix J – Primary Research Participant List (Anonymized)
- Appendix K – Primary Research Questionnaire Framework
- Appendix L – Data Sources & Bibliography
- Appendix M – Market Size Divergence & Source Comparison
Chapter 17. Research Methodology
- 17.1 Research Framework & Philosophy
- 17.2 Secondary Research – Sources, Hierarchy & Data Extraction
- 17.3 Data Modeling – Bottom-Up & Top-Down Market Sizing
- 17.4 Primary Research – Stakeholder Framework, LOI & Sample Sizes
- 17.5 Forecast Methodology – Regression, Scenario & Sensitivity Analysis
- 17.6 Quality Control – Four-Layer Validation Framework
- 17.7 Limitations & Standard Assumptions
- 17.8 Disclaimer
