Market Overview
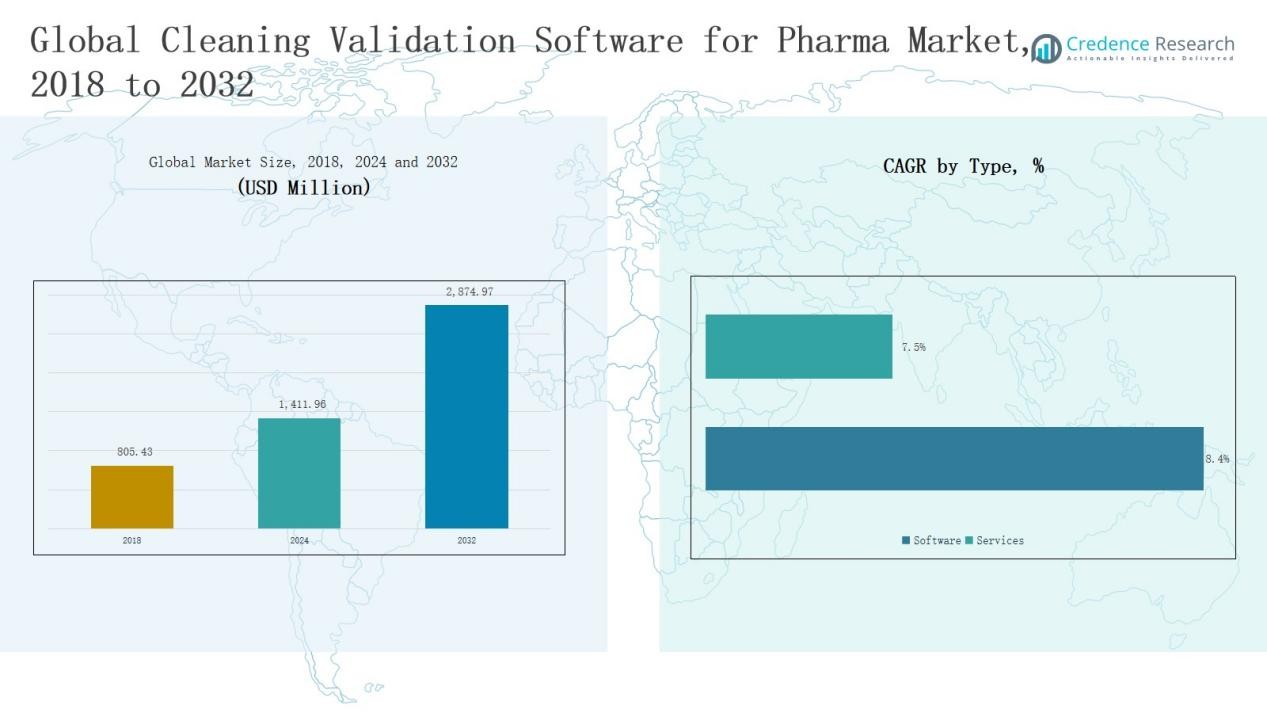
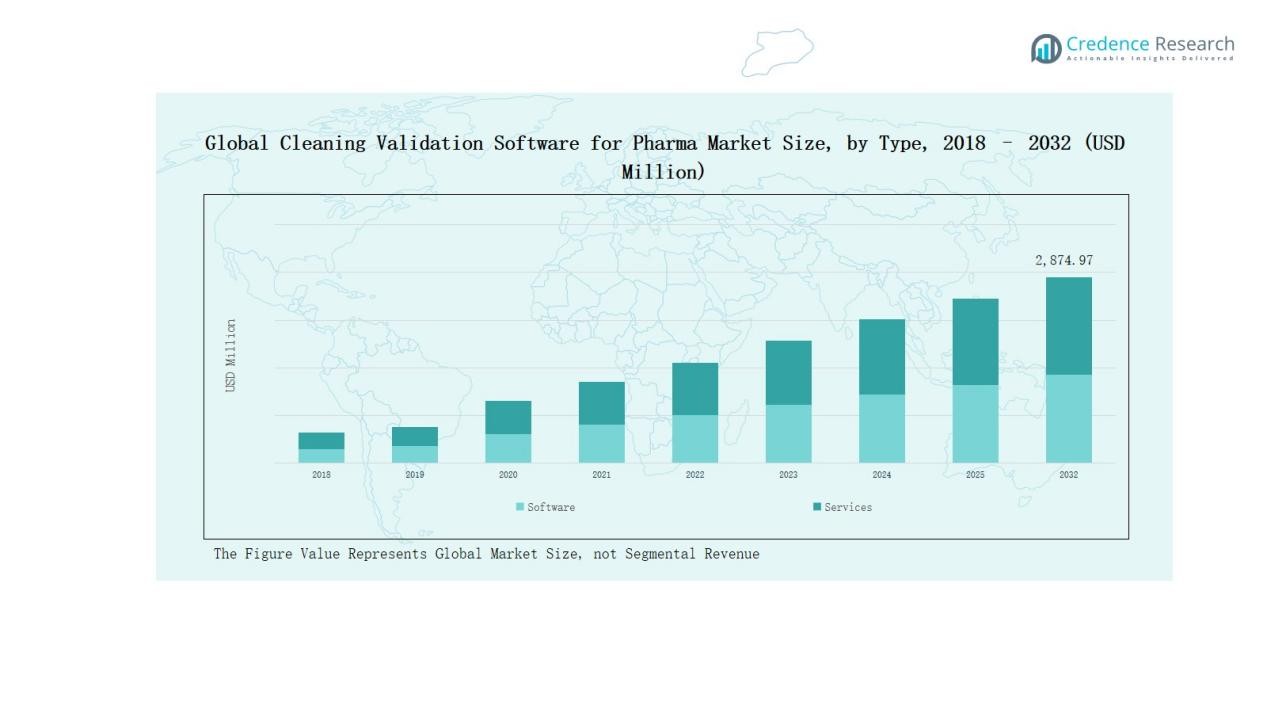
The Cleaning Validation Software for Pharma Market size was valued at USD 805.43 million in 2018, increased to USD 1,411.96 million in 2024, and is anticipated to reach USD 2,874.97 million by 2032, growing at a CAGR of 8.66% during the forecast period.
| REPORT ATTRIBUTE |
DETAILS |
| Historical Period |
2020-2023 |
| Base Year |
2024 |
| Forecast Period |
2025-2032 |
| Cleaning Validation Software for Pharma Market Size 2024 |
USD 1,411.96 Million |
| Cleaning Validation Software for Pharma Market, CAGR |
8.66% |
| Cleaning Validation Software for Pharma Market Size 2032 |
USD 2,874.97 Million |
The Cleaning Validation Software for Pharma Market is led by key players such as ValGenesis, Kneat Solutions, CloudLIMS, MasterControl, Dassault Systèmes (BIOVIA), Sparta Systems, and QualAssure/Qualisys. These companies dominate through advanced digital validation platforms that ensure compliance, data integrity, and process standardization across pharmaceutical operations. Their focus on cloud-based solutions, AI integration, and regulatory alignment has strengthened their global presence. Among all regions, North America emerged as the leading market in 2024, capturing 43.8% of the global share, driven by strong FDA oversight, rapid digital adoption, and high concentration of major pharmaceutical manufacturers.
Access crucial information at unmatched prices!
Request your sample report today & start making informed decisions powered by Credence Research Inc.!
Download Sample
Market Insights
- The Cleaning Validation Software for Pharma Market grew from USD 805.43 million in 2018 to USD 1,411.96 million in 2024 and is projected to reach USD 2,874.97 million by 2032, at a CAGR of 8.66%.
- North America led the market in 2024 with a 8% share, driven by strict FDA regulations, rapid digital transformation, and widespread use of cloud-based validation systems.
- The software segment dominated by type with a 4% share, supported by automation, compliance tracking, and real-time monitoring within pharmaceutical operations.
- By application, small molecule drug manufacturing accounted for 7% in 2024, followed by biologics manufacturing at 31.2%, supported by rising vaccine and biosimilar production.
- The cloud/SaaS deployment model held the largest share of 8%, driven by scalability, centralized data access, and cost efficiency across global pharmaceutical enterprises.
Market Segment Insights
By Type:
The software segment dominated the Cleaning Validation Software for Pharma Market in 2024, holding a 65.4% share. Growth is driven by increased adoption of automated validation tools that ensure data integrity, regulatory compliance, and reduced manual documentation. The application segment accounted for 34.6%, supported by its role in process integration and validation analytics. Software solutions continue to expand due to cloud connectivity, audit traceability, and real-time monitoring capabilities within regulated pharmaceutical operations.
- For instance, ValGenesis announced the deployment of its VLMS cloud platform for a European pharmaceutical company, enabling fully digitized cleaning validation with 21 CFR Part 11 compliance monitoring.
By Application:
Small molecule drug manufacturing led the market in 2024, capturing 39.7% of the share, owing to widespread use of validation systems for contamination control and cleaning cycle verification. Large molecule or biologics manufacturing followed with 31.2%, driven by complex formulations requiring precise residue monitoring. Vaccine manufacturing also gained traction at 14.6%, supported by global immunization initiatives and stringent quality standards in bioprocessing facilities. Peptides and others contributed the remaining 14.5% collectively.
- For instance, Merck KGaA launched its Mobius® single‑use chromatography solutions, aimed at ensuring batch-to-batch consistency in vaccine purification processes.
By Deployment:
The cloud/SaaS deployment segment accounted for 71.8% of total revenue in 2024, reflecting the pharmaceutical industry’s rapid shift toward digital validation platforms with remote access, scalability, and data centralization benefits. Cloud-based solutions help reduce IT costs and simplify global compliance management. The on-premises segment, representing 28.2%, remained preferred among large enterprises prioritizing full data control and customized system integration for sensitive production environments.
Key Growth Drivers
Rising Regulatory Compliance Requirements
The growing stringency of global regulatory frameworks such as FDA, EMA, and WHO guidelines drives adoption of cleaning validation software. These platforms help pharmaceutical companies ensure traceability, documentation accuracy, and audit readiness. Automated validation systems minimize manual errors and speed up approval cycles. The demand for digital solutions continues to rise as manufacturers seek real-time compliance monitoring and standardized electronic records across multi-site operations.
- For instance, MasterControl offers a compliance suite that includes predictive analytics tools, which help life sciences manufacturers identify and prevent potential deviations.
Expansion of Biopharmaceutical and Vaccine Production
Rapid growth in biologics, biosimilars, and vaccine manufacturing fuels the need for advanced cleaning validation systems. Bioprocessing facilities require precise contamination control and validated cleaning cycles to prevent cross-product interference. Software-based validation ensures consistent cleaning performance, process repeatability, and adherence to good manufacturing practices (GMP). The expanding global biologics pipeline significantly boosts the deployment of automated validation platforms across production facilities.
- For instance, Emerson Process Management’s Delta V system is widely used in biopharmaceutical plants to automate and validate cleaning processes, ensuring compliance with GMP requirements through rigorous documentation and process repeatability.
Shift Toward Digital Transformation and Paperless Systems
The pharmaceutical sector’s transition from paper-based validation to digital platforms remains a key growth catalyst. Cleaning validation software streamlines workflows, centralizes documentation, and enhances transparency across teams. Integration with quality management systems (QMS) and laboratory information management systems (LIMS) allows faster decision-making. Companies increasingly adopt cloud-based systems to support remote audits, data sharing, and scalability, promoting long-term efficiency and cost optimization.
Key Trends & Opportunities
Integration of Cloud and AI Technologies
Cloud-based cleaning validation platforms integrated with artificial intelligence (AI) and machine learning (ML) are transforming process validation. These technologies enable predictive maintenance, automated data analysis, and intelligent risk assessment. The trend toward real-time monitoring and centralized data access improves process optimization. Vendors offering AI-powered compliance dashboards and smart audit features are gaining strong competitive advantage, especially among multinational pharmaceutical manufacturers.
- For instance, Leucine’s AI-powered platform is currently utilized by over 300 pharmaceutical manufacturing facilities globally to track batches, reduce production delays, and enhance regulatory compliance.
Growing Demand for Modular and Scalable Solutions
Pharmaceutical companies increasingly prefer modular validation software that can scale across sites and manufacturing units. This trend supports flexibility in implementation while reducing deployment time and maintenance costs. The opportunity lies in developing customizable platforms tailored to varying regulatory needs, from small molecule to biologics manufacturing. Cloud-based modular architectures also enable efficient updates, cross-site collaboration, and integration with existing enterprise quality systems.
- For instance, ESSERT reports that its modular MicroFactory system facilitates faster implementation of process modifications without revalidating the entire production line, significantly cutting time and costs.
Key Challenges
High Initial Implementation and Integration Costs
The high cost of deploying and integrating validation software remains a major restraint for small and mid-sized pharmaceutical firms. Implementation involves infrastructure upgrades, staff training, and data migration expenses. Customizing software to meet site-specific requirements further increases project timelines. Despite long-term savings, budget constraints often delay digital transformation, particularly in emerging markets with limited technological readiness.
Data Security and Compliance Risks in Cloud Systems
While cloud-based validation platforms offer efficiency, they also expose organizations to cybersecurity risks and data privacy concerns. Pharmaceutical companies handle sensitive process and batch data that must comply with stringent security regulations such as 21 CFR Part 11. Ensuring data encryption, secure access, and regulatory alignment becomes critical. Any breach or non-compliance incident can lead to penalties and reputational damage, affecting adoption confidence.
Limited Technical Expertise and Change Management
Adoption of advanced cleaning validation software requires skilled professionals trained in digital validation, data analytics, and regulatory systems. Many firms face internal resistance and knowledge gaps during digital migration. Inadequate training or poor change management reduces software utilization and ROI. Establishing a culture of digital readiness and ongoing technical education is essential for maximizing the operational benefits of validation software.
Regional Analysis
North America:
North America dominated the Cleaning Validation Software for Pharma Market in 2024, accounting for 43.8% of global revenue. The market grew from USD 356.28 million in 2018 to USD 618.17 million in 2024 and is projected to reach USD 1,262.14 million by 2032, expanding at a CAGR of 8.7%. Growth is driven by strong regulatory enforcement by the FDA, rapid digitalization of pharmaceutical manufacturing, and high adoption of cloud-based validation systems by large pharma companies across the U.S. and Canada.
Europe:
Europe held a 26.6% market share in 2024, rising from USD 222.58 million in 2018 to USD 375.75 million in 2024, and projected to reach USD 719.08 million by 2032 at a CAGR of 7.8%. Demand is supported by stringent EMA quality standards and increased investment in compliance automation. The region’s focus on data integrity, coupled with digital transformation across the UK, Germany, and France, strengthens adoption of advanced validation software among both large and mid-tier manufacturers.
Asia Pacific:
Asia Pacific emerged as the fastest-growing region with a 21.1% market share in 2024. The market expanded from USD 156.71 million in 2018 to USD 297.50 million in 2024 and is expected to reach USD 685.23 million by 2032, recording a CAGR of 10.3%. Growth is driven by expanding pharmaceutical manufacturing in China, India, and Japan, alongside increasing regulatory harmonization and adoption of SaaS-based compliance tools. Rising contract manufacturing activities also boost the need for digital validation systems.
Latin America:
Latin America represented 4.7% of the market in 2024, growing from USD 38.13 million in 2018 to USD 66.02 million in 2024, and is projected to reach USD 119.02 million by 2032, at a CAGR of 7.0%. The region benefits from increasing investments in pharmaceutical infrastructure, particularly in Brazil and Mexico. Adoption of digital validation software is gradually improving as companies focus on meeting global GMP standards and achieving efficient documentation control.
Middle East:
The Middle East accounted for 2.5% of the market in 2024, increasing from USD 21.94 million in 2018 to USD 35.06 million in 2024, and expected to reach USD 59.88 million by 2032, at a CAGR of 6.3%. Regional growth is supported by expanding biopharma manufacturing hubs in GCC nations and growing interest in regulatory digitalization. Government initiatives to modernize healthcare manufacturing also create opportunities for cloud-based validation platforms.
Africa:
Africa held a 1.3% share of the global market in 2024, up from USD 9.80 million in 2018 to USD 19.46 million in 2024, and projected to reach USD 29.63 million by 2032, at a CAGR of 4.7%. Market growth remains moderate due to limited digital infrastructure and slower regulatory modernization. However, increasing pharmaceutical investments in South Africa and Egypt, along with international partnerships, are gradually encouraging the adoption of compliance automation tools.
Market Segmentations:
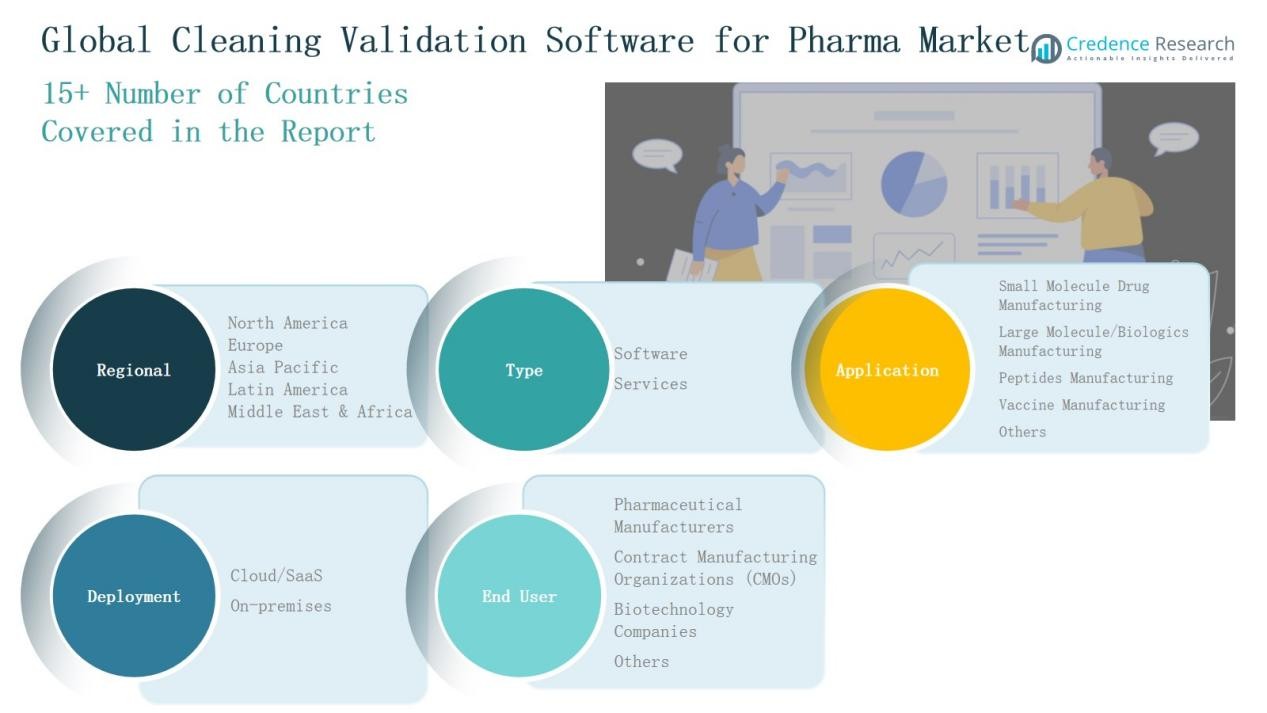
By Type
By Application
- Small Molecule Drug Manufacturing
- Large Molecule/Biologics Manufacturing
- Peptides Manufacturing
- Vaccine Manufacturing
- Others
By Deployment
By End User
- Pharmaceutical Manufacturers
- Contract Manufacturing Organizations (CMOs)
- Biotechnology Companies
- Others
By Region
- North America
- Europe
- Asia Pacific
- Latin America
- Middle East
- Africa
Competitive Landscape
The Cleaning Validation Software for Pharma Market is moderately consolidated, with leading players focusing on technological innovation, regulatory compliance, and global expansion to maintain competitiveness. Key companies such as ValGenesis, Kneat Solutions, CloudLIMS, MasterControl, Dassault Systèmes (BIOVIA), Sparta Systems, and QualAssure/Qualisys dominate the market through advanced validation lifecycle management platforms. These firms emphasize cloud-based solutions, digital documentation, and real-time analytics to streamline validation workflows and ensure data integrity. Strategic collaborations with pharmaceutical manufacturers, contract organizations, and regulatory bodies enhance product scalability and compliance adaptability. Emerging players increasingly target niche segments with AI-driven risk assessment and integrated quality management systems. Continuous investments in R&D, modular product design, and regional partnerships further strengthen competitive positioning. The shift toward digital transformation and GMP-standardized validation solutions continues to intensify market rivalry, driving differentiation through innovation, customization, and regulatory expertise.
Shape Your Report to Specific Countries or Regions & Enjoy 30% Off!
Key Players
- ValGenesis, Inc.
- Kneat Solutions Ltd.
- CloudLIMS
- MasterControl, Inc.
- Dassault Systèmes (BIOVIA)
- Sparta Systems
- QualAssure / Qualisys
- Dot Compliance Ltd.
- AmpleLogic
- QbDVision
- ssComplianceQuest
- AssurX, Inc.
- Intellect Design Arena Ltd.
- Siemens Healthineers (Digital Industries Software)
- TrackWise Digital (Honeywell International Inc.)
Recent Developments
- In March 2025, ValGenesis partnered with a global pharmaceutical company to digitize its entire cleaning validation lifecycle using ValGenesis iClean.
- In April 2023, ValGenesis introduced Process Manager, the industry’s first digital platform designed to streamline the end-to-end cleaning validation lifecycle.
- In November 2023, Savillex acquired ONFAB to expand its offerings and reach in the pharmaceutical and biopharma cleaning validation space.
Report Coverage
The research report offers an in-depth analysis based on Type, Application, Deployment, End User and Region. It details leading market players, providing an overview of their business, product offerings, investments, revenue streams, and key applications. Additionally, the report includes insights into the competitive environment, SWOT analysis, current market trends, as well as the primary drivers and constraints. Furthermore, it discusses various factors that have driven market expansion in recent years. The report also explores market dynamics, regulatory scenarios, and technological advancements that are shaping the industry. It assesses the impact of external factors and global economic changes on market growth. Lastly, it provides strategic recommendations for new entrants and established companies to navigate the complexities of the market.
Future Outlook
- Demand for automated validation platforms will rise with growing digitalization in pharma manufacturing.
- Integration of AI and machine learning will enhance predictive validation and process optimization.
- Cloud-based deployment will continue to dominate due to scalability and remote accessibility.
- Biopharmaceutical expansion will drive adoption of software supporting complex cleaning validation needs.
- Increased regulatory scrutiny will encourage faster adoption of compliant digital systems.
- Partnerships between software providers and contract manufacturing organizations will strengthen global reach.
- Modular and customizable software models will gain traction among mid-sized manufacturers.
- Data integrity and cybersecurity solutions will become key differentiation factors among vendors.
- Emerging markets in Asia Pacific and Latin America will experience accelerated software adoption.
- Continuous innovation in validation lifecycle management will redefine operational efficiency across regulated facilities.


