Market Overview
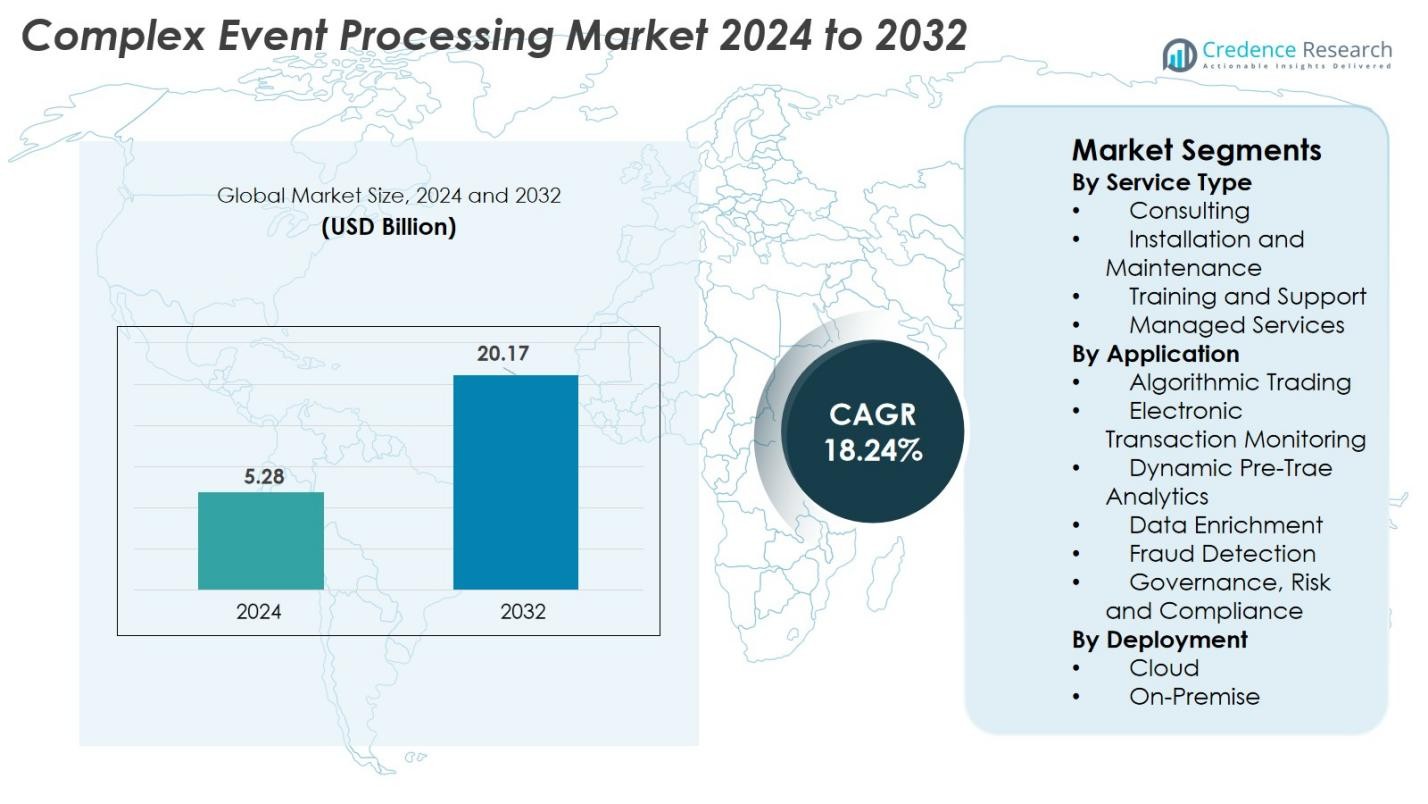
Complex Event Processing Market size was valued at USD 5.28 Billion in 2024 and is anticipated to reach USD 20.17 Billion by 2032, at a CAGR of 18.24% during the forecast period.
| REPORT ATTRIBUTE |
DETAILS |
| Historical Period |
2020-2023 |
| Base Year |
2024 |
| Forecast Period |
2025-2032 |
| Complex Event Processing Market Size 2024 |
USD 5.28 Billion |
| Complex Event Processing Market, CAGR |
18.24% |
| Complex Event Processing Market Size 2032 |
USD 20.17 Billion |
The Complex Event Processing market is driven by major technology providers such as IBM, Oracle, SAP, Amazon Web Services, Microsoft Azure, TIBCO Software, Kx Systems, StreamBase Systems, FICO, and Axon Framework, all of which focus on delivering high-performance real-time analytics and event-streaming capabilities. These companies continue to enhance platform intelligence through AI and cloud-native integrations to support large-scale event monitoring across industries. North America leads the global market with a 38.6% share, supported by advanced IT infrastructure, strong adoption of real-time analytics, and widespread use of CEP solutions in BFSI, telecom, retail, and cybersecurity applications.
Access crucial information at unmatched prices!
Request your sample report today & start making informed decisions powered by Credence Research Inc.!
Download Sample
Market Insights
- The Complex Event Processing market reached USD 5.28 Billion in 2024 and is projected to grow at a CAGR of 18.24%, driven by rising adoption of real-time analytics across industries.
- Growing demand for instant decision-making, fraud detection, and automated monitoring continues to fuel market expansion, especially as enterprises handle increasing volumes of streaming data.
- Key trends include rapid cloud migration, integration of AI and machine learning into CEP platforms, and expanding applications in IoT-driven ecosystems and high-frequency trading environments.
- Major players such as IBM, Oracle, SAP, AWS, Microsoft Azure, TIBCO Software, and Kx Systems strengthen market presence through continuous innovations and platform enhancements.
- North America leads with a 38.6% share, followed by Europe at 27.4% and Asia Pacific at 23.1%, while Managed Services hold the largest segment share at 41.6% due to growing demand for scalable, cost-efficient real-time processing capabilities.
Market Segmentation Analysis
By Service Type
The Complex Event Processing market by service type is led by Managed Services, accounting for 41.6% of the total share in 2024. Organizations increasingly adopt managed services to streamline real-time data processing, reduce operational burdens, and improve event-driven automation. Consulting and Installation & Maintenance services continue to gain traction as enterprises modernize legacy architectures, while Training & Support services rise with growing CEP platform complexity. The dominance of Managed Services is primarily driven by the shift toward continuous monitoring, automation initiatives, and the need for cost-efficient, scalable analytics capabilities across industries.
- For instance, in the airline industry, firms have adopted managed CEP pipelines using frameworks like Apache Flink (via Ververica) to detect critical flight- or operation-related events in real time, enabling prompt automated responses to disruptions.
By Application
Within the application category, Fraud Detection emerged as the largest sub-segment with a 32.4% share in 2024. The rising volume of digital transactions, cybersecurity threats, and identity fraud incidents pushes financial institutions, e-commerce platforms, and telecom providers to adopt CEP solutions for real-time anomaly detection. Algorithmic Trading and Electronic Transaction Monitoring remain significant due to the expansion of high-frequency trading and digital payment ecosystems. Meanwhile, Dynamic Pre-Trade Analytics and Data Enrichment benefit from advanced analytics integration. The dominance of Fraud Detection is driven by regulatory pressures, rapid digitalization, and demand for instant risk mitigation.
- For instance, Mastercard’s Decision Intelligence platform uses AI-driven, event-stream scoring processing over 75 billion transactions annually to identify anomalies within milliseconds.
By Deployment
The Cloud deployment model leads the market with a 64.7% share in 2024, supported by its scalability, faster implementation, and cost-efficiency. Enterprises increasingly shift to cloud-based CEP platforms to process large event streams generated from IoT devices, financial systems, and enterprise applications. Cloud-native architectures also enhance integration with AI, ML, and advanced analytics tools. On-premise deployment remains relevant for organizations with strict data governance and compliance needs. The strong adoption of cloud deployment is driven by digital transformation initiatives, flexible pricing models, and increasing preference for remote, automated data processing environments.
Key Growth Drivers
Rising Demand for Real-Time Analytics and Decision-Making
The need for real-time insights is a major driver accelerating the adoption of Complex Event Processing (CEP) solutions. Industries such as finance, telecommunications, retail, and manufacturing increasingly rely on instant event correlation to improve operational responsiveness. Organizations process vast volumes of streaming data generated by sensors, applications, networks, and transactional systems, driving demand for platforms that identify patterns and anomalies within milliseconds. CEP enables automated decision-making, reduces latency in business processes, and supports mission-critical use cases like fraud detection, network optimization, and predictive maintenance. As digital transformation accelerates and enterprises move toward hyper-connected ecosystems, the ability to act on real-time intelligence becomes essential. The escalating need for faster analytics, enhanced business agility, and improved customer experience continues to strengthen CEP market expansion worldwide.
- For instance, Goldman Sachs processes millions of market data events per second through real-time stream-processing architectures to support low-latency trading decisions.
Expansion of IoT Ecosystems and Event-Driven Architectures
The massive proliferation of IoT devices across industries significantly propels CEP adoption. Modern enterprises deploy millions of connected sensors and smart endpoints that generate continuous event streams requiring real-time processing. CEP platforms serve as the foundation of event-driven architectures by enabling automated decisions across smart factories, autonomous vehicles, energy grids, and connected healthcare systems. The growth of edge computing further enhances this trend, allowing organizations to process events close to the source for faster response times and lower bandwidth usage. Industries increasingly adopt IoT for asset monitoring, supply chain intelligence, and customer engagement, all of which require low-latency analytics. As IoT deployments scale, event volumes grow exponentially, making CEP indispensable for managing distributed event flows. This synergy between IoT expansion and real-time analytics is a key catalyst for market growth.
- For instance, General Electric’s industrial IoT systems collect over 20 million sensor events daily from jet engines, power turbines, and locomotives, requiring real-time event correlation to predict failures and optimize performance.
Growing Adoption of AI-Integrated CEP Platforms
The integration of AI and machine learning with CEP systems is emerging as a powerful growth engine. Traditional rule-based event processing is evolving into intelligent event analysis, where ML algorithms detect complex behavioral patterns, predict anomalies, and automate decision logic. Industries such as BFSI, cybersecurity, and e-commerce increasingly rely on AI-enabled CEP to detect fraud, identify suspicious activities, and optimize customer interactions. Machine learning enhances CEP accuracy by reducing false positives and enabling adaptive models that learn from evolving event streams. Additionally, cloud-based AI services accelerate deployment and broaden accessibility. The convergence of CEP with advanced analytics, natural language processing, and predictive modeling strengthens its value proposition, making intelligent automation a core capability in enterprise operations. This trend positions AI-integrated CEP platforms as a foundational technology for future event-driven digital ecosystems.
Key Trends & Opportunities
Integration of CEP with Cloud-Native and Serverless Architectures
A major trend shaping the Complex Event Processing market is the rapid adoption of cloud-native and serverless computing models. Organizations increasingly prioritize scalability, elasticity, and cost efficiency, making cloud-based CEP platforms highly attractive. Serverless event processing allows enterprises to handle fluctuating workloads without infrastructure management, enabling fast deployment and automated scaling. This trend supports high-throughput event scenarios such as digital payments, mobile applications, smart logistics, and streaming analytics. The rise of microservices architecture further enhances interoperability, allowing CEP engines to integrate seamlessly with data lakes, AI models, and enterprise applications. Cloud providers offering native CEP tools create significant opportunities for vendors to innovate with managed, low-cost event-streaming solutions. As enterprises accelerate cloud migration, cloud-native CEP systems unlock new opportunities in automated workflows, real-time orchestration, and intelligent business operations.
- For instance, Amazon Web Services reports that AWS Lambda executes trillions of serverless invocations per month, enabling customers to process streaming events without managing servers an approach widely used in digital payments and mobile applications.
Growing Opportunity in Fraud Detection, Cybersecurity, and Risk Analytics
The surge in cyber threats, digital transaction fraud, and identity breaches is creating substantial opportunity for CEP technologies. Organizations seek advanced platforms capable of correlating multiple data streams—user behavior, device signatures, network patterns, and transaction logs—to detect anomalies instantly. CEP enables predictive risk analytics and real-time fraud scoring, closely aligned with regulatory requirements for financial institutions, telecom providers, and e-commerce companies. Advances in ML-enhanced pattern recognition further strengthen its application in threat intelligence and automated incident response. As businesses adopt digital-first models and expand online services, the demand for event-driven security platforms grows significantly. The rising integration of CEP with SIEM systems, behavioral analytics, and blockchain monitoring tools positions it as a critical component of modern cybersecurity strategies.
- For instance, Visa’s real-time fraud detection system analyzes over 65,000 transactions per second, using event-stream analytics to identify anomalies within milliseconds.
Key Challenges
High Implementation Complexity and Integration Barriers
Despite its advantages, CEP adoption faces substantial challenges due to integration complexity and technical skill requirements. Deploying CEP engines requires seamless interoperability with multiple data sources, legacy systems, cloud platforms, and third-party analytics tools. Organizations often struggle with data inconsistency, infrastructure fragmentation, and lack of standardization. Real-time event processing demands advanced architectural expertise, driving dependency on specialized professionals who are in short supply. Additionally, the high cost of integration, customization, and continuous maintenance limits adoption among small and mid-sized enterprises. As CEP implementations grow in scale, managing rule complexity, system performance, and latency becomes more difficult. These technical barriers increase deployment timelines and slow market penetration, particularly in traditional industries with outdated IT environments.
Data Privacy, Security Regulations, and Compliance Constraints
CEP platforms continuously process sensitive event data, including financial transactions, user identities, device logs, and operational workflows, making compliance a major challenge. Strict regulations such as GDPR, PCI DSS, and industry-specific data governance frameworks require rigorous control over data flow, storage, and access. Ensuring privacy while performing real-time analytics becomes difficult, especially when using cloud-based or distributed architectures. Unauthorized access, event manipulation, and data breaches pose risks that can result in regulatory penalties and operational disruptions. Organizations must implement encryption, access controls, anonymization, and audit systems, increasing operational complexity and cost. As global privacy laws evolve and data volumes rise, maintaining secure, compliant CEP environments becomes a persistent challenge for large-scale deployments.
Regional Analysis
North America
North America dominates the Complex Event Processing market with a 38.6% share in 2024, driven by strong adoption of real-time analytics, advanced cybersecurity systems, and high-frequency trading platforms. The United States leads regional demand due to its mature IT infrastructure, cloud migration momentum, and heavy use of CEP in BFSI, telecom, and retail sectors. Major technology vendors and cloud service providers accelerate innovation, while stringent regulatory frameworks encourage investment in fraud detection and compliance monitoring. The region’s strong digital transformation strategies and rapid integration of AI-powered CEP platforms continue to reinforce its leadership position.
Europe
Europe holds a 27.4% share of the Complex Event Processing market, supported by rising demand for real-time monitoring across banking, energy, automotive, and industrial automation sectors. Countries such as Germany, the United Kingdom, and France are at the forefront of adopting CEP for cybersecurity enhancement, algorithmic trading, and smart manufacturing applications. GDPR compliance also fuels the need for advanced event-processing solutions to manage secure data flows. Growing investments in IoT ecosystems and Industry 4.0 initiatives further amplify CEP adoption across enterprises, making Europe one of the fastest-evolving regions in event-driven analytics and automated decision-making technologies.
Asia Pacific
Asia Pacific accounts for 23.1% of the Complex Event Processing market and is the fastest-growing region due to accelerating digitalization across China, India, Japan, and South Korea. Rapid expansion of digital payments, rising fintech ecosystems, and large-scale IoT deployments drive strong demand for CEP solutions. Enterprises increasingly adopt cloud-based platforms to support real-time fraud detection, smart city infrastructure, and intelligent supply chain management. Government-led digital initiatives and the rise of hyperscale data centers further enhance adoption. The region’s expanding e-commerce and telecom sectors significantly contribute to rising event stream volumes, driving robust CEP integration.
Latin America
Latin America captures 6.3% of the market, driven by growing digital payment systems, expanding telecom networks, and increasing adoption of AI-driven analytics. Brazil and Mexico lead regional uptake as enterprises modernize infrastructure to support real-time risk monitoring, fraud prevention, and operational intelligence. Cloud adoption is rising quickly due to cost-efficient deployment models, improving CEP accessibility for medium-sized businesses. Financial institutions and retail platforms generate significant event-processing demand, especially for compliance and anomaly detection. Despite infrastructure challenges in some countries, the region shows steady growth supported by rising digital transactions and evolving cybersecurity needs.
Middle East & Africa
The Middle East & Africa region holds a 4.6% market share, supported by rising investments in digital transformation, smart city initiatives, and real-time monitoring systems across government, telecom, and energy sectors. Gulf countries such as the UAE and Saudi Arabia drive demand for cloud-based CEP platforms to enhance infrastructure automation, cybersecurity resilience, and financial analytics. The expanding fintech ecosystem and growing IoT deployments contribute to increasing event-processing requirements. Although overall adoption is still emerging, improving IT infrastructure, regulatory digitization, and enterprise modernization continue to boost CEP integration across key industries in the region.
Market Segmentations
By Service Type
- Consulting
- Installation and Maintenance
- Training and Support
- Managed Services
By Application
- Algorithmic Trading
- Electronic Transaction Monitoring
- Dynamic Pre-Trae Analytics
- Data Enrichment
- Fraud Detection
- Governance, Risk and Compliance
By Deployment
By Geography
- North America
- Europe
- Germany
- France
- U.K.
- Italy
- Spain
- Rest of Europe
- Asia Pacific
- China
- Japan
- India
- South Korea
- South-east Asia
- Rest of Asia Pacific
- Latin America
- Brazil
- Argentina
- Rest of Latin America
- Middle East & Africa
- GCC Countries
- South Africa
- Rest of the Middle East and Africa
Competitive Landscape
The competitive landscape of the Complex Event Processing market is characterized by the strong presence of global technology vendors, cloud service providers, and specialized real-time analytics companies. Leading players such as IBM, Oracle, SAP, Amazon Web Services, Microsoft Azure, TIBCO Software, Kx Systems, StreamBase Systems, FICO, and Axon Framework focus on enhancing event-streaming capabilities, improving integration with AI and ML tools, and expanding cloud-native CEP offerings. Vendors compete by delivering high-performance, low-latency processing engines capable of handling massive event volumes across financial services, telecom, retail, and manufacturing sectors. Strategic collaborations, platform upgrades, and acquisitions remain central to strengthening market positioning. The shift toward cloud-based deployments and intelligent automation encourages players to invest heavily in scalable architectures and advanced analytics features. Additionally, growing demand for real-time fraud detection, cybersecurity monitoring, and predictive operational intelligence drives continuous innovation, reinforcing the competitive momentum within the market.
Shape Your Report to Specific Countries or Regions & Enjoy 30% Off!
Key Player Analysis
- Axon Framework
- IBM
- Amazon Web Services
- SAP
- StreamBase Systems
- Microsoft Azure
- Kx Systems
- TIBCO Software
- FICO
- Oracle
Recent Developments
- In May 2025, Ververica published a blog on real-time fraud detection using CEP (based on Apache Flink), underlining growing adoption of CEP for fraud prevention in financial services.
- In March 2025, a research study introduced OCEP an ontology-based CEP framework for Big Data analytics in healthcare, integrating semantic reasoning, real-time event correlation and Hadoop/Kafka infrastructure. This indicates academic and practical innovation aimed at overcoming traditional CEP limitations in heterogeneous data environments.
Report Coverage
The research report offers an in-depth analysis based on Service Type, Application, Deployment and Geography. It details leading market players, providing an overview of their business, product offerings, investments, revenue streams, and key applications. Additionally, the report includes insights into the competitive environment, SWOT analysis, current market trends, as well as the primary drivers and constraints. Furthermore, it discusses various factors that have driven market expansion in recent years. The report also explores market dynamics, regulatory scenarios, and technological advancements that are shaping the industry. It assesses the impact of external factors and global economic changes on market growth. Lastly, it provides strategic recommendations for new entrants and established companies to navigate the complexities of the market.
Future Outlook
- The market will experience strong growth as enterprises prioritize real-time decision-making across critical operations.
- Adoption of AI-enhanced CEP platforms will increase, enabling intelligent automation and predictive event analysis.
- Cloud-native and serverless architectures will drive faster deployment and greater scalability for event-processing systems.
- Expansion of IoT ecosystems will generate higher event volumes, boosting demand for advanced CEP capabilities.
- Financial services, telecom, and e-commerce will remain the largest adopters due to growing fraud detection and monitoring needs.
- Edge computing integration will accelerate, supporting low-latency event processing closer to the data source.
- Cybersecurity applications will expand as organizations deploy CEP for real-time threat detection and incident response.
- Vendors will invest more in interoperability to integrate CEP smoothly with analytics, data lakes, and enterprise platforms.
- Regulatory requirements will push enterprises to adopt CEP for compliance monitoring and risk management.
- Emerging markets in Asia Pacific and the Middle East will adopt CEP rapidly as digital transformation initiatives intensify.


