Brain disorder burden sustains long-term medicine use
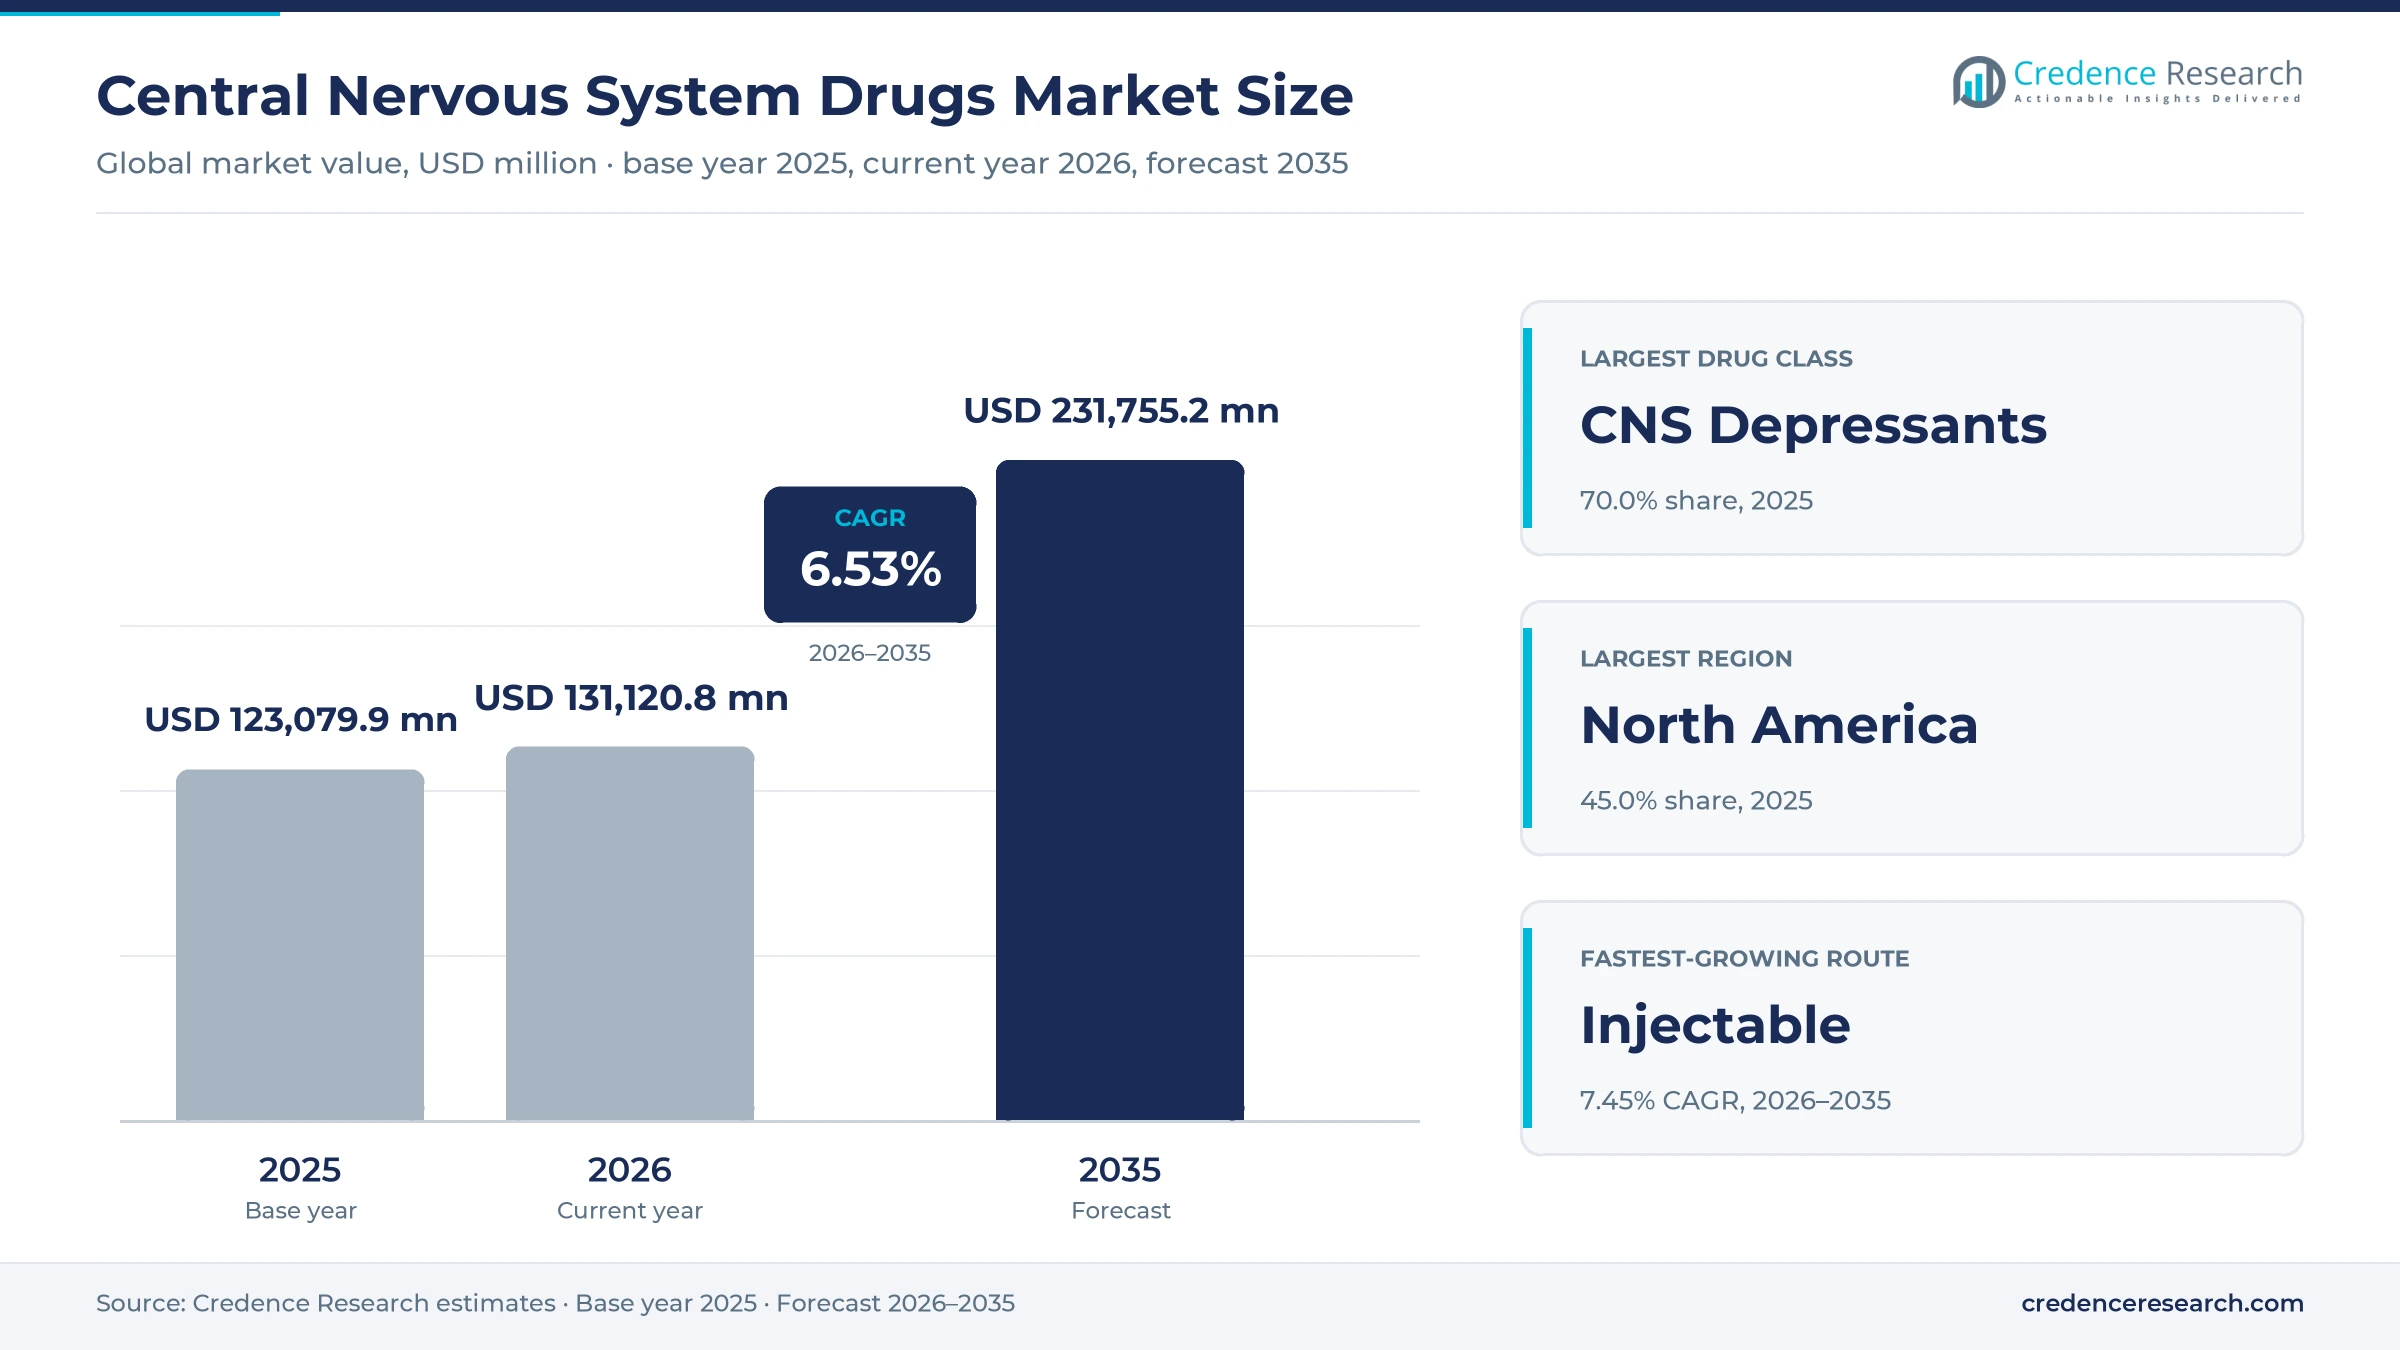
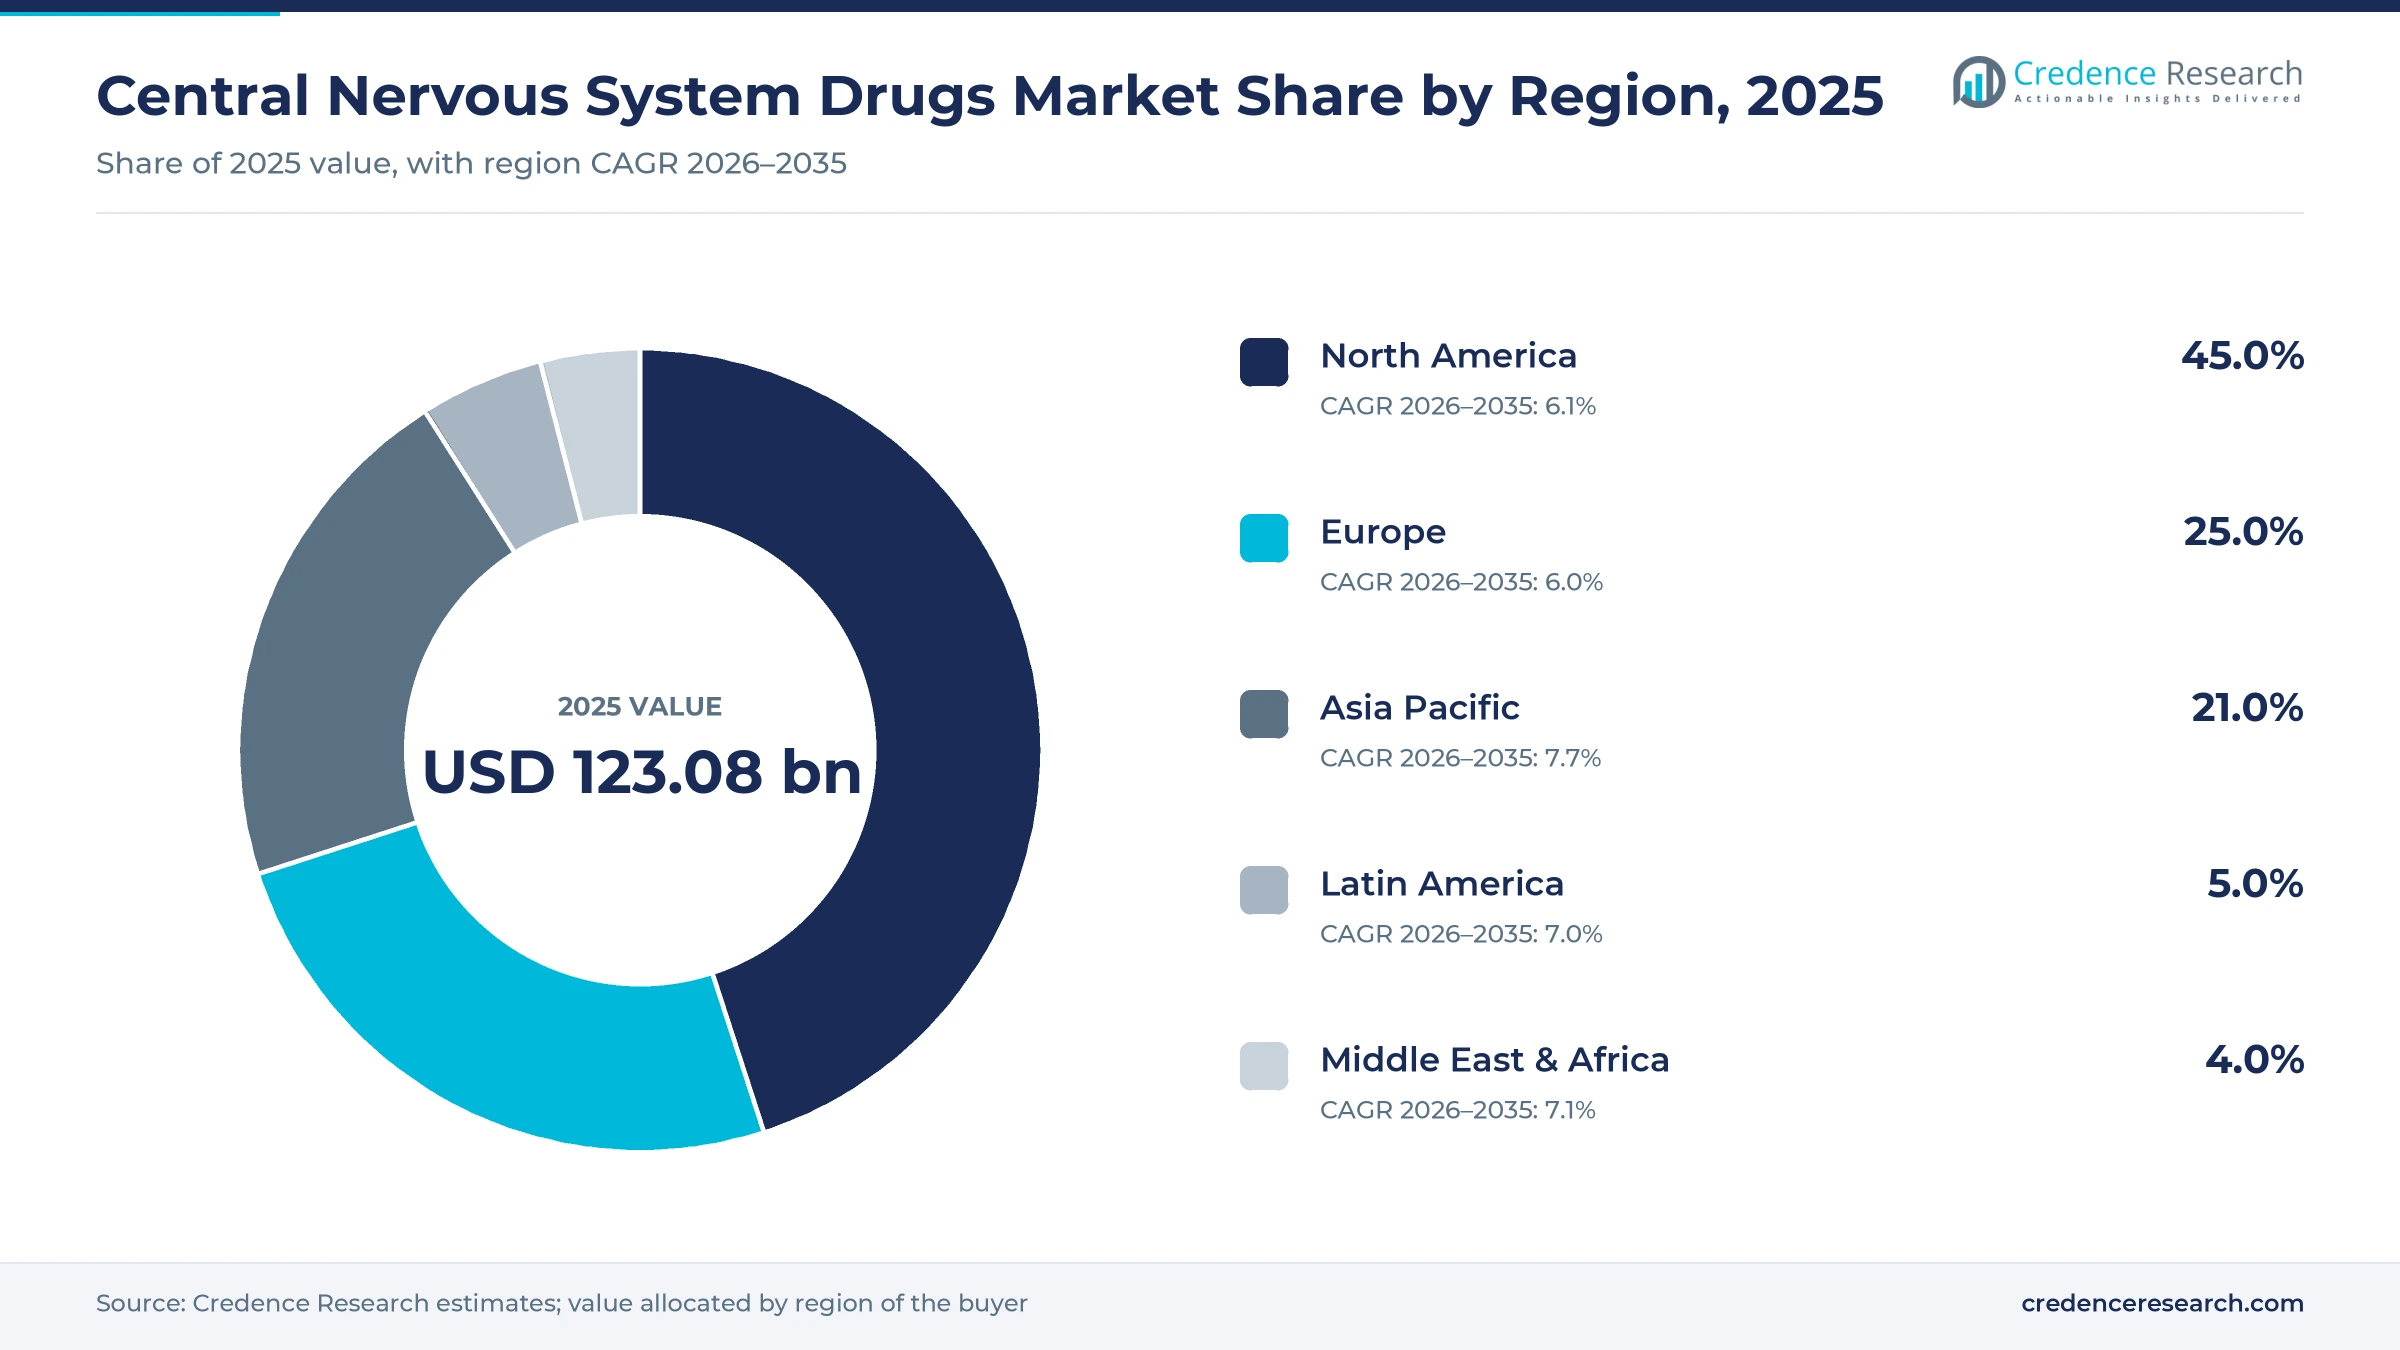
The global central nervous system (CNS) drugs market was valued at USD 123.08 billion in 2025 and is projected to increase from USD 131.12 billion in 2026 to USD 231.76 billion by 2035, registering a CAGR of 6.53% during 2026–2035. Demand comes from billions of people living with stroke, migraine, epilepsy, dementia, Parkinson's disease, depression, schizophrenia and attention disorders, many of whom take medicines for years. North America held the largest regional share, 45.0% in 2025, because branded psychiatric, pain and sleep medicines carry high prices there. Asia Pacific is the fastest-growing region at 7.7% a year, as China, India and Southeast Asia diagnose and treat more patients with brain and mental health conditions. The treatment picture changed in September 2024, when U.S. regulators approved the first schizophrenia medicine that does not act on dopamine receptors. As a result, new mechanisms now offset part of the value that generic entry removes from older classes.
Which brain and mental health medicines does the analysis cover?
The analysis counts prescription medicines that act on the brain and spinal cord, grouped into stimulants and depressants, and used for neurological and psychiatric conditions, valued at manufacturer selling prices. Hospital pharmacies supply medicines started during admissions and procedures, while retail and online pharmacies dispense the tablets, capsules, injections and patches that patients use at home.
Medical devices, neurostimulation systems, diagnostic tests and over-the-counter sleep aids sit outside the scope of this analysis. The value chain runs from active ingredient producers through originator and generic manufacturers to wholesalers, pharmacy benefit managers, hospital formularies and national payers, with controlled substance rules applied at each step.
Central Nervous System Drugs Market Insights
- The central nervous system drugs market grows from USD 123.08 billion in 2025 to USD 231.76 billion by 2035, a 6.53% CAGR driven by disease burden and new mechanisms.
- North America held 45.0% of global central nervous system drug value in 2025, supported by high branded prices and wide insurance coverage.
- CNS depressants led drug classes with 70.0% of 2025 value, while CNS stimulants grow fastest at 7.0% a year.
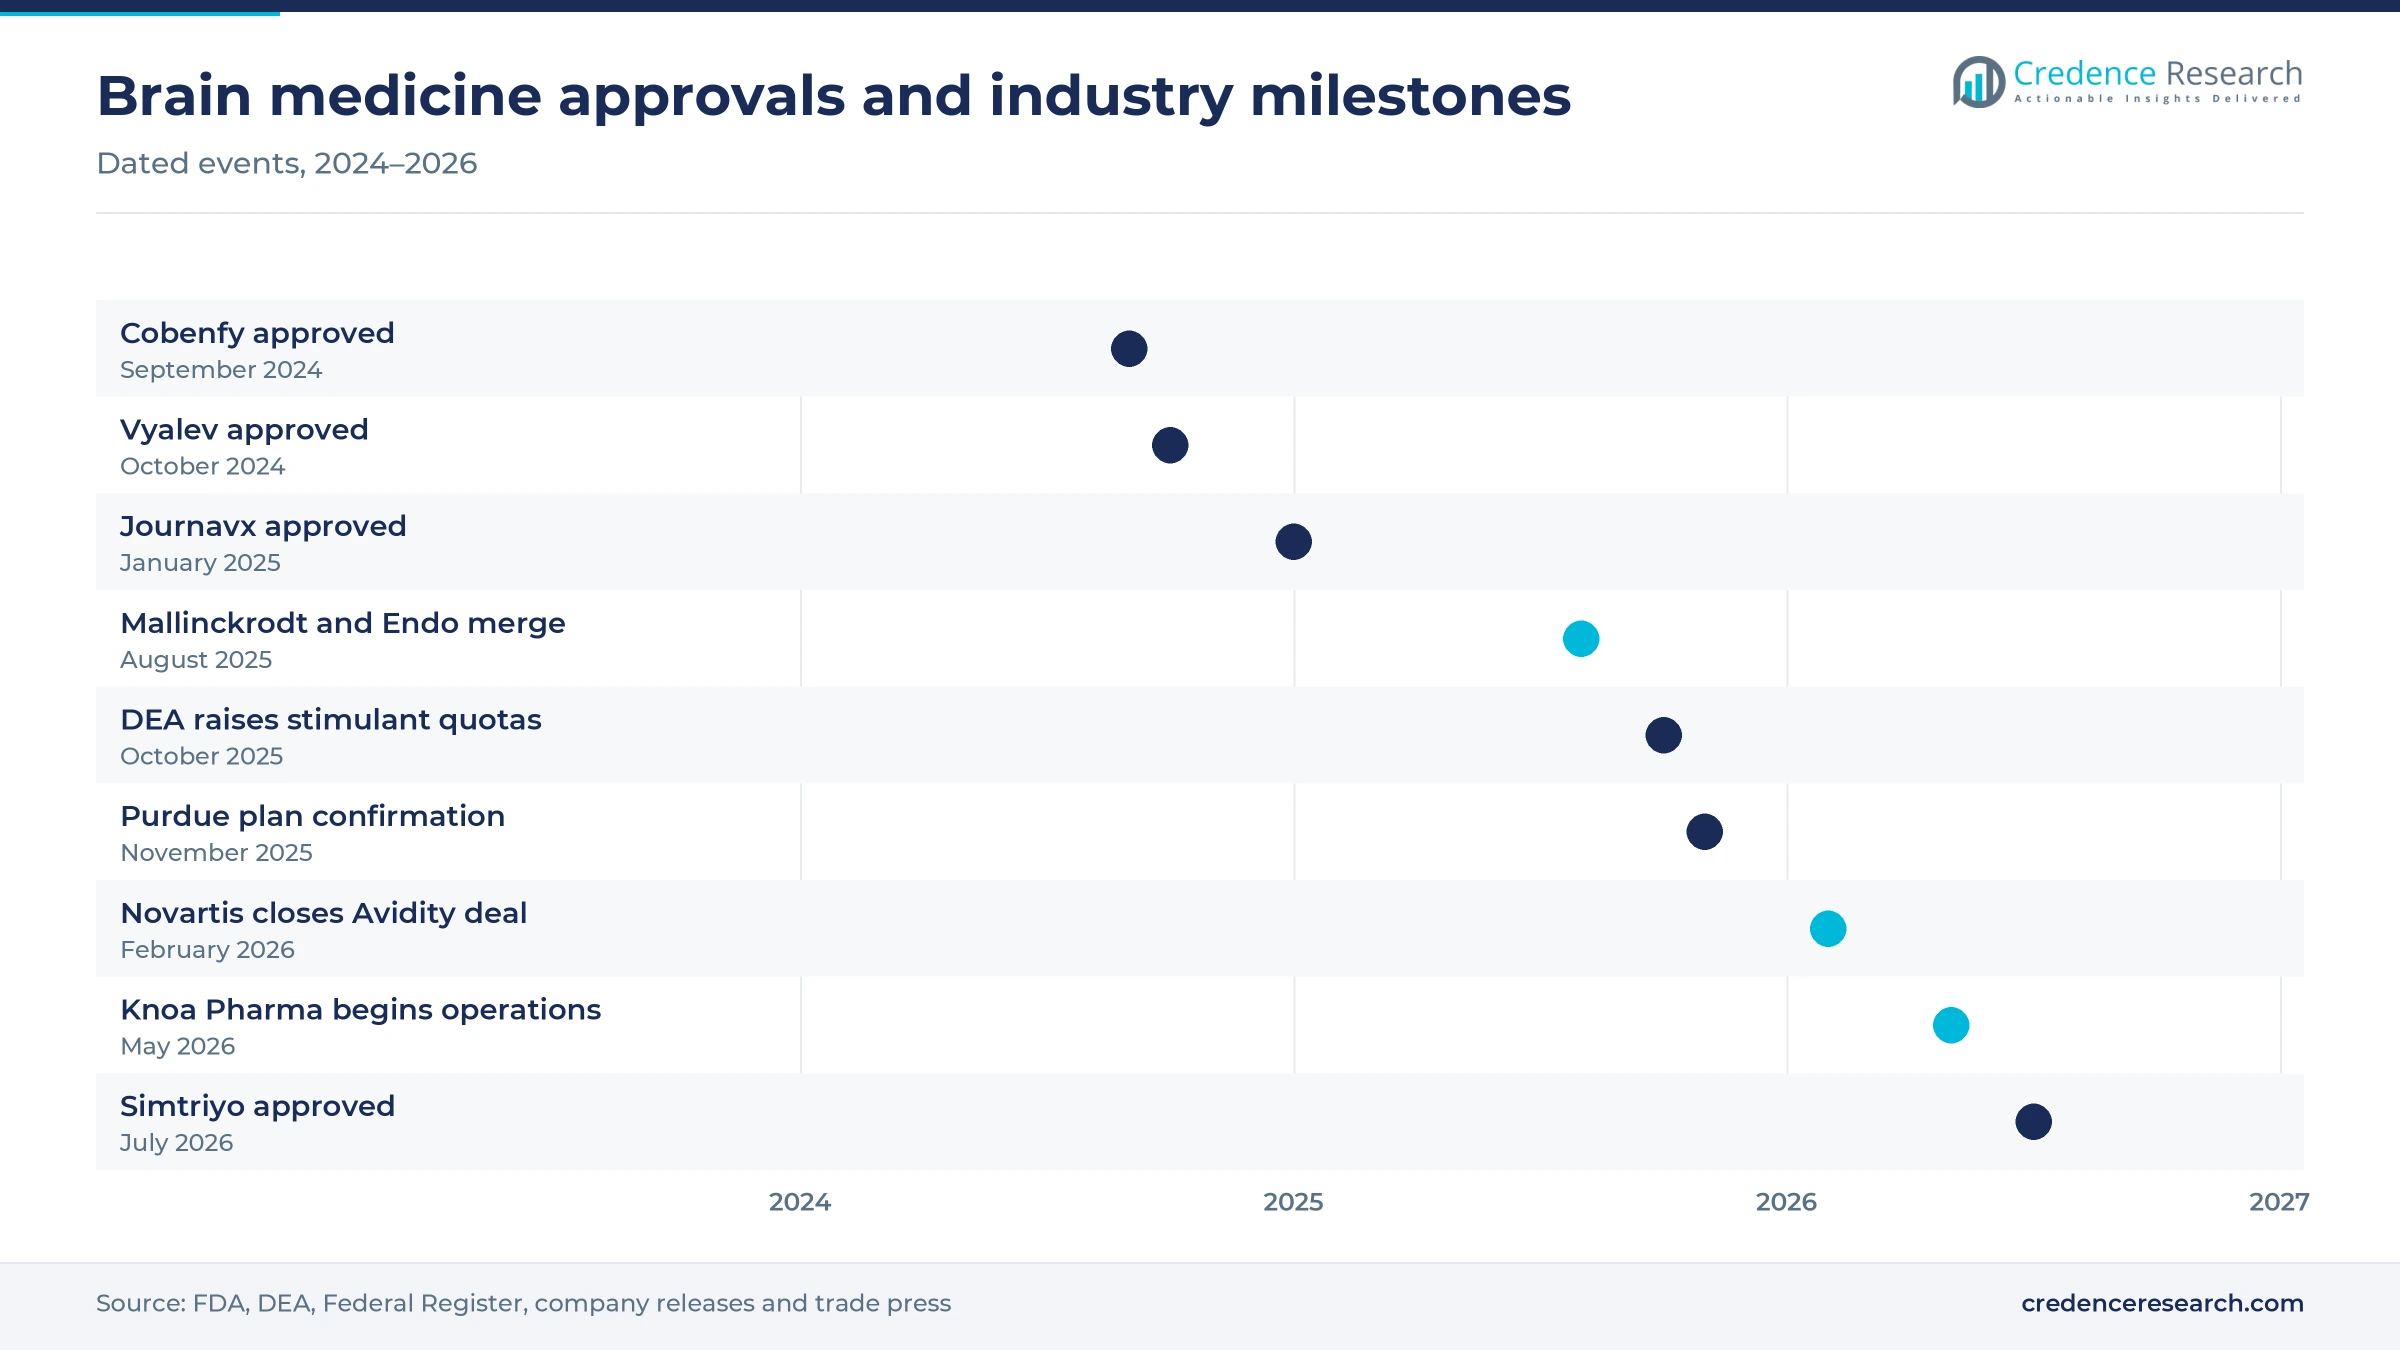
- In September 2024, the FDA approved Cobenfy, the first schizophrenia medicine that targets cholinergic rather than dopamine receptors.
- In February 2026, Novartis completed its acquisition of Avidity Biosciences, adding three late-stage neuromuscular programs to its neuroscience pipeline.
Depressants lead as stimulants and injectables gain
Why do CNS depressants account for most spending?
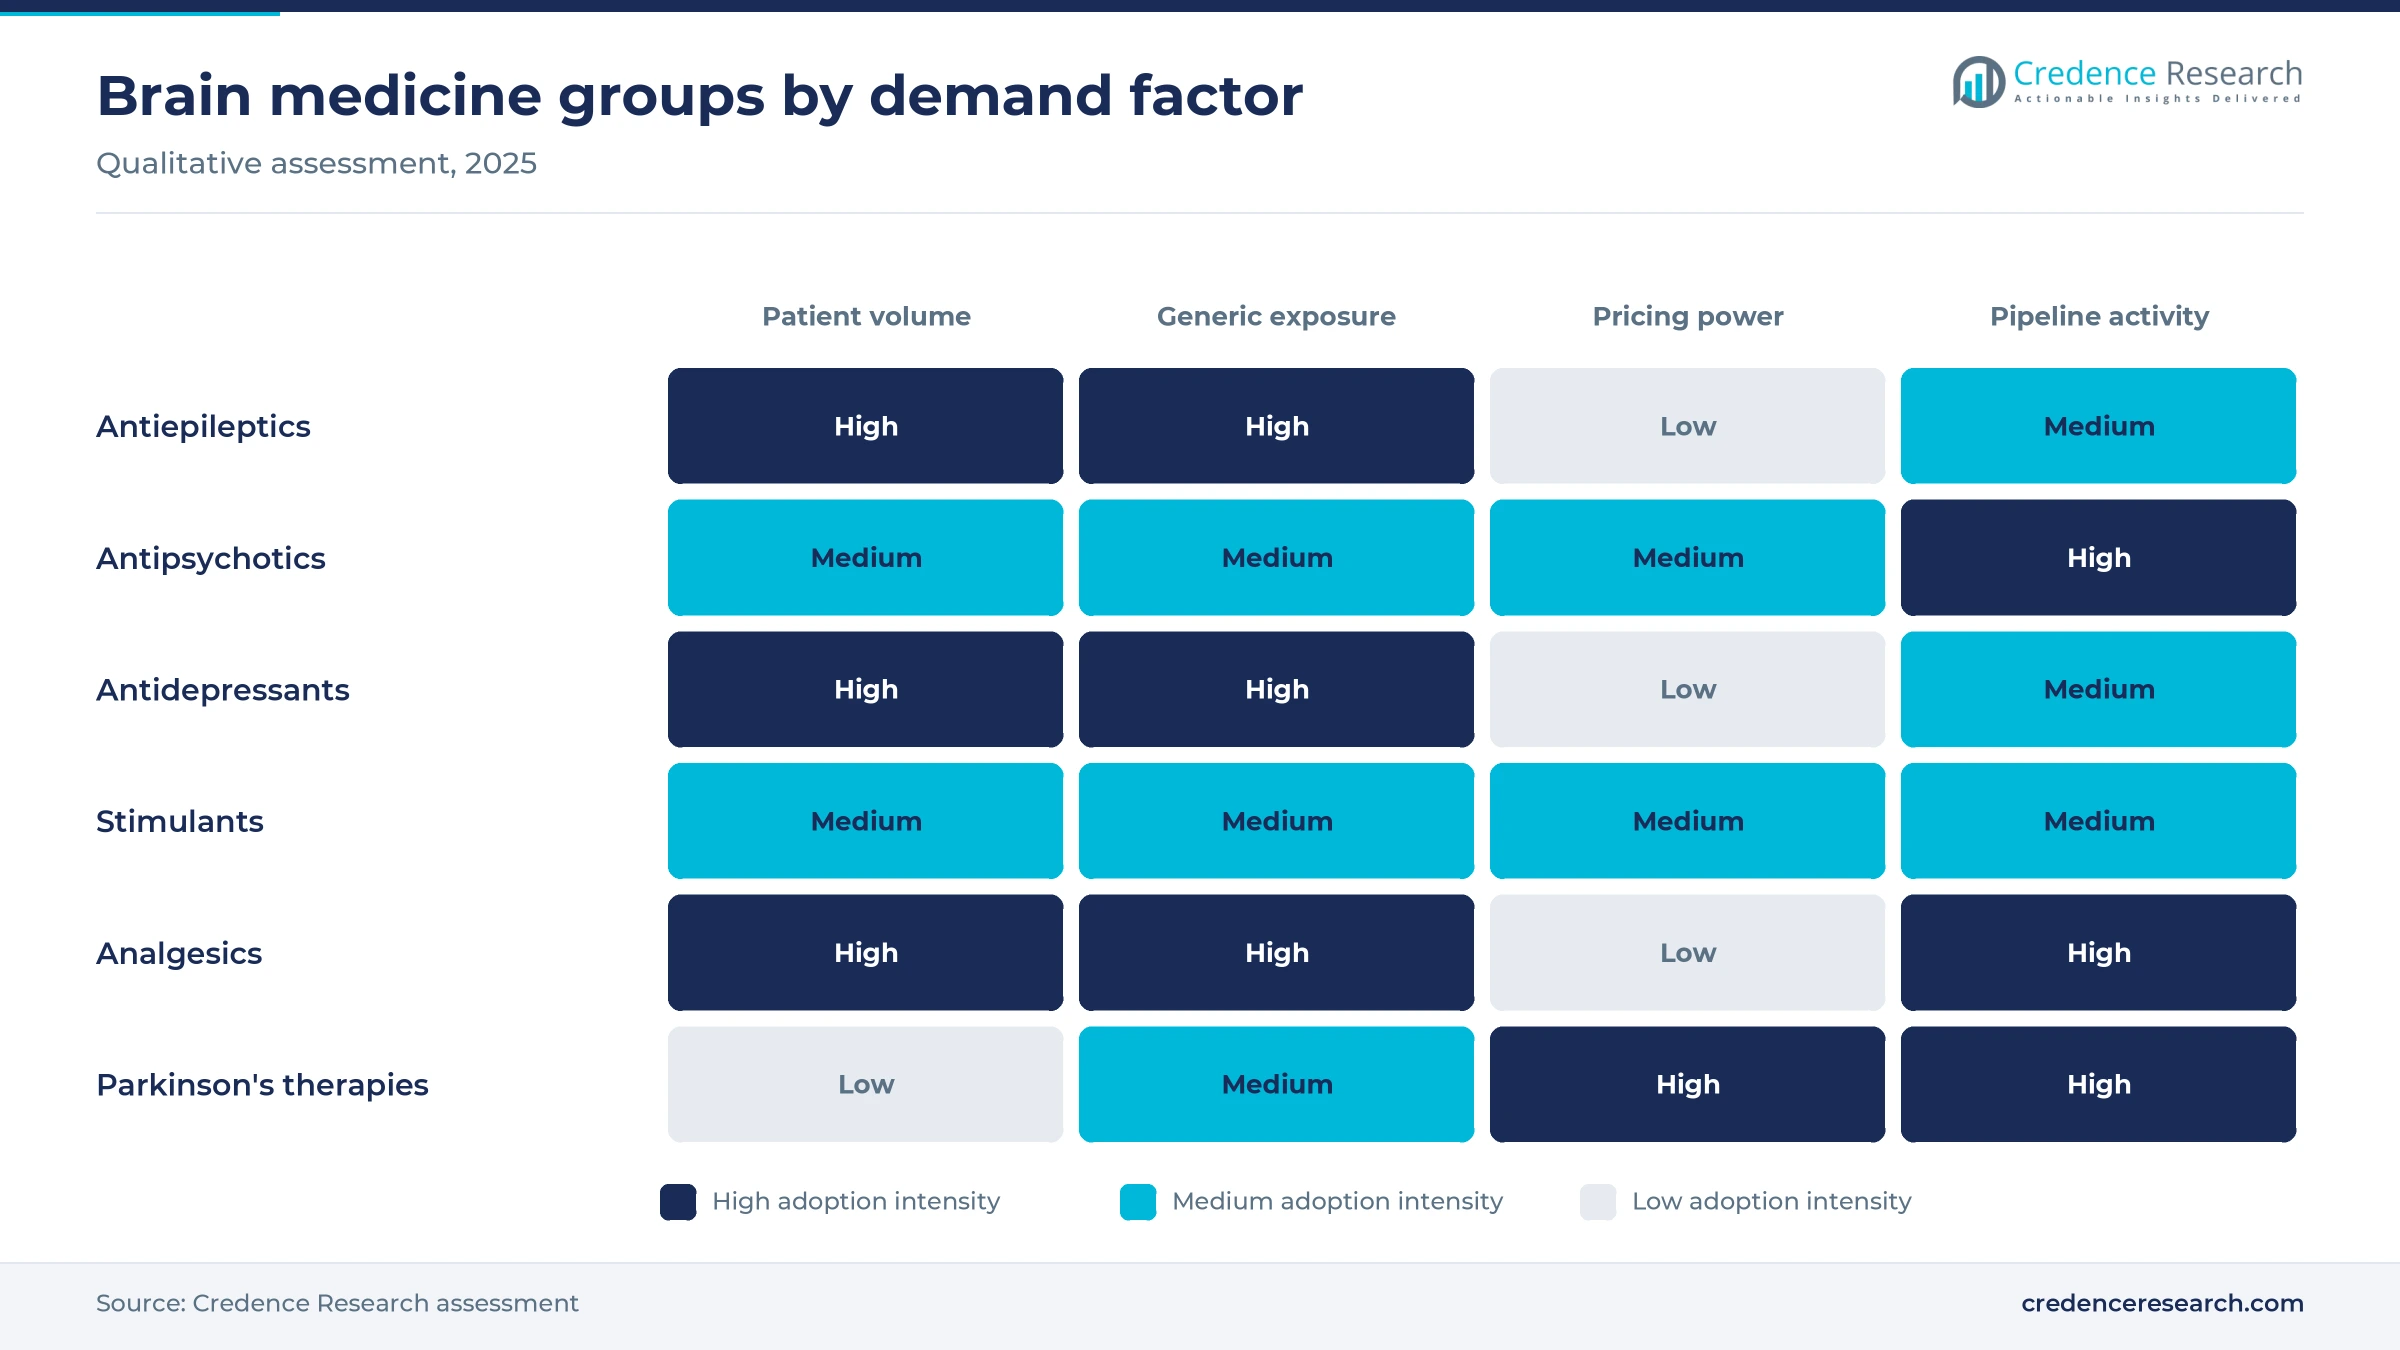
Based on drug class, the market is categorized into CNS stimulants and CNS depressants. CNS Depressants led with a 70.0% share of 2025 value, because the group spans sedatives, anxiolytics, anticonvulsants, antipsychotics and opioid analgesics used across many conditions. CNS Stimulants grow fastest at 7.0% a year, as adult diagnosis of attention disorders rises and U.S. regulators raised 2025 production quotas for amphetamine and methylphenidate. This mix keeps depressants dominant on value while stimulants add share.
Which conditions drive most central nervous system prescriptions?
Based on indication, the market is categorized into neurological conditions and psychiatric conditions. Neurological Conditions led with a 54.0% share of 2025 value, because epilepsy, migraine, Parkinson's disease, dementia and chronic pain need long-term treatment. Psychiatric Conditions grow fastest at 6.8% a year, as schizophrenia, depression and ADHD treatment gain new mechanisms and wider telehealth access. As a result, psychiatry draws a larger part of new launch activity.
Where do patients fill long-term brain medicine prescriptions?
Based on distribution channel, the market is categorized into hospital pharmacies, retail pharmacies, online pharmacies and others. Retail Pharmacies led with a 50.0% share of 2025 value, because patients refill antiepileptic, antidepressant and stimulant prescriptions at community pharmacies every month. Online Pharmacies grow fastest at 8.6% a year, as e-pharmacy platforms and telehealth prescribing expand. Hospital pharmacies handle infusions, injections and medicines started during hospital admissions.
Why do oral forms dominate while injectables gain?
Based on route of administration, the market is categorized into oral, injectable and patches. Oral forms led with a 76.0% share of 2025 value, because tablets and capsules remain the standard for chronic neurological and psychiatric care. Injectable forms grow fastest at 7.5% a year, as long-acting antipsychotics, antibody therapies and continuous subcutaneous infusions for Parkinson's disease gain use. Patches serve patients who cannot swallow pills or need steady delivery.
| Segment Group | Leading Sub-segment | Share, 2025 | Fastest-growing Sub-segment | CAGR, 2026–2035 |
|---|---|---|---|---|
| By Drug Class | CNS Depressants | 70.0% | CNS Stimulants | 7.0% |
| By Indication | Neurological Conditions | 54.0% | Psychiatric Conditions | 6.8% |
| By Distribution Channel | Retail Pharmacies | 50.0% | Online Pharmacies | 8.6% |
| By Route of Administration | Oral | 76.0% | Injectable | 7.5% |
Request a Free Sample
Fill in your details and we'll send you a free sample report.
- Sample data tables & charts
- Research methodology
Neurological burden and psychiatric need drive demand
Four forces explain most of the growth in brain and mental health medicines, and each one either adds treated patients or raises the value of each treatment course. Disease burden and aging set the size of the patient pool, while supply rules and telehealth decide how many of those patients actually start and stay on therapy.
How does the global burden of neurological conditions sustain demand?
Neurological conditions form the largest source of demand, because most patients need medicines for years or for life. In March 2024, the World Health Organization reported that more than 3 billion people lived with a neurological condition in 2021. The overall burden rose by 18% since 1990, and over 80% of neurological deaths and health loss occurred in low- and middle-income countries. As a result, wider diagnosis in these countries adds large numbers of long-term patients.
Why do aging populations raise use of brain medicines?
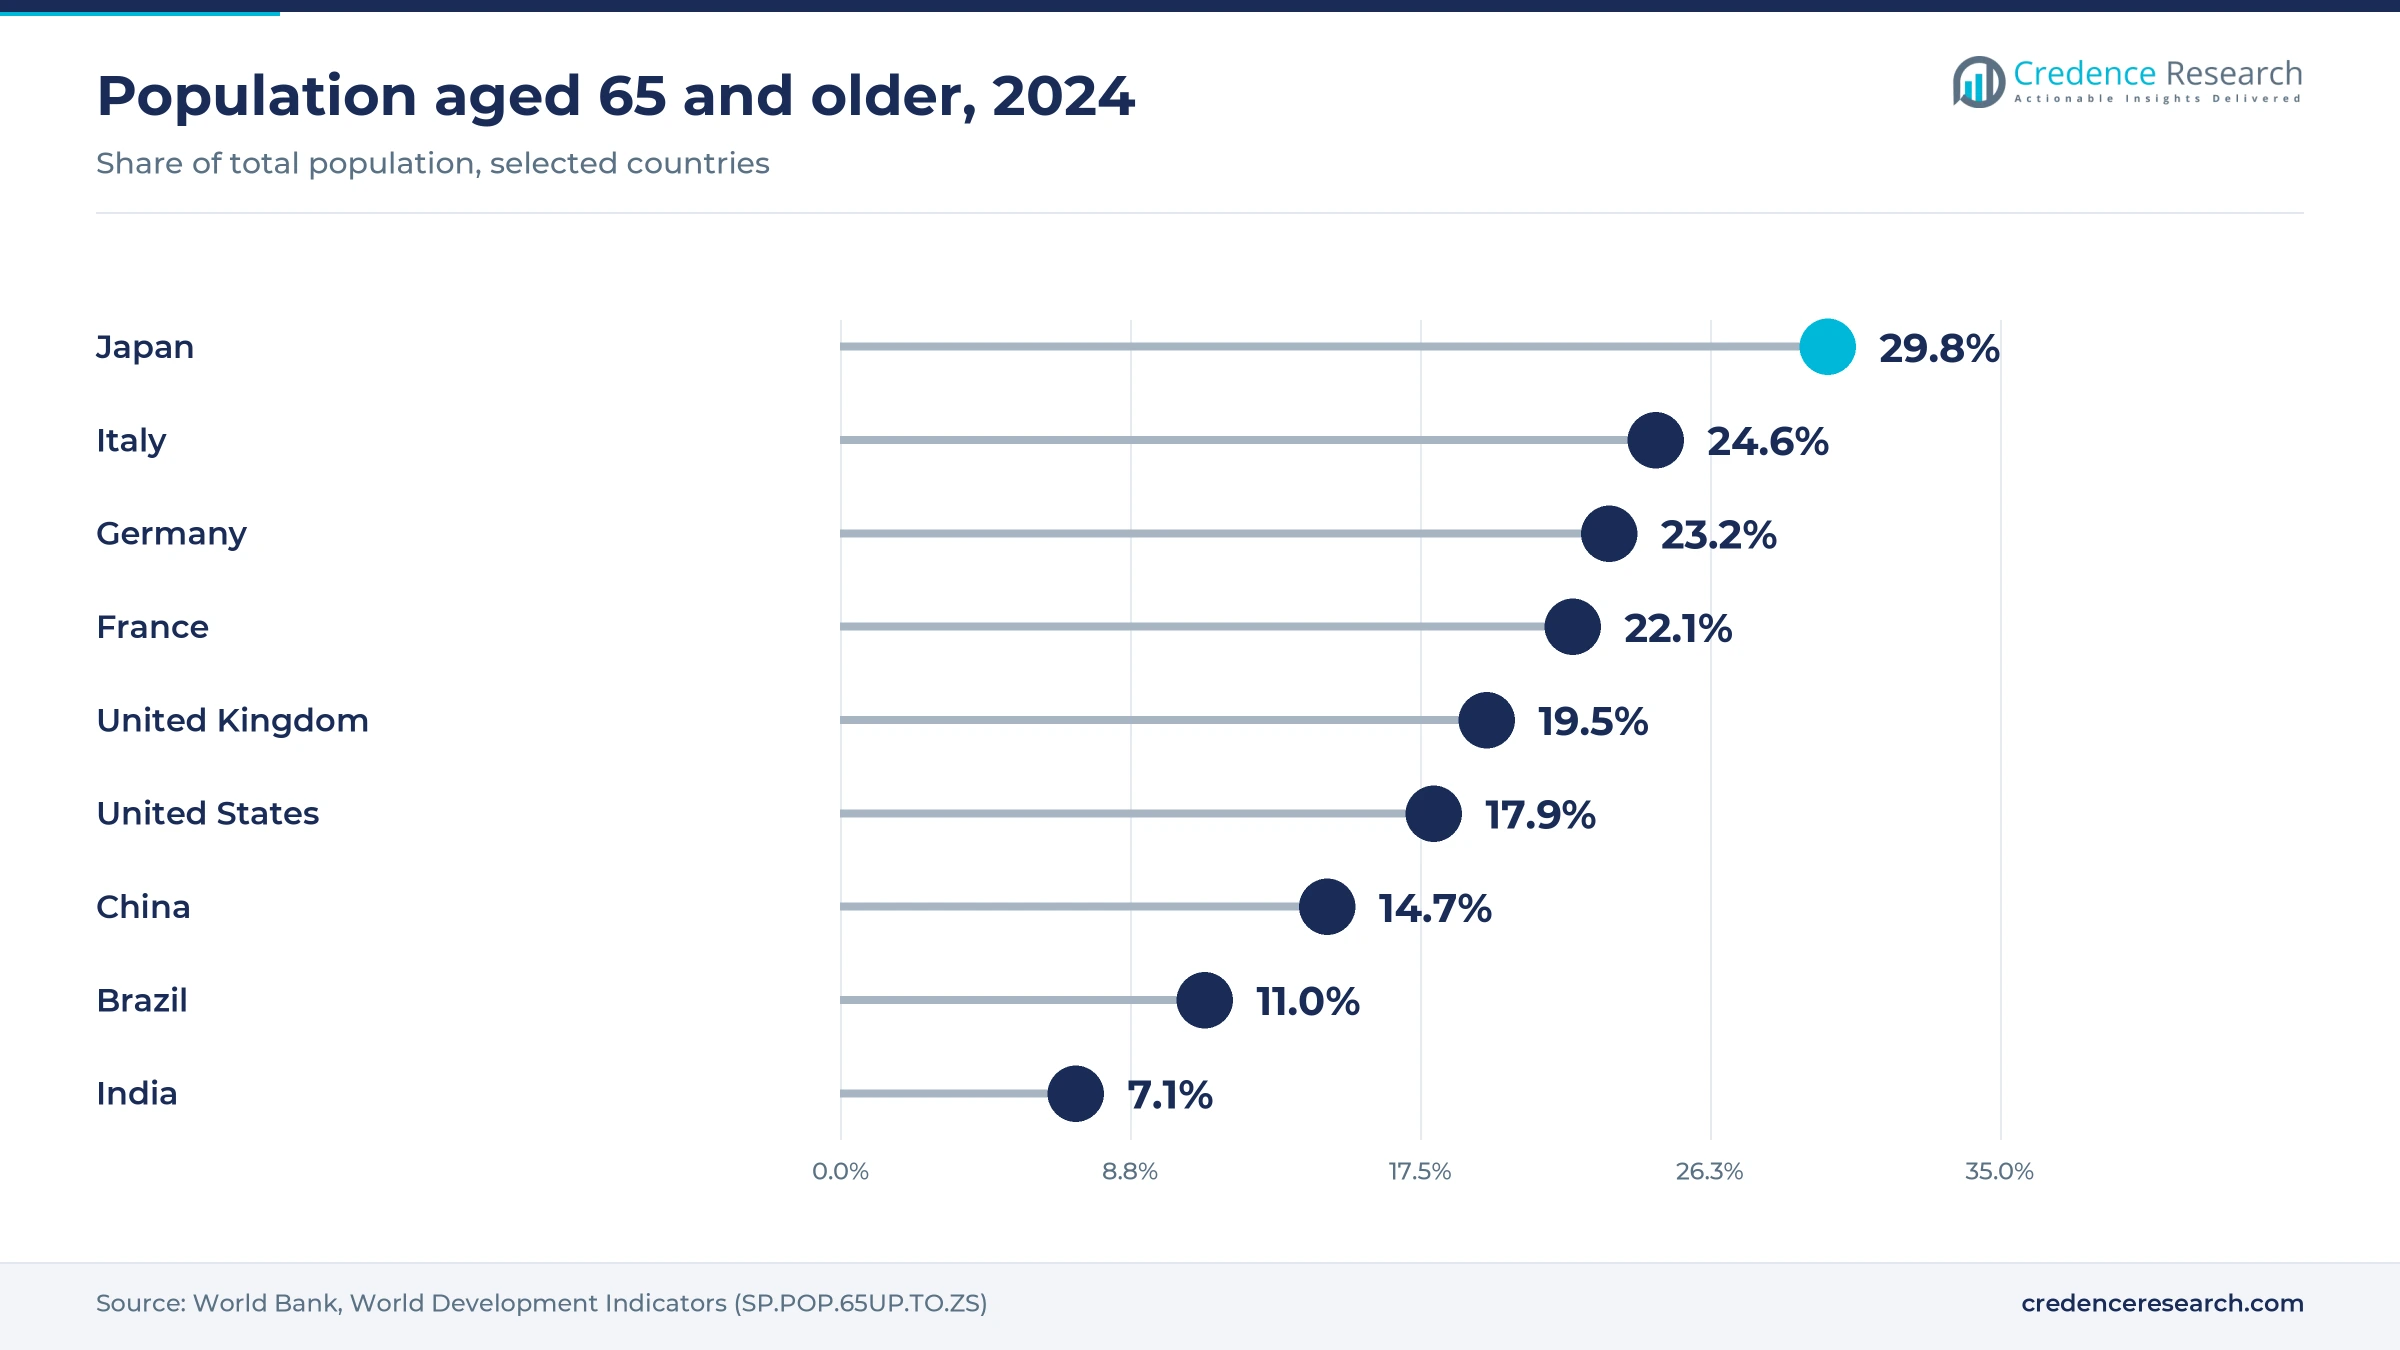
Aging populations widen the patient pool, because the risk of dementia, Parkinson's disease, stroke and chronic pain rises sharply with age. People aged 65 and older made up 29.8% of Japan's population and 24.6% of Italy's in 2024, according to World Bank data. Older patients often combine an antidepressant, a sleep medicine and an anticonvulsant or pain medicine. In turn, medicine use per patient rises even where population growth has stalled. This effect is strongest in Japan, Southern Europe and China, where the share of older residents keeps climbing each year.
How is rising stimulant demand changing supply rules?
Demand for attention disorder medicines has grown faster than supply, which pushed U.S. regulators to act on production limits. In October 2025, the Drug Enforcement Administration published a final order raising 2025 quotas for d-amphetamine from 21.2 million grams to 26.45 million grams, citing shortages. The same order lifted methylphenidate from 53.28 million grams to 58.28 million grams. As a result, manufacturers can supply more stimulant prescriptions in the United States.
Why does telehealth widen access to psychiatric care?
Telehealth widens access to psychiatric care, because many patients live far from specialists or face long waits for clinic appointments. U.S. regulators extended telemedicine flexibilities for prescribing controlled substances through Dec. 31, 2026, after earlier extensions through 2024 and 2025. This allows clinicians to start some controlled medicines without an in-person visit. In turn, more patients with attention, anxiety and opioid use disorders begin and continue treatment. Online pharmacies then fill many of these prescriptions, which links telehealth growth to the fastest-growing distribution channel.
New mechanisms reshape schizophrenia, pain and ADHD
How is a muscarinic mechanism reshaping schizophrenia care?
Schizophrenia treatment is shifting toward mechanisms beyond dopamine blockade, which has defined antipsychotic therapy for decades. In September 2024, the FDA approved Cobenfy from Bristol Myers Squibb, the first schizophrenia medicine that targets cholinergic receptors. The agency noted that about 1% of Americans live with schizophrenia. As a result, companies are testing other muscarinic agents, and prescribers gain an option for patients who do not tolerate older medicines.
Is acute pain care moving away from opioids?
Acute pain care is shifting toward non-opioid options, because addiction risk has made prescribers and payers wary of opioid analgesics. In January 2025, Vertex announced FDA approval of Journavx, which it described as the first new class of pain medicine approved in more than 20 years. The medicine blocks pain signals in peripheral nerves rather than the brain. In turn, non-opioid pain treatment could take share from short opioid courses after surgery.
Can continuous infusions open premium Parkinson's niches?
Continuous delivery for advanced Parkinson's disease is a clear opening, because oral levodopa wears off and causes motor swings as the disease progresses. In October 2024, AbbVie announced FDA approval of Vyalev, the first 24-hour subcutaneous levodopa-based infusion in the United States. The therapy targets motor fluctuations in adults with advanced disease. As a result, Parkinson's disease therapies gain a premium injectable segment beside generic tablets.
Where can non-stimulant attention medicines win share?
Non-stimulant medicines for attention disorders are an emerging opening, because shortages and abuse concerns limit stimulant use for some patients. In July 2026, Otsuka received FDA approval for Simtriyo, a once-daily triple reuptake inhibitor for patients aged 6 and older and adults. The medicine acts on norepinephrine, dopamine and serotonin reuptake at the same time. In turn, prescribers gain an option for patients who cannot use or obtain standard stimulant products.
Quotas, opioid liability and generics limit value
How do production quotas constrain stimulant supply?
Production quotas constrain supply, because schedule II stimulants and opioids can only be made within limits that U.S. regulators set each year. When demand outruns these limits, pharmacies face shortages and patients switch products or miss doses. The 2025 quota increases eased pressure, yet manufacturers still need DEA approval for active ingredient volumes. As a result, supply planning for controlled medicines stays slower than for other prescription classes.
Why does opioid liability weigh on pain medicine makers?
Opioid litigation has reshaped the pain medicine business, because large settlements have forced several manufacturers into restructuring. In November 2025, a U.S. bankruptcy court indicated it would confirm the Purdue Pharma plan, which provides about USD 7.4 billion for creditors. Purdue ceased operations on May 1, 2026, and its assets moved to Knoa Pharma, which is owned by a foundation and cannot promote opioids. In turn, branded opioid promotion has largely ended in the United States.
Why does generic entry erode branded value?
Generic entry erodes value across mature classes, because most antidepressants, anticonvulsants, antipsychotics and stimulants are now available from many manufacturers. Companies such as Amneal, Lannett and Rhodes Pharmaceuticals compete mainly on price and supply reliability. Tenders in Europe and price controls in Asia push generic prices even lower. As a result, rising prescription volumes translate into much slower value growth for established molecules.
Why do brain disorder trials carry high failure risk?
Clinical trials for brain disorders fail more often than in many other fields, because placebo responses are high and disease biology is hard to measure. Psychiatric trials rely on rating scales, while neurodegenerative trials need large groups followed for years. Safety concerns such as sedation, dependence and brain swelling with some antibody therapies also narrow eligible patients. In turn, smaller developers often license assets to larger partners before late-stage testing.
North America leads as Asia Pacific expands access
| Region | Value, 2025 (USD billion) | Share, 2025 | CAGR, 2026–2035 |
|---|---|---|---|
| North America | 55.39 | 45.0% | 6.1% |
| Europe | 30.77 | 25.0% | 6.0% |
| Asia Pacific | 25.85 | 21.0% | 7.7% |
| Latin America | 6.15 | 5.0% | 7.0% |
| Middle East & Africa | 4.92 | 4.0% | 7.1% |
Why does North America hold the largest regional share?
North America held a 45.0% share of 2025 value and grows at 6.1% a year through 2035. The United States drives this position, because branded antipsychotics, sleep medicines, migraine therapies and new pain agents carry the highest prices there. Telehealth prescribing rules extended through 2026 support access to controlled medicines. However, opioid restrictions and stimulant quotas keep parts of the market tightly managed, and 17.9% of U.S. residents were 65 or older in 2024.
How fast is Asia Pacific adding treated patients?
Asia Pacific held a 21.0% share of 2025 value and is the fastest-growing region at 7.7% a year. China and India are expanding diagnosis of epilepsy, depression and dementia, which adds large numbers of long-term patients. Japan contributes high-value demand from the oldest population among major economies, while 14.7% of China's residents were 65 or older in 2024. Otsuka, based in Japan, also supplies psychiatric medicines across the region and to export markets.
What shapes demand across Europe?
Europe held a 25.0% share of 2025 value and grows at 6.0% a year, the slowest pace of the five regions. Germany, France, the United Kingdom, Italy and Spain use tenders and reference pricing that hold down medicine prices. People aged 65 and older made up 23.2% of Germany's population and 22.1% of France's in 2024, which sustains demand for dementia and Parkinson's care. However, health technology assessment bodies often restrict newer agents to narrow patient groups.
Where is Latin America adding demand?
Latin America held a 5.0% share of 2025 value and grows at 7.0% a year through 2035. Brazil and Mexico lead regional demand, and 11.0% of Brazil's residents were 65 or older in 2024. Public health systems buy generic antiepileptic and antidepressant medicines in tenders, while private insurers cover more branded psychiatric agents.
What limits growth in the Middle East and Africa?
The Middle East and Africa held a 4.0% share of 2025 value and grows at 7.1% a year through 2035. Gulf states add higher-value demand from specialist neurology and psychiatry centers that use branded medicines. Many countries in sub-Saharan Africa still have few neurologists and psychiatrists, which keeps treatment rates and spending low.
Approvals, restructurings and deals since 2024
| Development | Status and market relevance |
|---|---|
| In September 2024, the FDA approved Cobenfy from Bristol Myers Squibb, the first schizophrenia medicine targeting cholinergic receptors. | On market; adds a new mechanism beyond dopamine blockade |
| In October 2024, AbbVie announced FDA approval of Vyalev, a 24-hour subcutaneous levodopa-based infusion for advanced Parkinson's disease. | On market; adds premium injectable value in Parkinson's care |
| In January 2025, Vertex announced FDA approval of Journavx, the first new class of pain medicine in more than 20 years. | On market; offers a non-opioid option for acute pain |
| In February 2026, Novartis completed its acquisition of Avidity Biosciences, adding three late-stage neuromuscular programs. | Completed; strengthens a large neuroscience pipeline |
| In July 2026, Otsuka received FDA approval for Simtriyo (centanafadine) for attention disorders in children and adults. | Approved; adds a triple reuptake inhibitor option |
Novel receptor targets lead the neuroscience pipeline
- Muscarinic receptor agonists such as xanomeline treat schizophrenia without blocking dopamine, which avoids some movement side effects of older antipsychotics.
- Peripheral sodium channel blockers such as suzetrigine stop pain signals in nerves outside the brain, which avoids the addiction risk linked to opioids.
- Continuous subcutaneous infusions deliver levodopa over 24 hours, which smooths the motor swings that patients with advanced Parkinson's disease face on tablets.
- Antibody oligonucleotide conjugates carry genetic medicines into muscle and nerve tissue, and Novartis gained this platform through its Avidity acquisition.
Need a Custom Version of This Report?
Tailor the scope, geography, or segments to your exact requirements.
- Custom geography or segment scope
- Direct access to our analyst team
Originators bet on mechanisms as generic makers win volume
Competition splits between originators with first-in-class neuroscience medicines and a large group of generic and specialty companies that supply most prescription volume. AbbVie adds Vyalev in Parkinson's disease beside a broad psychiatry portfolio, while Novartis completed the Avidity Biosciences acquisition in February 2026 to expand its neuroscience pipeline. Otsuka gained U.S. approval for Simtriyo in attention disorders, and Pfizer and Jazz Pharmaceuticals keep established positions in pain, sleep and neurology. Specialty firms such as Aytu BioPharma, Azurity and Noven compete with reformulated products, including patches and liquid forms. Amneal, Lannett, Par Health and Knoa Pharma, which now owns Rhodes Pharmaceuticals, supply generic stimulants, opioids and other controlled medicines under production quotas. Purdue Pharma ended operations in May 2026, and its products moved to Knoa Pharma under foundation ownership. As a result, originators compete on mechanisms and outcomes data, while generic makers compete on cost, quota access and supply reliability.
Companies profiled and their roles in this market
| Company | Type | Role in the market |
|---|---|---|
| AbbVie Inc. | Originator | Vyalev subcutaneous infusion for advanced Parkinson's disease |
| Novartis AG | Originator | Neuroscience pipeline expanded through Avidity Biosciences |
| Otsuka Holdings Co. Ltd. | Originator | Psychiatric medicines and Simtriyo for attention disorders |
| Pfizer Inc. | Originator | Established pain and neurology medicines |
| Jazz Pharmaceuticals Plc | Originator | Sleep and neurology medicines |
| Amneal Pharmaceuticals Inc. | Generics and specialty | Generic and specialty neurology products |
| Par Health | Generics | Generic controlled medicines from the former Mallinckrodt and Endo generics businesses |
| Knoa Pharma (Rhodes Pharmaceuticals) | Generics and branded | Purdue successor since May 2026; opioid and stimulant medicines including Rhodes generics |
| Lannett Co Inc. | Generics | Generic prescription medicines |
| Azurity Pharmaceuticals Inc. | Specialty | Reformulated medicines for patients with special needs |
| Aytu BioPharma Inc. | Specialty | Prescription medicines for attention disorders |
| Noven Pharmaceuticals Inc. | Specialty | Transdermal patch medicines |
Value moves toward first-in-class neuroscience agents
Credence Research's view is that value in central nervous system medicines will shift toward first-in-class agents through 2035, because generic entry and controlled substance rules limit pricing for most established classes. The overall market still grows at 6.53% a year, supported by aging populations and wider treatment of mental health conditions in Asia Pacific. The best value opportunities sit in new schizophrenia mechanisms, non-opioid pain relief, attention disorder options and continuous Parkinson's therapy. Companies that pair outcomes data with reliable supply will hold value, while generic makers win volume through cost.
How Credence Research sized brain medicine spending
The report uses 2025 as the base year and 2026 to 2035 as the forecast period. Market values come from the Credence Research model, which builds spending by drug class, indication, distribution channel, route of administration and region. Regional and segment splits are Credence Research estimates informed by World Health Organization and World Bank statistics, U.S. regulator decisions, Federal Register orders and company press releases. No primary interviews or surveys were used in preparing this edition.
Brain and mental health medicine outlook to 2035
By 2035, the central nervous system drugs market is projected to reach USD 231.76 billion, with growth led by psychiatric conditions, injectable forms and new mechanisms. CNS depressants will remain the larger class, but generic entry will slow their value growth. North America keeps the highest value per patient, while Asia Pacific adds the most newly treated patients. Online pharmacies and telehealth will handle a larger share of refills for long-term medicines. As a result, advantage will depend on outcomes data, quota access and patient reach.
Frequently Asked Questions
How big is the global central nervous system drugs market?
Which drug class leads central nervous system drug spending?
Which region leads central nervous system drug spending?
Which indication accounts for the most spending?
What new central nervous system medicines were approved recently?
How do DEA quotas affect stimulant supply?
Who are the leading central nervous system drug companies?
What restrains growth in central nervous system drugs?
Table of Content
Chapter 1 Market Segmentation
- 1.1 Segmentation Framework
- 1.1.1 Product and Service Classification
- 1.1.2 Application and End-Use Classification
- 1.1.3 Technology and Solution Classification
- 1.1.4 Customer and Distribution Channel Classification
- 1.1.5 Geographic Segmentation
- 1.1.6 Market Segment Definitions and Boundaries
- 1.2 By Drug Class
- 1.2.1 CNS Depressants
- 1.2.2 CNS Stimulants
- 1.3 By Indication
- 1.3.1 Neurological Conditions
- 1.3.2 Psychiatric Conditions
- 1.4 By Route of Administration
- 1.4.1 Oral
- 1.4.2 Injectable
- 1.4.3 Patches
Chapter 2 Introduction
- 2.1 Report Objectives and Scope
- 2.2 Product Definition and Industry Terminology
- 2.3 Market Inclusions and Exclusions
- 2.4 Research Process
- 2.4.1 Primary Research and Expert Interviews
- 2.4.2 Secondary Research and Source Review
- 2.4.3 Top-Down and Bottom-Up Estimation
- 2.4.4 Data Triangulation and Verification
- 2.5 Market Size Measurement Basis
- 2.5.1 2025: USD 123.08 billion → 2035: USD 231.76 billion
- 2.6 Historical and Forecast Reference Periods
- 2.6.1 Historical Period: 2018-2025
- 2.6.2 Base Year: 2025
- 2.6.3 Forecast Period: 2025-2035
- 2.7 Research Assumptions and Limitations
Chapter 3 Executive Summary
- 3.1 Market Snapshot and Key Findings
- 3.2 Base-Year Market Size, 2025
- 3.3 Forecast Market Size, 2035
- 3.4 Revenue and Volume Growth Outlook
- 3.5 Key Demand and Supply Indicators
- 3.6 Leading Market Segments
- 3.7 Fastest-Growing Market Opportunities
- 3.8 Regional Performance Highlights
- 3.9 Technology and Industry Transformation
- 3.10 Competitive Landscape Summary
- 3.11 Analyst View and Strategic Implications
Chapter 4 Global Central Nervous System Drugs Market Trends and Developments
- 4.1 Historical Industry Development, 2018-2025
- 4.2 Recent Market Trends and Developments
- 4.3 Demand and Customer Behavior Trends
- 4.4 Technology and Product Innovation
- 4.5 Artificial Intelligence, Automation and Digitalization
- 4.6 Local Manufacturing and Supply Chain Realignment
- 4.7 Industry Partnerships, Mergers and Acquisitions
- 4.8 Sustainability and Circular Economy Developments
- 4.9 Government and Private Sector Investment Trends
- 4.10 Emerging Business Models and Commercialization
- 4.11 Industry Developments and Announcements
Chapter 5 Global Central Nervous System Drugs Market Production, Supply and Demand Analysis
- 5.1 Demand Trend and Consumption Analysis, 2018-2025
- 5.2 Demand Forecast, 2025-2035
- 5.3 Production and Output Trend, 2018-2025
- 5.4 Production and Output Forecast, 2025-2035
- 5.5 Installed Capacity and Capacity Utilization
- 5.6 Company-Wise Production Plants and Statistics
- 5.6.1 Installed Production Capacity
- 5.6.2 Actual Production
- 5.6.3 Planned Capacity and Expansion Targets
- 5.7 Supply Chain Structure and Procurement Trends
- 5.8 Supply-Demand Gap and Bottlenecks
- 5.9 Import Dependence and Sourcing Structure
- 5.10 Contract Manufacturing and Outsourcing
- 5.11 Regional Supply and Demand Concentration
Chapter 6 Global Central Nervous System Drugs Market Pricing Analysis
- 6.1 Pricing Structure and Measurement
- 6.2 Historical Pricing Trends, 2018-2025
- 6.3 Pricing Outlook, 2025-2035
- 6.4 Average Selling Price and Unit Economics
- 6.5 Pricing by Product and Market Segment
- 6.6 Geographic Pricing Differences
- 6.7 Key Input, Energy, Labor and Logistics Costs
- 6.8 Contract Pricing and Purchasing Models
- 6.9 Pricing Sensitivity and Competitive Positioning
- 6.10 Price, Margin and Profitability Implications
Chapter 7 Global Central Nervous System Drugs Market Dynamics
- 7.1 Market Growth Drivers
- 7.1.1 Demand-Side Drivers
- 7.1.2 Technology and Innovation Drivers
- 7.1.3 Infrastructure and Investment Drivers
- 7.1.4 Regulatory and Policy Drivers
- 7.2 Market Restraints
- 7.2.1 Cost and Affordability Constraints
- 7.2.2 Technology and Adoption Barriers
- 7.2.3 Supply Chain and Operational Constraints
- 7.3 Market Challenges
- 7.3.1 Competitive Pressure and Margin Erosion
- 7.3.2 Skills, Infrastructure and Implementation Gaps
- 7.4 Emerging Market Opportunities
- 7.5 Market Dynamics Impact and Time-Horizon Assessment
Chapter 8 Global Central Nervous System Drugs Value Chain Analysis
- 8.1 Industry Value Chain Overview
- 8.2 Upstream Suppliers and Critical Inputs
- 8.3 Technology and Component Providers
- 8.4 Manufacturing or Service Delivery
- 8.5 Distribution, Channel Partners and Integrators
- 8.6 Downstream Applications and End Users
- 8.7 Value Addition and Profit Pools
- 8.8 Vertical Integration and Outsourcing
- 8.9 Supplier Concentration and Risk
- 8.10 Supply Chain Localization and Resilience
Chapter 9 Global Central Nervous System Drugs Market Regulations and Policies
- 9.1 Relevant Laws, Standards and Compliance Frameworks
- 9.2 Product, Service, Safety and Quality Requirements
- 9.3 Government Policies, Incentives and Subsidies
- 9.4 Imports, Exports and Trade Barriers
- 9.5 Public Procurement and Local Content Requirements
- 9.6 Environmental and Sustainability Compliance
- 9.7 Upcoming Policy Changes and Market Implications
Chapter 10 Global Central Nervous System Drugs Market Hotspots and Opportunities
- 10.1 Market Opportunity Mapping and Growth Hotspots
- 10.2 High-Growth Applications and Customer Groups
- 10.3 Underserved Markets and White-Space Opportunities
- 10.4 Emerging Technology and Product Opportunities
- 10.5 New Capacity and Investment Hotspots
- 10.6 Market Entry and Expansion Opportunities
- 10.7 Distribution and Partnership Opportunities
- 10.8 Near-Term and Long-Term Commercial Potential
- 10.9 Opportunity Attractiveness and Execution Risks
Chapter 11 Global Central Nervous System Drugs Market Outlook, 2025-2035
- 11.1 Market Size and Analysis
- 11.1.1 Revenue (Market Measurement: 2025: USD 123.08 billion → 2035: USD 231.76 billion)
- 11.1.2 Market Volume and Quantity Sold
- 11.1.3 Historical Market Size, 2018-2025
- 11.1.4 Base-Year Market Size, 2025
- 11.2 Market Forecast, 2025-2035
- 11.2.1 Revenue Forecast to 2035
- 11.2.2 Volume Forecast to 2035
- 11.2.3 CAGR and Year-on-Year Growth
- 11.2.4 Incremental Revenue Opportunity
- 11.3 Forecast Assumptions and Scenario Analysis
- 11.3.1 Base-Case Forecast
- 11.3.2 Optimistic and Conservative Scenarios
- 11.3.3 Technology, Pricing and Policy Sensitivities
- 11.4 Market Attractiveness and Growth Outlook
Chapter 12 Global Central Nervous System Drugs Market Segmentation and Outlook
- 12.1 Segmentation Summary and Market Shares, 2025
- 12.2 Largest and Fastest-Growing Segments
- 12.3 By Drug Class - Market Size and Forecast, 2025-2035
- 12.3.1 Segment Definition and Scope
- 12.3.2 Historical Market Size, 2018-2025
- 12.3.3 Revenue Forecast, 2025-2035
- 12.3.4 Volume Forecast, 2025-2035
- 12.3.5 Base-Year Market Share, 2025
- 12.3.6 Segment CAGR and Growth Drivers
- 12.3.7 Subsegment Market Size and Forecast
- 12.3.7.1 CNS Depressants
- 12.3.7.2 CNS Stimulants
- 12.3.8 Subsegment Pricing and Adoption Trends
- 12.3.9 Leading Suppliers and Competition
- 12.3.10 Regional Demand and Opportunities
- 12.4 By Indication - Market Size and Forecast, 2025-2035
- 12.4.1 Segment Definition and Scope
- 12.4.2 Historical Market Size, 2018-2025
- 12.4.3 Revenue Forecast, 2025-2035
- 12.4.4 Volume Forecast, 2025-2035
- 12.4.5 Base-Year Market Share, 2025
- 12.4.6 Segment CAGR and Growth Drivers
- 12.4.7 Subsegment Market Size and Forecast
- 12.4.7.1 Neurological Conditions
- 12.4.7.2 Psychiatric Conditions
- 12.4.8 Subsegment Pricing and Adoption Trends
- 12.4.9 Leading Suppliers and Competition
- 12.4.10 Regional Demand and Opportunities
- 12.5 By Route of Administration - Market Size and Forecast, 2025-2035
- 12.5.1 Segment Definition and Scope
- 12.5.2 Historical Market Size, 2018-2025
- 12.5.3 Revenue Forecast, 2025-2035
- 12.5.4 Volume Forecast, 2025-2035
- 12.5.5 Base-Year Market Share, 2025
- 12.5.6 Segment CAGR and Growth Drivers
- 12.5.7 Subsegment Market Size and Forecast
- 12.5.7.1 Oral
- 12.5.7.2 Injectable
- 12.5.7.3 Patches
- 12.5.8 Subsegment Pricing and Adoption Trends
- 12.5.9 Leading Suppliers and Competition
- 12.5.10 Regional Demand and Opportunities
- 12.6 Segment Growth Comparison
- 12.7 Segment Attractiveness and Priority Matrix
Chapter 13 Global Central Nervous System Drugs Geographic Market Outlook, 2025-2035
- 13.1 Regional Market Size and Share, 2025
- 13.2 Regional Market Forecast, 2025-2035
- 13.3 Regional Pricing, Production and Demand Differences
- 13.4 North America
- 13.4.1 United States
- 13.4.2 Canada
- 13.4.3 Mexico
- 13.5 Europe
- 13.5.1 Germany
- 13.5.2 France
- 13.5.3 Italy
- 13.5.4 United Kingdom
- 13.5.5 Spain
- 13.5.6 Poland
- 13.5.7 Russia
- 13.5.8 Netherlands
- 13.5.9 Belgium
- 13.5.10 Sweden
- 13.5.11 Denmark
- 13.5.12 Norway
- 13.5.13 Rest of Europe
- 13.6 Asia Pacific
- 13.6.1 China
- 13.6.2 India
- 13.6.3 Japan
- 13.6.4 South Korea
- 13.6.5 Thailand
- 13.6.6 Indonesia
- 13.6.7 Vietnam
- 13.6.8 Malaysia
- 13.6.9 Australia
- 13.6.10 Rest of Asia Pacific
- 13.7 Latin America
- 13.7.1 Brazil
- 13.7.2 Argentina
- 13.7.3 Colombia
- 13.7.4 Chile
- 13.7.5 Rest of Latin America
- 13.8 Middle East
- 13.8.1 Saudi Arabia
- 13.8.2 United Arab Emirates
- 13.8.3 Turkey
- 13.8.4 Israel
- 13.8.5 Iran
- 13.8.6 Rest of the Middle East
- 13.9 Africa
- 13.9.1 South Africa
- 13.9.2 Egypt
- 13.9.3 Nigeria
- 13.9.4 Morocco
- 13.9.5 Rest of Africa
- 13.10 Regional Investment, Policy and Supply Chain Differences
- 13.11 Regional Competitive Landscape
- 13.12 Geographic Growth Hotspots
Chapter 14 Global Central Nervous System Drugs Technology, Innovation and Sustainability Outlook
- 14.1 Technology Landscape and Maturity
- 14.2 Product, Process and Service Innovation
- 14.3 AI, Automation and Digital Tools in the Industry
- 14.4 Technology Adoption and Performance Benchmarking
- 14.5 Innovation Pipeline and R&D Investment
- 14.6 Patent and Intellectual Property Trends
- 14.7 Energy Efficiency and Resource Management
- 14.8 Sustainability, Recycling and Circularity
- 14.9 Technology Roadmap, 2025-2035
- 14.10 Risks of Obsolescence and Technology Substitution
Chapter 15 Global Central Nervous System Drugs Market Key Strategic Imperatives
- 15.1 Growth and Market Entry Priorities
- 15.2 High-Return Products and Segments
- 15.3 Pricing, Profitability and Cost Optimization
- 15.4 Technology Investment and Product Differentiation
- 15.5 Supply Chain Localization and Resilience
- 15.6 Distribution and Customer Acquisition
- 15.7 Partnership, Acquisition and Capacity Strategy
- 15.8 Regional Expansion Priorities
- 15.9 Short-, Medium- and Long-Term Actions
Chapter 16 Competition Outlook
- 16.1 Industry Competition Characteristics
- 16.2 Market Structure and Concentration
- 16.3 Market Share and Competitive Positioning, 2025
- 16.4 Company-Wise Revenue and Product Benchmarking
- 16.5 Production and Service Capacity Benchmarking
- 16.6 Technology, Pricing and Differentiation
- 16.7 Regional Footprint and Distribution Strength
- 16.8 Mergers, Acquisitions and Strategic Alliances
- 16.9 New Entrants and Competitive Threats
- 16.10 Porter's Five Forces and Industry Attractiveness
- 16.11 Competitive Outlook, 2025-2035
Chapter 17 Company Profiles
- 17.1 Company Coverage and Selection Criteria
- 17.2 AbbVie Inc.
- 17.2.1 Business Description
- 17.2.2 Company Ownership and Geographic Presence
- 17.2.3 Product and Service Portfolio
- 17.2.4 Manufacturing and Operating Footprint
- 17.2.5 Production Capacity and Expansion Plans
- 17.2.6 Financial Performance and Investment
- 17.2.7 Market Share and Competitive Position
- 17.2.8 Technology and Innovation Capabilities
- 17.2.9 Strategic Alliances or Partnerships
- 17.2.10 Recent Developments
- 17.2.11 Growth Strategy and Outlook
- 17.3 Novartis AG
- 17.4 Otsuka Holdings Co. Ltd.
- 17.5 Pfizer Inc.
- 17.6 Jazz Pharmaceuticals Plc
- 17.7 Amneal Pharmaceuticals Inc.
- 17.8 Par Health
- 17.9 Knoa Pharma (Rhodes Pharmaceuticals)
- 17.10 Lannett Co Inc.
- 17.11 Azurity Pharmaceuticals Inc.
- 17.12 Aytu BioPharma Inc.
- 17.13 Noven Pharmaceuticals Inc.
- 17.14 Other Relevant Market Participants
Note: Every listed company is profiled on the structure shown under the first company. The company list is preliminary and may change based on research findings, market developments, data availability and client requirements.
Chapter 18 Disclaimer
- 18.1 Research and Forecast Disclaimer
- 18.2 Data Source and Estimation Limitations
Note: The depth of individual sections depends on data availability for this market. Volume, capacity, trade and other unit-based metrics are included where applicable.