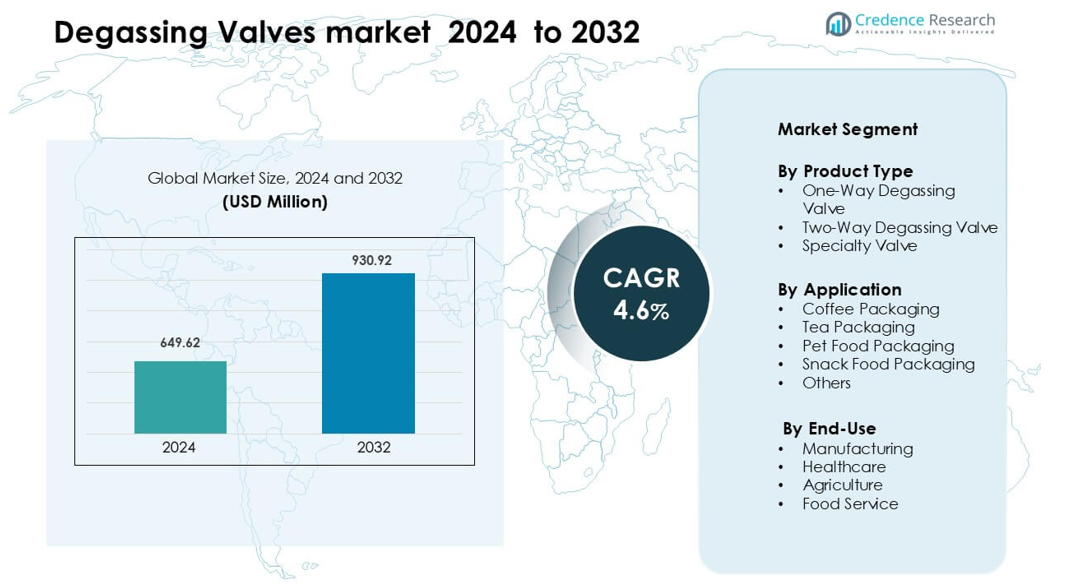
Home » Advanced Materials » Degassing Valves Market

Degassing Valves Market By Type (Filter Integrated Valves, Non-Filter Integrated Valves) By Application (Coffee, Dairy, Pet Food, Fermented Food)-Growth, Future Prospects & Competitive Analysis, 2016 – 2030

Price: $4999

Published: | Report ID: 18033 | Report Format : PDF

Key Highlights of the Report

The global degassing valves market is segmented by type, application, and region. Filter-integrated degassing valves are the most popular. Coffee is the most commonly used application, with North America leading the market growth.

The global degassing valves market has several drivers, including manufacturers that use them to preserve food quality and other commodities when they incorporate packaging bags and pouches. Additionally, it assists them in streamlining the entire process of product storage, shipping, and distribution, notably for coffee items. Due to its many benefits, one-way degassing valves are already actively used in small-scale food enterprises. However, degasser installation comes with high upfront expenditures, which could be problematic for small and medium-sized businesses.

Nonetheless, the global degassing valve market offers significant growth opportunities, including greater growth opportunities for Indian degassing valve producers due to the increased number of coffee drinkers. There is a growing need for degassing valves due to rising coffee retail sales in the nation. However, market players in India are primarily focused on deploying degassing valves for packaging dairy goods.

Market Overview

The global degassing valves market has witnessed steady growth in recent years and is expected to continue growing at a CAGR of 5.20% between 2023 and 2030. The market was valued at USD 0.15 billion in 2022 and is expected to reach USD 0.21 billion in 2030.

Design Element 2

Access crucial information at unmatched prices!

Request your free sample report today & start making informed decisions powered by Credence Research!

Download Free Sample
CTA Design Element 3

What Are the Main Drivers of The Global Degassing Valves Market?

The global degassing valves market is driven by several factors, including degassing valves are used by manufacturers to preserve the quality of food and other commodities when they incorporate packaging bags and pouches. Additionally, it assists them in streamlining the entire process of product storage, shipping, and distribution, notably for coffee items. Due to its many benefits, one-way degassing valves are already actively used in small-scale food enterprises.

What Are the Major Challenges Faced by The Global Degassing Valves Market?

The global degassing valves market also faces several challenges, including Degasser installation comes with high upfront expenditures, which could be problematic for small and medium-sized businesses.

What Are the Growth Opportunities in The Global Degassing Valves Market?

The global degassing valves market offers significant growth opportunities, including manufacturers using them to preserve food quality and other commodities when they incorporate packaging bags and pouches. Additionally, it assists them in streamlining the entire process of product storage, shipping, and distribution, notably for coffee items. Due to its many benefits, one-way degassing valves are already actively used in small-scale food enterprises.

Executive Summary

Overview of the Global Degassing Valves Market

The global demand for degassing valves was valued at USD 025 Billion in 2022 and is expected to reach USD 0.21 Billion in 2030, growing at a CAGR of 5.20% between 2023 and 2030. The market expansion is related to the rising global demand for dry powder chemicals, cheese, pet food, fertilizers, coffee, and grass seeds. The increased awareness of food safety and cleanliness also drives the need for one-way degassing valves in diverse applications. Due to its characteristics, including corrosion resistance and durability, the polyethylene (PE) check valve segment is anticipated to experience the quickest growth during the projection period. Due to growing demand from end users such as pet food producers and coffee roasters in this region, North America currently has a dominant position in the worldwide one-way degassing valve market.

Market Definition

Manufacturers use degassing valves to preserve the quality of food and other commodities when they incorporate packaging bags and pouches. Additionally, it assists them in streamlining the entire process of product storage, shipping, and distribution, notably for coffee items. Due to its many benefits, one-way degassing valves are already actively used in small-scale food enterprises. Coffee and other high-end food packaging bags and pouches frequently use one-way degassing valves as their degassing methods. The sale of degassing valve bags and pouches for residential usage has also expanded due to their accessibility through supermarkets and neighborhood shops.

Market Insights

  • The global demand for degassing valves was valued at USD 025 Billion in 2022 and is expected to reach USD 0.21 Billion in 2030, growing at a CAGR of 5.20% between 2023 and 2030.
  • Filter-integrated valves are the leading segment by type and held over 43% share in terms of value in 2022 and are likely to exhibit the fastest CAGR during the forecast period.
  • The coffee segment governs the demand for degassing valves globally, holding a massive share of over 80% in 2020, and is expected to grow at a rapid CAGR.
  • North America is fueling the growth of the degassing valves industry with over 30% share in 2022, while Asia Pacific and Europe collectively account for just under 50% share in 2022. Europe held over 22% share in 2022.
  • Rising coffee sales and consumption in North America provide manufacturers with excellent commercial opportunities. Degassing valves are being increasingly adopted for other packaged foods and beverages, which might help the market grow.
  • In the following ten years, the market for degassing valves in the US is expected to increase by 1.25 times its current value.

Segmentation by Material

  • Filter-integrated valves are the leading segment by type and held over 43% share in value in 2022 and are likely to exhibit the fastest CAGR during the forecast period.
  • Non-filter integrated valves is the fastest growing category in the degassing valves market over the forecast period.

Segmentation by Application

  • The coffee segment governs the demand for degassing valves globally, holding a massive share of over 80% in 2022, and is also expected to grow at a rapid CAGR.
  • The dairy is the fastest growing category in the degassing valves market over the forecast period.

Segmentation by Region

  • North America is fueling the growth of the degassing valves industry with over 30% share in 2022.
  • Asia Pacific and Europe collectively account for just under 50% share in 2022, with Europe holding over 22% share in the same year.
  • The rest of the World, including Latin America, The Middle East, and Africa, contributes the remainder to the demand for degassing valves.

The increasing demand for degassing valves can be attributed to the rising demand from end-use sectors like food and beverage, medicines, chemicals, and others, and the region is predicted to experience moderate growth. Due to their superior performance qualities, these valves are increasingly used in packaging applications, which is anticipated to fuel industry expansion over the forecast period.

The United States is one of the largest markets for degassing valves in North America, with a significant share of the market. Due to rising demand from end-use sectors like food and beverage, medicines, chemicals, and others, the region is predicted to experience moderate growth. Due to their superior performance qualities, these valves are increasingly used in packaging applications, which is anticipated to fuel industry expansion over the forecast period.

China is also a major market for degassing valves in the Asia Pacific region, with a significant market share. Thanks to its large labor force for small-scale enterprises, China is the leader in producing degassing valves in the Asia Pacific region. China’s degassing valve production capacity is steadily developing due to the government’s focus on raising its export share in packaging products. China is predicted to follow 6.95 during the projection period, providing a profitable potential for its degassing valve manufacturers. The market in China is anticipated to acquire traction and surpass established Western markets because of a larger consumer base.

Overall, the increasing demand for degassing valves can be attributed to rising coffee sales and consumption are providing manufacturers with excellent commercial opportunities. Degassing valves are being increasingly adopted for other packaged foods and beverages, which might help the market grow. In the following ten years, the market for degassing valves in the US is expected to increase by 1.25 times its current value.

Degassing Valves Market

The Growing Popularity of Flexible Packaging Solutions is boosting sales.

In the upcoming years, switching from rigid to flexible packaging will increase demand for degassing valves. Portion control, a longer product shelf life, and convenience are advantages of flexible packaging with one-way degassing valves. Additionally, flexible packaging solutions provide larger profit margins by lowering the cost of production, packing, and shipping.

It is anticipated that roughly 50% of the global market for degassing valves will be sold in North America and Europe. This market domination is understandable because of the rise in coffee consumption in the US, Canada, and UK. The consumption of coffee beverages is also steadily rising in South and East Asia, a current trend.

Considering Many New End Uses, Demand for Degassing Valves for Coffee Packaging Will Continue to Rise.

It is required to put processed coffee in a bag with a degassing valve because it periodically releases air and carbon dioxide. In order to regulate the temperature and moisture inside the commercial bags, the valve on coffee bags has also recently undergone a new design. Therefore, over the next ten years, it is anticipated that sales of degassing valves for coffee packaging alone will present an additional opportunity of US$ 65 million.

Degassing valves are currently being utilized more frequently in the commercial packaging of several goods that emit CO2 or other gases. The use of degassing valves in the commercial packaging dairy products is incredible. The dairy industry is predicted to overtake all others as the world’s second-largest end user of goods.

These days, there is a greater trend towards the use of bags and pouches with one-way degassing valves for dry powder chemicals. The market supply chain is expected to become even more diversified over the forecasted years, thanks in large part to the contribution of this segment.

Less Awareness Among the Population and its High Installation Cost

Degasser installation comes with high upfront expenditures, which could be problematic for small and medium-sized businesses. In some industries, a lack of knowledge about the advantages of degassers could restrain market expansion. In some applications, the demand for degassers may be impacted by the availability of substitute gas removal techniques such as membrane separation. Macroeconomic concerns and volatility in the price of raw materials may impact market expansion and investment choices.

Greater Growth Opportunities for Indian Degassing Valves Producers Due to Increase in Coffee Drinkers

Conveniently, customers in India have long had a preference for tea. However, young people in India increasingly choose coffee as a beverage alternative. There is a growing need for degassing valves due to rising coffee retail sales in the nation. However, market players in India are primarily focused on deploying degassing valves for packaging dairy goods.

Additionally, it has been noted that both urban and rural areas of India are witnessing a promising increase in the market for packaged coffee. The demand for degassing valves is anticipated to increase due to all these market-enabling aspects.

Competitive Landscape

Key Players

The global degassing valves market is highly competitive, with the presence of several key players. Some of the major players in the market and their market share are as follows:

  • “CCL Industries
  • Syntegon Technology GmbH
  • FLAIR Flexible Packaging Corporation
  • Goglio
  • Amcor
  • Plitek Valves
  • TricorBraun Flex
  • Wipf Holding
  • Tungyi Hardware
  • Fres-co System
  • UrthPact”

These companies focus on product innovation, expanding their distribution channels, and mergers and acquisitions to stay ahead in the market. The major players in the global degassing valves market constantly strive to stay ahead by introducing new products and innovations.

Shape Your Report to Specific Countries or Regions & Enjoy 30% Off!

Summary of Key Findings

  • Suppliers’ increasing demand for effective and cost-effective resource packaging solutions drives market growth.
  • Market segmented by type, application, and region.
  • Filter-integrated degassing valves are the most popular segment.
  • Coffee is most commonly used for application.
  • North America is leading market growth; the market is highly competitive with key players including CCL Industries, Syntegon Technology GmbH, FLAIR Flexible Packaging Corporation, Goglio, Amcor, Plitek Valves, TricorBraun Flex, Wipf Holding, Tungyi Hardware, Fres-co System, and UrthPact.

Future Outlook

  • Positive outlook for the global degassing valve markets with significant growth potential in the North American region and greater growth opportunities for Indian degassing valve producers due to increased coffee drinkers.
  • There is a growing need for degassing valves due to rising coffee retail sales in the nation. However, market players in India are primarily focused on deploying degassing valves for packaging dairy goods.to drive growth
  • Challenges include the degasser installation comes with high upfront expenditures, which could be problematic for small and medium-sized businesses.
  • Key players to focus on product innovation, expanding market reach and maintaining competitive pricing to stay ahead.

Segmentation

  • By Type
    • Filter Integrated Valves
    • Non-Filter Integrated Valves
  • By Application
    • Coffee
    • Dairy
    • Pet Food
    • Fermented Food
  • By Region
  • North America
    • The US.
    • Canada
    • Mexico
  • Europe
    • Germany
    • France
    • The U.K.
    • Italy
    • Spain
    • Rest of Europe
  • Asia Pacific
    • China
    • Japan
    • India
    • South Korea
    • South-east Asia
    • Rest of Asia Pacific
  • Latin America
    • Brazil
    • Argentina
    • Rest of Latin America
  • Middle East & Africa
    • GCC Countries
    • South Africa
    • Rest of the Middle East and Africa

1. Preface
1.1. Report Description
1.1.1. Purpose of the Report
1.1.2. Target Audience
1.1.3. USP and Key Offerings
1.2. Research Scope
1.3. Research Methodology
1.3.1. Phase I – Secondary Research
1.3.2. Phase II – Data Modelling
1.3.2.1. Company Share Analysis Model
1.3.2.2. Revenue Based Modelling
1.3.3. Phase III – Primary Research
1.3.4. Research Limitations
1.3.5. Assumptions
1.4. Market Introduction
1.5. Market Research Scope

2. Executive Summary
2.1. Market Snapshot: Global Degassing Valves Market
2.2. Global Degassing Valves Market, By Type
2.3. Global Degassing Valves Market, By Application
2.4. Global Degassing Valves Market, By Region

3. Market Dynamics & Factors Analysis
3.1. Introduction
3.1.1. Global Degassing Valves Market Value, 2017-2030, (US$ Bn)
3.1.2. Y-o-Y Growth Trend Analysis
3.2. Market Dynamics
3.2.1. Market Drivers
3.2.1.1. Driver 1
3.2.1.2. Driver 2
3.2.1.3. Driver 3
3.2.2. Market Restraints
3.2.2.1. Restraint 1
3.2.2.2. Restraint 2
3.2.3. Market Opportunities
3.2.3.1. Opportunity 1
3.2.3.2. Opportunity 2
3.2.4. Major Industry Challenges
3.2.4.1. Challenge 1
3.2.4.2. Challenge 2
3.3. Growth and Development Patterns
3.4. Investment Feasibility Analysis
3.5. Market Opportunity Analysis
3.5.1. Type
3.5.2. Application
3.5.3. Geography

4. Premium Insights
4.1. STAR (Situation, Task, Action, Results) Analysis
4.2. Porter’s Five Forces Analysis
4.2.1. Threat of New Entrants
4.2.2. Bargaining Power of Buyers/Consumers
4.2.3. Bargaining Power of Suppliers
4.2.4. Threat of Substitute Types
4.2.5. Intensity of Competitive Rivalry
4.3. Key Market Trends
4.3.1. Demand Side Trends
4.3.2. Supply Side Trends
4.4. Value Chain Analysis
4.5. Type Analysis
4.6. Analysis and Recommendations
4.7. Marketing Strategy Analysis
4.7.1. Direct Marketing
4.7.2. Indirect Marketing
4.7.3. Marketing Channel Development Trend

5. Market Positioning of Key Players, 2022
5.1. Company market share of key players, 2022
5.2. Competitive Benchmarking
5.3. Market Positioning of Key Vendors
5.4. Geographical Presence Analysis
5.5. Major Strategies Adopted by Key Players
5.5.1. Key Strategies Analysis
5.5.2. Mergers and Acquisitions
5.5.3. Partnerships
5.5.4. Product Launch
5.5.5. Geographical Expansion
5.5.6. Others

6. Economic Impact Analysis
6.1. Recession Impact
6.1.1. North America
6.1.2. Europe
6.1.3. Asia Pacific
6.1.4. Latin America
6.1.5. Middle East and Africa
6.2. Ukraine-Russia War Impact
6.2.1. North America
6.2.2. Europe
6.2.3. Asia Pacific
6.2.4. Latin America
6.2.5. Middle East and Africa
6.3. COVID-19 Impact Analysis
6.3.1. North America
6.3.2. Europe
6.3.3. Asia Pacific
6.3.4. Latin America
6.3.5. Middle East and Africa

7. Global Degassing Valves Market, By Type
7.1. Global Degassing Valves Market Overview, by Type
7.1.1. Global Degassing Valves Market Revenue Share, By Type, 2022 Vs 2030 (in %)
7.2. Filter Integrated Valves
7.2.1. Global Degassing Valves Market, By Region, 2017-2030 (US$ Bn)
7.3. Non-Filter Integrated Valves
7.3.1. Global Degassing Valves Market, By Region, 2017-2030 (US$ Bn)

8. Global Degassing Valves Market, By Application
8.1. Global Degassing Valves Market Overview, by Application
8.1.1. Global Degassing Valves Market, By Application, 2022 vs 2030 (in %)
8.2. Coffee
8.2.1. Global Degassing Valves Market, By Region, 2017-2030 (US$ Bn)
8.3. Dairy
8.3.1. Global Degassing Valves Market, By Region, 2017-2030 (US$ Bn)
8.4. Pet Food
8.4.1. Global Degassing Valves Market, By Region, 2017-2030 (US$ Bn)
8.5. Fermented Food
8.5.1. Global Degassing Valves Market, By Region, 2017-2030 (US$ Bn)

9. Global Degassing Valves Market, By Region
9.1. Global Degassing Valves Market Overview, by Region
9.1.1. Global Degassing Valves Market, By Region, 2022 vs 2030 (in%)
9.2. Type
9.2.1. Global Degassing Valves Market, By Type, 2017-2030 (US$ Bn)
9.3. Application
9.3.1. Global Degassing Valves Market, By Application, 2017-2030 (US$ Bn)

10. North America Degassing Valves Market Analysis
10.1. North America Degassing Valves Market, by Type, 2017-2030(US$ Bn)
10.1.1. Overview
10.1.2. SRC Analysis
10.2. North America Degassing Valves Market, by Application, 2017-2030(US$ Bn)
10.2.1. Overview
10.2.2. SRC Analysis
10.3. North America Degassing Valves Market, by Country, 2017-2030 (US$ Bn)
10.3.1. North America Degassing Valves Market, by Country, 2022 Vs 2030 (in%)
10.3.2. U.S.
10.3.2.1. U.S. Degassing Valves Market Estimates and Forecast, 2017-2030 (US$ Bn)
10.3.2.2. U.S. Degassing Valves, By Type, 2017-2030 (US$ Bn)
10.3.2.3. U.S. Degassing Valves, By Application, 2017-2030 (US$ Bn)
10.3.3. Canada
10.3.3.1. Canada Degassing Valves Market Estimates and Forecast, 2017-2030 (US$ Bn)
10.3.3.2. Canada Degassing Valves, By Type, 2017-2030 (US$ Bn)
10.3.3.3. Canada Degassing Valves, By Application, 2017-2030 (US$ Bn)
10.3.4. Mexico
10.3.4.1. Mexico Degassing Valves Market Estimates and Forecast, 2017-2030 (US$ Bn)
10.3.4.2. Mexico Degassing Valves, By Type, 2017-2030 (US$ Bn)
10.3.4.3. Mexico Degassing Valves, By Application, 2017-2030 (US$ Bn)

11. Europe Degassing Valves Market Analysis
11.1. Europe Degassing Valves Market, by Type, 2017-2030(US$ Bn)
11.1.1. Overview
11.1.2. SRC Analysis
11.2. Europe Degassing Valves Market, by Application, 2017-2030(US$ Bn)
11.2.1. Overview
11.2.2. SRC Analysis
11.3. Europe Degassing Valves Market, by Country, 2017-2030 (US$ Bn)
11.3.1. Europe Degassing Valves Market, by Country, 2022 Vs 2030 (in%)
11.3.2. Germany
11.3.2.1. Germany Degassing Valves Market Estimates and Forecast, 2017-2030 (US$ Bn)
11.3.2.2. Germany Degassing Valves, By Type, 2017-2030 (US$ Bn)
11.3.2.3. Germany Degassing Valves, By Application, 2017-2030 (US$ Bn)
11.3.3. France
11.3.3.1. France Degassing Valves Market Estimates and Forecast, 2017-2030 (US$ Bn)
11.3.3.2. France Degassing Valves, By Type, 2017-2030 (US$ Bn)
11.3.3.3. France Degassing Valves, By Application, 2017-2030 (US$ Bn)
11.3.4. UK
11.3.4.1. UK Degassing Valves Market Estimates and Forecast, 2017-2030 (US$ Bn)
11.3.4.2. UK Degassing Valves, By Type, 2017-2030 (US$ Bn)
11.3.4.3. UK Degassing Valves, By Application, 2017-2030 (US$ Bn)
11.3.5. Italy
11.3.5.1. Italy Degassing Valves Market Estimates and Forecast, 2017-2030 (US$ Bn)
11.3.5.2. Italy Degassing Valves, By Type, 2017-2030 (US$ Bn)
11.3.5.3. Italy Degassing Valves, By Application, 2017-2030 (US$ Bn)
11.3.6. Spain
11.3.6.1. Spain Degassing Valves Market Estimates and Forecast, 2017-2030 (US$ Bn)
11.3.6.2. Spain Degassing Valves, By Type, 2017-2030 (US$ Bn)
11.3.6.3. Spain Degassing Valves, By Application, 2017-2030 (US$ Bn)
11.3.7. Rest of Europe
11.3.7.1. Rest of Europe Degassing Valves Market Estimates and Forecast, 2017-2030 (US$ Bn)
11.3.7.2. Rest of Europe Degassing Valves, By Type, 2017-2030 (US$ Bn)
11.3.7.3. Rest of Europe Degassing Valves, By Application, 2017-2030 (US$ Bn)

12. Asia Pacific Degassing Valves Market Analysis
12.1. Asia Pacific Degassing Valves Market, by Type, 2017-2030(US$ Bn)
12.1.1. Overview
12.1.2. SRC Analysis
12.2. Asia Pacific Degassing Valves Market, by Application, 2017-2030(US$ Bn)
12.2.1. Overview
12.2.2. SRC Analysis
12.3. Asia Pacific Degassing Valves Market, by Country, 2017-2030 (US$ Bn)
12.3.1. Asia Pacific Degassing Valves Market, by Country, 2022 Vs 2030 (in%)
12.3.2. China
12.3.2.1. China Degassing Valves Market Estimates and Forecast, 2017-2030 (US$ Bn)
12.3.2.2. China Degassing Valves, By Type, 2017-2030 (US$ Bn)
12.3.2.3. China Degassing Valves, By Application, 2017-2030 (US$ Bn)
12.3.3. Japan
12.3.3.1. Japan Degassing Valves Market Estimates and Forecast, 2017-2030 (US$ Bn)
12.3.3.2. Japan Degassing Valves, By Type, 2017-2030 (US$ Bn)
12.3.3.3. Japan Degassing Valves, By Application, 2017-2030 (US$ Bn)
12.3.4. India
12.3.4.1. India Degassing Valves Market Estimates and Forecast, 2017-2030 (US$ Bn)
12.3.4.2. India Degassing Valves, By Type, 2017-2030 (US$ Bn)
12.3.4.3. India Degassing Valves, By Application, 2017-2030 (US$ Bn)
12.3.5. South Korea
12.3.5.1. South Korea Degassing Valves Market Estimates and Forecast, 2017-2030 (US$ Bn)
12.3.5.2. South Korea Degassing Valves, By Type, 2017-2030 (US$ Bn)
12.3.5.3. South Korea Degassing Valves, By Application, 2017-2030 (US$ Bn)
12.3.6. South-East Asia
12.3.6.1. South-East Asia Degassing Valves Market Estimates and Forecast, 2017-2030 (US$ Bn)
12.3.6.2. South-East Asia Degassing Valves, By Type, 2017-2030 (US$ Bn)
12.3.6.3. South-East Asia Degassing Valves, By Application, 2017-2030 (US$ Bn)
12.3.7. Rest of Asia Pacific
12.3.7.1. Rest of Asia Pacific Degassing Valves Market Estimates and Forecast, 2017-2030 (US$ Bn)
12.3.7.2. Rest of Asia Pacific Degassing Valves, By Type, 2017-2030 (US$ Bn)
12.3.7.3. Rest of Asia Pacific Degassing Valves, By Application, 2017-2030 (US$ Bn)

13. Latin America Degassing Valves Market Analysis
13.1. Latin America Degassing Valves Market, by Type, 2017-2030(US$ Bn)
13.1.1. Overview
13.1.2. SRC Analysis
13.2. Latin America Degassing Valves Market, by Application, 2017-2030(US$ Bn)
13.2.1. Overview
13.2.2. SRC Analysis
13.3. Latin America Degassing Valves Market, by Country, 2017-2030 (US$ Bn)
13.3.1. Latin America Degassing Valves Market, by Country, 2022 Vs 2030 (in%)
13.3.2. Brazil
13.3.2.1. Brazil Degassing Valves Market Estimates and Forecast, 2017-2030 (US$ Bn)
13.3.2.2. Brazil Degassing Valves, By Type, 2017-2030 (US$ Bn)
13.3.2.3. Brazil Degassing Valves, By Application, 2017-2030 (US$ Bn)
13.3.3. Argentina
13.3.3.1. Argentina Degassing Valves Market Estimates and Forecast, 2017-2030 (US$ Bn)
13.3.3.2. Argentina Degassing Valves, By Type, 2017-2030 (US$ Bn)
13.3.3.3. Argentina Degassing Valves, By Application, 2017-2030 (US$ Bn)
13.3.4. Rest of Latin America
13.3.4.1. Rest of Latin America Degassing Valves Market Estimates and Forecast, 2017-2030 (US$ Bn)
13.3.4.2. Rest of Latin America Degassing Valves, By Type, 2017-2030 (US$ Bn)
13.3.4.3. Rest of Latin America Degassing Valves, By Application, 2017-2030 (US$ Bn)

14. Middle East and Africa Degassing Valves Market Analysis
14.1. Middle East and Africa Degassing Valves Market, by Type, 2017-2030(US$ Bn)
14.1.1. Overview
14.1.2. SRC Analysis
14.2. Middle East and Africa Degassing Valves Market, by Application, 2017-2030(US$ Bn)
14.2.1. Overview
14.2.2. SRC Analysis
14.3. Middle East and Africa Degassing Valves Market, by Country, 2017-2030 (US$ Bn)
14.3.1. Middle East and Africa Degassing Valves Market, by Country, 2022 Vs 2030 (in%)
14.3.2. GCC Countries
14.3.2.1. GCC Countries Degassing Valves Market Estimates and Forecast, 2017-2030 (US$ Bn)
14.3.2.2. GCC Countries Degassing Valves, By Type, 2017-2030 (US$ Bn)
14.3.2.3. GCC Countries Degassing Valves, By Application, 2017-2030 (US$ Bn)
14.3.3. South Africa
14.3.3.1. South Africa Degassing Valves Market Estimates and Forecast, 2017-2030 (US$ Bn)
14.3.3.2. South Africa Degassing Valves, By Type, 2017-2030 (US$ Bn)
14.3.3.3. South Africa Degassing Valves, By Application, 2017-2030 (US$ Bn)
14.3.4. Rest of Middle East and Africa
14.3.4.1. Rest of Middle East and Africa Degassing Valves Market Estimates and Forecast, 2017-2030 (US$ Bn)
14.3.4.2. Rest of Middle East and Africa Degassing Valves, By Type, 2017-2030 (US$ Bn)
14.3.4.3. Rest of Middle East and Africa Degassing Valves, By Application, 2017-2030 (US$ Bn)

15. Company Profiles
15.1. CCL Industries
15.1.1. Company Overview
15.1.2. Products/Services Portfolio
15.1.3. Geographical Presence
15.1.4. Financial Summary
15.1.4.1. Market Revenue and Net Profit (2019-2022)
15.1.4.2. Business Segment Revenue Analysis
15.1.4.3. Geographical Revenue Analysis
15.2. Syntegon Technology GmbH
15.3. FLAIR Flexible Packaging Corporation
15.4. Goglio
15.5. Amcor
15.6. Plitek Valves
15.7. TricorBraun Flex
15.8. Wipf Holding
15.9. Tungyi Hardware
15.10. Fres-co System
15.11. UrthPact

List of Figures
FIG. 1 Global Degassing Valves Market: Research Methodology
FIG. 2 Market Size Estimation – Top Down & Bottom up Approach
FIG. 3 Global Degassing Valves Market Segmentation
FIG. 4 Global Degassing Valves Market, by Type, 2022 (US$ Bn)
FIG. 5 Global Degassing Valves Market, by Application, 2022 (US$ Bn)
FIG. 6 Global Degassing Valves Market, by Geography, 2022 (US$ Bn)
FIG. 7 Attractive Investment Proposition, by Type, 2022
FIG. 8 Attractive Investment Proposition, by Application, 2022
FIG. 9 Attractive Investment Proposition, by Geography, 2022
FIG. 10 Global Market Share Analysis of Key Degassing Valves Market Manufacturers, 2022
FIG. 11 Global Market Positioning of Key Degassing Valves Market Manufacturers, 2022
FIG. 12 Global Degassing Valves Market Value Contribution, By Type, 2022 & 2030 (Value %)
FIG. 13 Global Degassing Valves Market, by Filter Integrated Valves, Value, 2017-2030 (US$ Bn)
FIG. 14 Global Degassing Valves Market, by Non-Filter Integrated Valves, Value, 2017-2030 (US$ Bn)
FIG. 15 Global Degassing Valves Market Value Contribution, By Application, 2022 & 2030 (Value %)
FIG. 16 Global Degassing Valves Market, by Coffee, Value, 2017-2030 (US$ Bn)
FIG. 17 Global Degassing Valves Market, by Dairy, 2017-2030 (US$ Bn)
FIG. 18 Global Degassing Valves Market, by Pet Food, 2017-2030 (US$ Bn)
FIG. 19 Global Degassing Valves Market, by Fermented Food, 2017-2030 (US$ Bn)
FIG. 20 North America Degassing Valves Market, 2017-2030 (US$ Bn)
FIG. 21 U.S. Degassing Valves Market, 2017-2030 (US$ Bn)
FIG. 22 Canada Degassing Valves Market, 2017-2030 (US$ Bn)
FIG. 23 Europe Degassing Valves Market, 2017-2030 (US$ Bn)
FIG. 24 Germany Degassing Valves Market, 2017-2030 (US$ Bn)
FIG. 25 France Degassing Valves Market, 2017-2030 (US$ Bn)
FIG. 26 U.K. Degassing Valves Market, 2017-2030 (US$ Bn)
FIG. 27 Italy Degassing Valves Market, 2017-2030 (US$ Bn)
FIG. 28 Spain Degassing Valves Market, 2017-2030 (US$ Bn)
FIG. 29 Rest of Europe Degassing Valves Market, 2017-2030 (US$ Bn)
FIG. 30 Asia Pacific Degassing Valves Market, 2017-2030 (US$ Bn)
FIG. 31 China Degassing Valves Market, 2017-2030 (US$ Bn)
FIG. 32 Japan Degassing Valves Market, 2017-2030 (US$ Bn)
FIG. 33 India Degassing Valves Market, 2017-2030 (US$ Bn)
FIG. 34 South Korea Degassing Valves Market, 2017-2030 (US$ Bn)
FIG. 35 South-East Asia Degassing Valves Market, 2017-2030 (US$ Bn)
FIG. 36 Rest of Asia Pacific Degassing Valves Market, 2017-2030 (US$ Bn)
FIG. 37 Latin America Degassing Valves Market, 2017-2030 (US$ Bn)
FIG. 38 Brazil Degassing Valves Market, 2017-2030 (US$ Bn)
FIG. 39 Mexico Degassing Valves Market, 2017-2030 (US$ Bn)
FIG. 40 Rest of Latin America Degassing Valves Market, 2017-2030 (US$ Bn)
FIG. 41 Middle East & Africa Degassing Valves Market, 2017-2030 (US$ Bn)
FIG. 42 GCC Countries Degassing Valves Market, 2017-2030 (US$ Bn)
FIG. 43 South Africa Degassing Valves Market, 2017-2030 (US$ Bn)
FIG. 44 Rest of Middle East and Africa Degassing Valves Market, 2017-2030 (US$ Bn)

List of Tables
TABLE 1 Market Snapshot: Global Degassing Valves Market
TABLE 2 Global Degassing Valves Market: Market Drivers Impact Analysis
TABLE 3 Global Degassing Valves Market: Market Restraints Impact Analysis
TABLE 4 Global Degassing Valves Market, by Competitive Benchmarking, 2022
TABLE 5 Global Degassing Valves Market, by Geographical Presence Analysis, 2022
TABLE 6 Global Degassing Valves Market, by Key Strategies Analysis, 2022
TABLE 7 Global Degassing Valves Market, by Filter Integrated Valves, By Region, 2017-2022 (US$ Bn)
TABLE 8 Global Degassing Valves Market, by Filter Integrated Valves, By Region, 2023-2030 (US$ Bn)
TABLE 9 Global Degassing Valves Market, by Non-Filter Integrated Valves, By Region, 2017-2022 (US$ Bn)
TABLE 10 Global Degassing Valves Market, by Non-Filter Integrated Valves, By Region, 2023-2030 (US$ Bn)
TABLE 11 Global Degassing Valves Market, by Coffee, By Region, 2017-2022 (US$ Bn)
TABLE 12 Global Degassing Valves Market, by Coffee, By Region, 2023-2030 (US$ Bn)
TABLE 13 Global Degassing Valves Market, by Dairy, By Region, 2017-2022 (US$ Bn)
TABLE 14 Global Degassing Valves Market, by Dairy, By Region, 2023-2030 (US$ Bn)
TABLE 15 Global Degassing Valves Market, by Pet Food, By Region, 2017-2022 (US$ Bn)
TABLE 16 Global Degassing Valves Market, by Pet Food, By Region, 2023-2030 (US$ Bn)
TABLE 17 Global Degassing Valves Market, by Fermented Food, By Region, 2017-2022 (US$ Bn)
TABLE 18 Global Degassing Valves Market, by Fermented Food, By Region, 2023-2030 (US$ Bn)
TABLE 19 Global Degassing Valves Market, by Type, 2017-2022 (US$ Bn)
TABLE 20 Global Degassing Valves Market, by Type, 2023-2030 (US$ Bn)
TABLE 21 Global Degassing Valves Market, by Application, 2017-2022 (US$ Bn)
TABLE 22 Global Degassing Valves Market, by Application, 2023-2030 (US$ Bn)
TABLE 23 Global Degassing Valves Market, by Region, 2017-2022 (US$ Bn)
TABLE 24 Global Degassing Valves Market, by Region, 2023-2030 (US$ Bn)
TABLE 25 North America Degassing Valves Market, by Type, 2017-2022 (US$ Bn)
TABLE 26 North America Degassing Valves Market, by Type, 2023-2030 (US$ Bn)
TABLE 27 North America Degassing Valves Market, by Application, 2017-2022 (US$ Bn)
TABLE 28 North America Degassing Valves Market, by Application, 2023-2030 (US$ Bn)
TABLE 29 North America Degassing Valves Market, by Country, 2017-2022 (US$ Bn)
TABLE 30 North America Degassing Valves Market, by Country, 2023-2030 (US$ Bn)
TABLE 31 United States Degassing Valves Market, by Type, 2017-2022 (US$ Bn)
TABLE 32 United States Degassing Valves Market, by Type, 2023-2030 (US$ Bn)
TABLE 33 United States Degassing Valves Market, by Application, 2017-2022 (US$ Bn)
TABLE 34 United States Degassing Valves Market, by Application, 2023-2030 (US$ Bn)
TABLE 35 Canada Degassing Valves Market, by Type, 2017-2022 (US$ Bn)
TABLE 36 Canada Degassing Valves Market, by Type, 2023-2030 (US$ Bn)
TABLE 37 Canada Degassing Valves Market, by Application, 2017-2022 (US$ Bn)
TABLE 38 Canada Degassing Valves Market, by Application, 2023-2030 (US$ Bn)
TABLE 39 Mexico Degassing Valves Market, by Type, 2017-2022 (US$ Bn)
TABLE 40 Mexico Degassing Valves Market, by Type, 2023-2030 (US$ Bn)
TABLE 41 Mexico Degassing Valves Market, by Application, 2017-2022 (US$ Bn)
TABLE 42 Mexico Degassing Valves Market, by Application, 2023-2030 (US$ Bn)
TABLE 43 Europe Degassing Valves Market, by Type, 2017-2022 (US$ Bn)
TABLE 44 Europe Degassing Valves Market, by Type, 2023-2030 (US$ Bn)
TABLE 45 Europe Degassing Valves Market, by Application, 2017-2022 (US$ Bn)
TABLE 46 Europe Degassing Valves Market, by Application, 2023-2030 (US$ Bn)
TABLE 47 Europe Degassing Valves Market, by Country, 2017-2022 (US$ Bn)
TABLE 48 Europe Degassing Valves Market, by Country, 2023-2030 (US$ Bn)
TABLE 49 Germany Degassing Valves Market, by Type, 2017-2022 (US$ Bn)
TABLE 50 Germany Degassing Valves Market, by Type, 2023-2030 (US$ Bn)
TABLE 51 Germany Degassing Valves Market, by Application, 2017-2022 (US$ Bn)
TABLE 52 Germany Degassing Valves Market, by Application, 2023-2030 (US$ Bn)
TABLE 53 France Degassing Valves Market, by Type, 2017-2022 (US$ Bn)
TABLE 54 France Degassing Valves Market, by Type, 2023-2030 (US$ Bn)
TABLE 55 France Degassing Valves Market, by Application, 2017-2022 (US$ Bn)
TABLE 56 France Degassing Valves Market, by Application, 2023-2030 (US$ Bn)
TABLE 57 United Kingdom Degassing Valves Market, by Type, 2017-2022 (US$ Bn)
TABLE 58 United Kingdom Degassing Valves Market, by Type, 2023-2030 (US$ Bn)
TABLE 59 United Kingdom Degassing Valves Market, by Application, 2017-2022 (US$ Bn)
TABLE 60 United Kingdom Degassing Valves Market, by Application, 2023-2030 (US$ Bn)
TABLE 61 Italy Degassing Valves Market, by Type, 2017-2022 (US$ Bn)
TABLE 62 Italy Degassing Valves Market, by Type, 2023-2030 (US$ Bn)
TABLE 63 Italy Degassing Valves Market, by Application, 2017-2022 (US$ Bn)
TABLE 64 Italy Degassing Valves Market, by Application, 2023-2030 (US$ Bn)
TABLE 65 Spain Degassing Valves Market, by Type, 2017-2022 (US$ Bn)
TABLE 66 Spain Degassing Valves Market, by Type, 2023-2030 (US$ Bn)
TABLE 67 Spain Degassing Valves Market, by Application, 2017-2022 (US$ Bn)
TABLE 68 Spain Degassing Valves Market, by Application, 2023-2030 (US$ Bn)
TABLE 69 Rest of Europe Degassing Valves Market, by Type, 2017-2022 (US$ Bn)
TABLE 70 Rest of Europe Degassing Valves Market, by Type, 2023-2030 (US$ Bn)
TABLE 71 Rest of Europe Degassing Valves Market, by Application, 2017-2022 (US$ Bn)
TABLE 72 Rest of Europe Degassing Valves Market, by Application, 2023-2030 (US$ Bn)
TABLE 73 Asia Pacific Degassing Valves Market, by Type, 2017-2022 (US$ Bn)
TABLE 74 Asia Pacific Degassing Valves Market, by Type, 2023-2030 (US$ Bn)
TABLE 75 Asia Pacific Degassing Valves Market, by Application, 2017-2022 (US$ Bn)
TABLE 76 Asia Pacific Degassing Valves Market, by Application, 2023-2030 (US$ Bn)
TABLE 77 China Degassing Valves Market, by Type, 2017-2022 (US$ Bn)
TABLE 78 China Degassing Valves Market, by Type, 2023-2030 (US$ Bn)
TABLE 79 China Degassing Valves Market, by Application, 2017-2022 (US$ Bn)
TABLE 80 China Degassing Valves Market, by Application, 2023-2030 (US$ Bn)
TABLE 81 Japan Degassing Valves Market, by Type, 2017-2022 (US$ Bn)
TABLE 82 Japan Degassing Valves Market, by Type, 2023-2030 (US$ Bn)
TABLE 83 Japan Degassing Valves Market, by Application, 2017-2022 (US$ Bn)
TABLE 84 Japan Degassing Valves Market, by Application, 2023-2030 (US$ Bn)
TABLE 85 India Degassing Valves Market, by Type, 2017-2022 (US$ Bn)
TABLE 86 India Degassing Valves Market, by Type, 2023-2030 (US$ Bn)
TABLE 87 India Degassing Valves Market, by Application, 2017-2022 (US$ Bn)
TABLE 88 India Degassing Valves Market, by Application, 2023-2030 (US$ Bn)
TABLE 89 South Korea Degassing Valves Market, by Type, 2017-2022 (US$ Bn)
TABLE 90 South Korea Degassing Valves Market, by Type, 2023-2030 (US$ Bn)
TABLE 91 South Korea Degassing Valves Market, by Application, 2017-2022 (US$ Bn)
TABLE 92 South Korea Degassing Valves Market, by Application, 2023-2030 (US$ Bn)
TABLE 93 South-East Asia Degassing Valves Market, by Type, 2017-2022 (US$ Bn)
TABLE 94 South-East Asia Degassing Valves Market, by Type, 2023-2030 (US$ Bn)
TABLE 95 South-East Asia Degassing Valves Market, by Application, 2017-2022 (US$ Bn)
TABLE 96 South-East Asia Degassing Valves Market, by Application, 2023-2030 (US$ Bn)
TABLE 97 Rest of Asia Pacific Degassing Valves Market, by Type, 2017-2022 (US$ Bn)
TABLE 98 Rest of Asia Pacific Degassing Valves Market, by Type, 2023-2030 (US$ Bn)
TABLE 99 Rest of Asia Pacific Degassing Valves Market, by Application, 2017-2022 (US$ Bn)
TABLE 100 Rest of Asia Pacific Degassing Valves Market, by Application, 2023-2030 (US$ Bn)
TABLE 101 Latin America Degassing Valves Market, by Type, 2017-2022 (US$ Bn)
TABLE 102 Latin America Degassing Valves Market, by Type, 2023-2030 (US$ Bn)
TABLE 103 Latin America Degassing Valves Market, by Application, 2017-2022 (US$ Bn)
TABLE 104 Latin America Degassing Valves Market, by Application, 2023-2030 (US$ Bn)
TABLE 105 Brazil Degassing Valves Market, by Type, 2017-2022 (US$ Bn)
TABLE 106 Brazil Degassing Valves Market, by Type, 2023-2030 (US$ Bn)
TABLE 107 Brazil Degassing Valves Market, by Application, 2017-2022 (US$ Bn)
TABLE 108 Brazil Degassing Valves Market, by Application, 2023-2030 (US$ Bn)
TABLE 109 Argentina Degassing Valves Market, by Type, 2017-2022 (US$ Bn)
TABLE 110 Argentina Degassing Valves Market, by Type, 2023-2030 (US$ Bn)
TABLE 111 Argentina Degassing Valves Market, by Application, 2017-2022 (US$ Bn)
TABLE 112 Argentina Degassing Valves Market, by Application, 2023-2030 (US$ Bn)
TABLE 113 Rest of Latin America Degassing Valves Market, by Type, 2017-2022 (US$ Bn)
TABLE 114 Rest of Latin America Degassing Valves Market, by Type, 2023-2030 (US$ Bn)
TABLE 115 Rest of Latin America Degassing Valves Market, by Application, 2017-2022 (US$ Bn)
TABLE 116 Rest of Latin America Degassing Valves Market, by Application, 2023-2030 (US$ Bn)
TABLE 117 Middle East and Africa Degassing Valves Market, by Type, 2017-2022 (US$ Bn)
TABLE 118 Middle East and Africa Degassing Valves Market, by Type, 2023-2030 (US$ Bn)
TABLE 119 Middle East and Africa Degassing Valves Market, by Application, 2017-2022 (US$ Bn)
TABLE 120 Middle East and Africa Degassing Valves Market, by Application, 2023-2030 (US$ Bn)
TABLE 121 GCC Countries Degassing Valves Market, by Type, 2017-2022 (US$ Bn)
TABLE 122 GCC Countries Degassing Valves Market, by Type, 2023-2030 (US$ Bn)
TABLE 123 GCC Countries Degassing Valves Market, by Application, 2017-2022 (US$ Bn)
TABLE 124 GCC Countries Degassing Valves Market, by Application, 2023-2030 (US$ Bn)
TABLE 125 South Africa Degassing Valves Market, by Type, 2017-2022 (US$ Bn)
TABLE 126 South Africa Degassing Valves Market, by Type, 2023-2030 (US$ Bn)
TABLE 127 South Africa Degassing Valves Market, by Application, 2017-2022 (US$ Bn)
TABLE 128 South Africa Degassing Valves Market, by Application, 2023-2030 (US$ Bn)
TABLE 129 Rest of Middle East and Africa Degassing Valves Market, by Type, 2017-2022 (US$ Bn)
TABLE 130 Rest of Middle East and Africa Degassing Valves Market, by Type, 2023-2030 (US$ Bn)
TABLE 131 Rest of Middle East and Africa Degassing Valves Market, by Application, 2017-2022 (US$ Bn)
TABLE 132 Rest of Middle East and Africa Degassing Valves Market, by Application, 2023-2030 (US$ Bn)

Frequently Asked Questions:

What is the current size of the global degassing valves market?

The global degassing valves market was valued at USD 0.15 Billion in 2022.

What is the expected growth rate of the degassing valves market between 2023 and 2030?

The degassing valves market is expected to grow at a CAGR of 5.20% between 2023 and 2030, reaching USD 0.21 Billion in 2030.

Which segment is leading the market share in terms of type?

Filter integrated valves are the leading segment by type, holding over 43% share in value in 2022.

Which application segment governs the demand for degassing valves in the world?

The coffee segment governs the demand for degassing valves globally, holding a massive share of over 80% in 2022.

Which segment is expected to post the highest CAGR during the forecast period?

The coffee segment is expected to post the highest CAGR during the forecast period.

Which region is fueling the growth of the degassing valves industry?

North America is fueling the growth of the degassing valves industry, with over 30% share in 2022.

Who are the major players in the global degassing valves market?

The top players include CCL Industries, Syntegon Technology GmbH, FLAIR Flexible Packaging Corporation, Goglio, Amcor, Plitek Valves, TricorBraun Flex, Wipf Holding, Tungyi Hardware, Fres-co System, UrthPact.

What are the major market drivers of the degassing valves industry?

The major market drivers are rising millennial coffee consumption and increased import and export of coffee goods globally.

What are the major market restraints of the degassing valves industry?

Degasser installation comes with high upfront expenditures, which could be problematic for small and medium-sized businesses are the major market restraints.

What are the major market opportunities of the degassing valves industry?

Greater growth opportunities for Indian degassing valve producers due to increased coffee drinkers. There is a growing need for degassing valves due to rising coffee retail sales in the nation. However, market players in India are primarily focused on deploying degassing valves for packaging dairy goods are the major opportunities in the degassing valves industry.

Bamboos Market

Published:
Report ID: 36577

Automotive Webbing Market

Published:
Report ID: 36560

Geosynthetics Market

Published:
Report ID: 36207

Laminated Veneer Lumber Market

Published:
Report ID: 35834

Radiation Shielding Materials Market

Published:
Report ID: 15703

Thermochromic Materials Market

Published:
Report ID: 11162

Smart Mirrors Market

Published:
Report ID: 10279

3D Printed Nanocellulose Market

Published:
Report ID: 34690

Aerospace Plastics Market

Published:
Report ID: 2684

Fire Protection Materials Market For Construction Market

Published:
Report ID: 33848

Metal Structural Insulation Panels Market

Published:
Report ID: 33811

Luxury Vinyl Tile Flooring Market

Published:
Report ID: 33784

Purchase Options

$2999
Delivery Format: Excel.
$4999
Designed for the individual purchaser.
$6999
Users located at a single corporate site or regional office.
$7999
Allowed for unlimited sharing globally within one company.
Smallform of Sample request

Have a question?

User Profile

Don’t settle for less – trust Mitul to help you find the best solution.

Report delivery within 24 to 48 hours

– Other Info –

What people say?-

User Review

I am very impressed with the information in this report. The author clearly did their research when they came up with this product and it has already given me a lot of ideas.

Jana Schmidt
CEDAR CX Technologies

– Connect with us –

Phone

+91 6232 49 3207


support

24/7 Research Support


sales@credenceresearch.com

– Research Methodology –

Going beyond the basics: advanced techniques in research methodology

– Trusted By –

Pepshi, LG, Nestle
Motorola, Honeywell, Johnson and johnson
LG Chem, SIEMENS, Pfizer
Unilever, Samsonite, QIAGEN