CHAPTER NO. 1 : INTRODUCTION 18
1.1.1. Report Description 18
Purpose of the Report 18
USP & Key Offerings 18
1.1.2. Key Benefits for Stakeholders 18
1.1.3. Target Audience 19
1.1.4. Report Scope 19
CHAPTER NO. 2 : EXECUTIVE SUMMARY 20
2.1. Roof Windows Market Snapshot 20
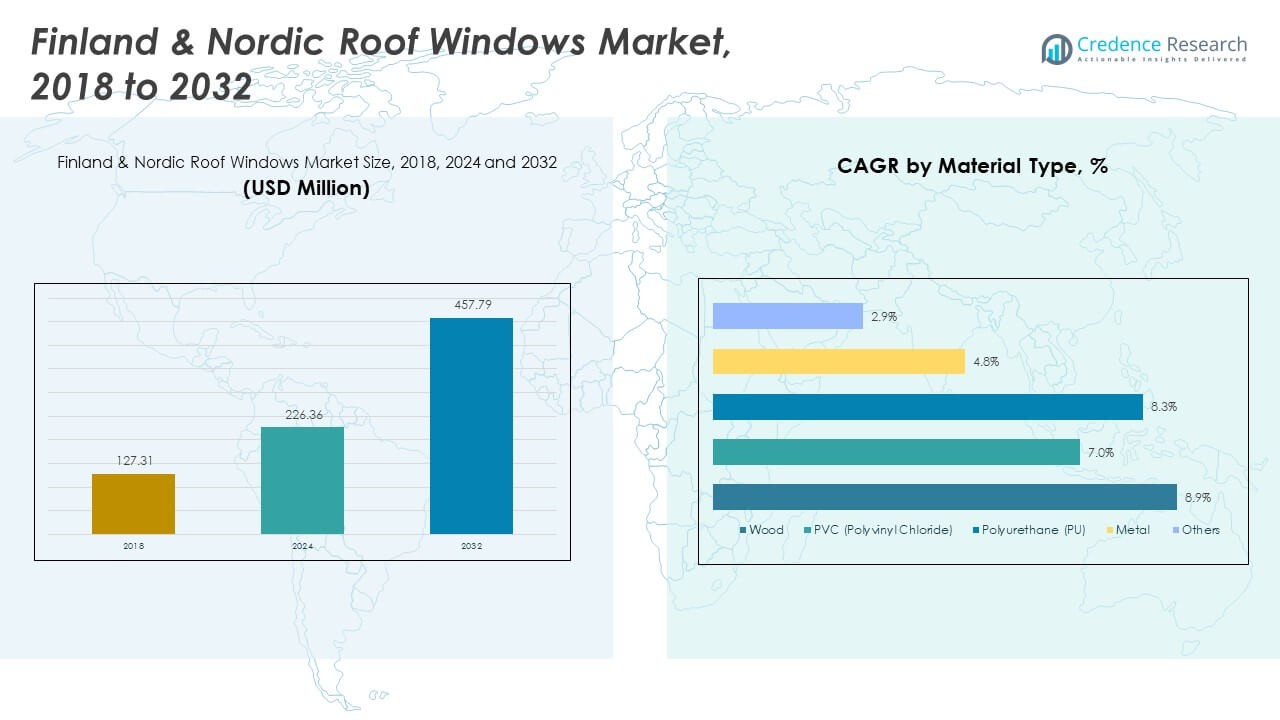
2.1.1. Finland & Nordic Roof Windows Market, 2018 – 2032 (Units) (USD Million) 21
2.2. Insights from Primary Respondents 21
CHAPTER NO. 3 : ROOF WINDOWS MARKET – INDUSTRY ANALYSIS 22
3.1. Introduction 22
3.2. Market Drivers 23
3.2.1. Increasing Demand for Natural Light and Ventilation 23
3.2.2. Growth in Renovation and Construction Activities 24
3.3. Market Restraints 25
3.3.1. High Installation and Product Costs 25
3.4. Market Opportunities 26
3.4.1. Market Opportunity Analysis 26
3.5. Porter’s Five Forces Analysis 27
3.6. Value Chain Analysis 28
3.7. Buying Criteria 29
CHAPTER NO. 4 : PRICE ANALYSIS 30
4.1. Price Analysis by Material Type 30
4.1.1. Finland & Nordic Roof Windows Market Price, By Material Type, 2018 – 2032 30
CHAPTER NO. 5 : ANALYSIS COMPETITIVE LANDSCAPE 31
5.1. Company Market Share Analysis – 2024 31
5.1.1. Finland & Nordic Roof Windows Market: Company Market Share, by Volume, 2024 31
5.1.2. Finland & Nordic Roof Windows Market: Company Market Share, by Revenue, 2024 32
5.1.3. Finland & Nordic Roof Windows Market: Top 6 Company Market Share, by Revenue, 2024 32
5.1.4. Finland & Nordic Roof Windows Market: Top 3 Company Market Share, by Revenue, 2024 33
5.2. Finland & Nordic Roof Windows Market Company Volume Market Share, 2024 34
5.3. Finland & Nordic Roof Windows Market Company Revenue Market Share, 2024 35
5.4. Company Assessment Metrics, 2024 36
5.4.1. Stars 36
5.4.2. Emerging Leaders 36
5.4.3. Pervasive Players 36
5.4.4. Participants 36
5.5. Start-ups /SMEs Assessment Metrics, 2024 36
5.5.1. Progressive Companies 36
5.5.2. Responsive Companies 36
5.5.3. Dynamic Companies 36
5.6. Starting BlocksStrategic Developments 36
5.6.1. Acquisitions & Mergers 37
New Product Launch 37
Country-wise Expansion 37
5.7. Key Players Product Matrix 38
CHAPTER NO. 6 : PESTEL & ADJACENT MARKET ANALYSIS 39
6.1. PESTEL 39
6.1.1. Political Factors 39
6.1.2. Economic Factors 39
6.1.3. Social Factors 39
6.1.4. Technological Factors 39
6.1.5. Environmental Factors 39
6.1.6. Legal Factors 39
6.2. Adjacent Market Analysis 39
CHAPTER NO. 7 : ROOF WINDOWS MARKET – BY MATERIAL TYPE SEGMENT ANALYSIS 40
7.1. Roof Windows Market Overview, by Material Type Segment 40
7.1.1. Roof Windows Market Volume Share, By Material Type, 2023 & 2032 41
7.1.2. Roof Windows Market Revenue Share, By Material Type, 2023 & 2032 41
7.1.3. Roof Windows Market Attractiveness Analysis, By Material Type 42
7.1.4. Incremental Revenue Growth Opportunity, by Material Type, 2024 – 2032 42
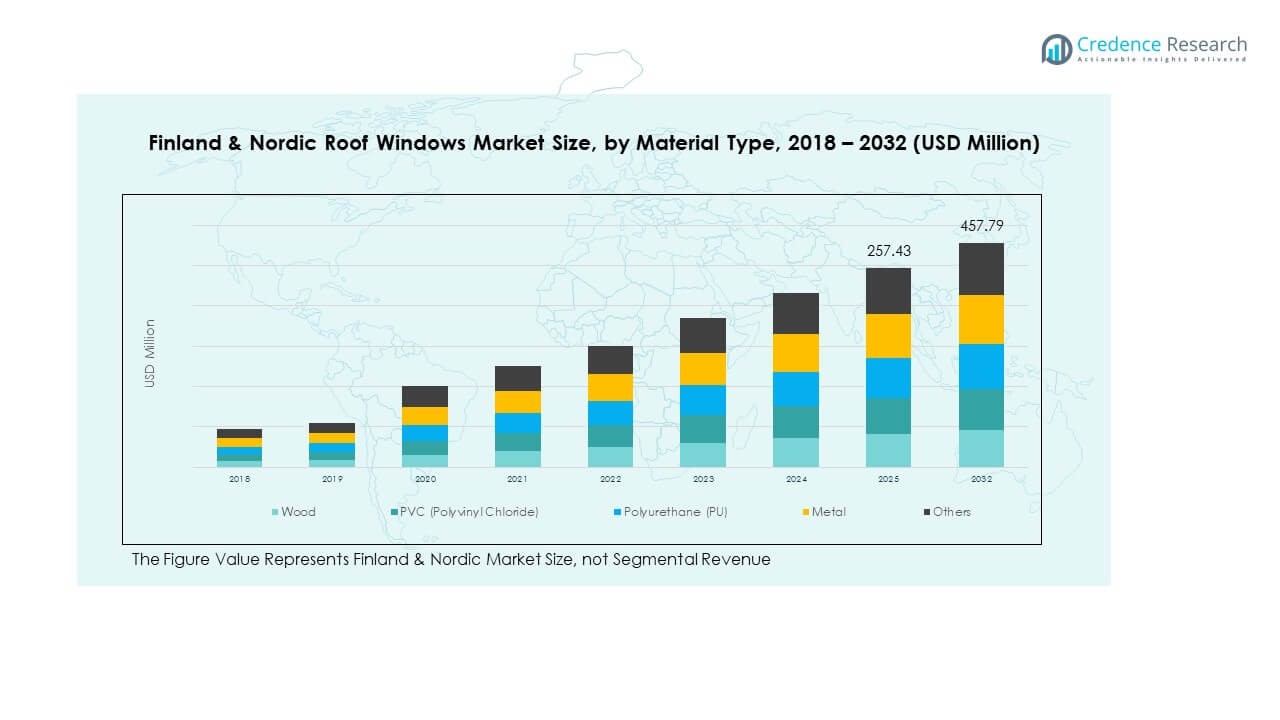
7.1.5. Roof Windows Market Revenue, By Material Type, 2018, 2023, 2027 & 2032 43
7.2. Wood 44
7.3. PVC (Polyvinyl Chloride) 45
7.4. Polyurethane (PU) 46
7.5. Metal 47
7.6. Others 48
CHAPTER NO. 8 : ROOF WINDOWS MARKET – BY APPLICATION SEGMENT ANALYSIS 49
8.1. Roof Windows Market Overview, by Application Segment 49
8.1.1. Roof Windows Market Volume Share, By Application, 2023 & 2032 50
8.1.2. Roof Windows Market Revenue Share, By Application, 2023 & 2032 50
8.1.3. Roof Windows Market Attractiveness Analysis, By Application 51
8.1.4. Incremental Revenue Growth Opportunity, by Application, 2024 – 2032 51
8.1.5. Roof Windows Market Revenue, By Application, 2018, 2023, 2027 & 2032 52
8.2. Residential 53
8.3. Commercial 54
CHAPTER NO. 9 : ROOF WINDOWS MARKET – BY APPLICATION SEGMENT ANALYSIS 55
9.1. Roof Windows Market Overview, by Sales Channel Segment 55
9.1.1. Roof Windows Market Volume Share, By Sales Channel, 2023 & 2032 56
9.1.2. Roof Windows Market Revenue Share, By Sales Channel, 2023 & 2032 56
9.1.3. Roof Windows Market Attractiveness Analysis, By Sales Channel 57
9.1.4. Incremental Revenue Growth Opportunity, by Sales Channel, 2024 – 2032 57
9.1.5. Roof Windows Market Revenue, By Sales Channel, 2018, 2023, 2027 & 2032 58
9.2. Direct Sales 59
9.3. Distributors 60
CHAPTER NO. 10 : ROOF WINDOWS MARKET – FINLAND & NORDIC 61
10.1. Finland & Nordic 61
10.1.1. Key Highlights 61
10.1.2. Finland & Nordic Roof Windows Market Volume, By Country, 2018 – 2023 (Units) 62
10.1.3. Finland & Nordic Roof Windows Market Revenue, By Country, 2018 – 2023 (USD Million) 63
10.1.4. Finland & Nordic Roof Windows Market Volume, By Material Type, 2018 – 2023 (Units) 64
10.1.5. Finland & Nordic Roof Windows Market Revenue, By Material Type, 2018 – 2023 (USD Million) 65
10.1.6. Finland & Nordic Roof Windows Market Volume, By Application, 2018 – 2023 (Units) 66
10.1.7. Finland & Nordic Roof Windows Market Revenue, By Application, 2018 – 2023 (USD Million) 67
10.1.8. Finland & Nordic Roof Windows Market Volume, By Sales Channel, 2018 – 2023 (Units) 68
10.1.9. Finland & Nordic Roof Windows Market Revenue, By Sales Channel, 2018 – 2023 (USD Million) 69
CHAPTER NO. 11 : COMPANY PROFILES 70
11.1. VELUX 70
11.1.1. Company Overview 70
11.1.2. Product Portfolio 70
11.1.3. Swot Analysis 70
11.1.4. Business Strategy 71
11.1.5. Financial Overview 71
11.2. Velfac 72
11.3. Lammin Ikkuna 72
11.4. Saaga Ikkunat 72
11.5. Fakro 72
11.6. Company 6 72
11.7. Company 7 72
11.8. Company 8 72
11.9. Company 9 72
11.10. Company 10 72
11.11. Company 11 72
11.12. Company 12 72
11.13. Company 13 72
11.14. Company 14 72
List of Figures
FIG NO. 1. Finland & Nordic Roof Windows Market Volume & Revenue, 2018 – 2032 (Units) (USD Million) 21
FIG NO. 2. Porter’s Five Forces Analysis for Finland & Nordic Roof Windows Market 27
FIG NO. 1. Finland & Nordic Roof Windows Market Price, By Material Type, 2018 – 2032 30
FIG NO. 2. Company Share Analysis, 2024 31
FIG NO. 3. Company Share Analysis, 2024 32
FIG NO. 4. Company Share Analysis, 2024 32
FIG NO. 5. Company Share Analysis, 2023 33
FIG NO. 6. Roof Windows Market – Company Volume Market Share, 2024 34
FIG NO. 7. Roof Windows Market – Company Revenue Market Share, 2024 35
FIG NO. 8. Roof Windows Market Volume Share, By Material Type, 2023 & 2032 41
FIG NO. 9. Roof Windows Market Revenue Share, By Material Type, 2023 & 2032 41
FIG NO. 10. Market Attractiveness Analysis, By Material Type 42
FIG NO. 11. Incremental Revenue Growth Opportunity by Material Type, 2024 – 2032 42
FIG NO. 12. Roof Windows Market Revenue, By Material Type, 2018, 2023, 2027 & 2032 43
FIG NO. 13. Finland & Nordic Roof Windows Market for Wood, Volume & Revenue (Units) (USD Million) 2018 – 2032 44
FIG NO. 14. Finland & Nordic Roof Windows Market for PVC (Polyvinyl Chloride), Volume & Revenue (Units) (USD Million) 2018 – 2032 45
FIG NO. 15. Finland & Nordic Roof Windows Market for Polyurethane (PU), Volume & Revenue (Units) (USD Million) 2018 – 2032 46
FIG NO. 16. Finland & Nordic Roof Windows Market for Metal, Volume & Revenue (Units) (USD Million) 2018 – 2032 47
FIG NO. 17. Finland & Nordic Roof Windows Market for Others, Volume & Revenue (Units) (USD Million) 2018 – 2032 48
FIG NO. 18. Roof Windows Market Volume Share, By Application, 2023 & 2032 50
FIG NO. 19. Roof Windows Market Revenue Share, By Application, 2023 & 2032 50
FIG NO. 20. Market Attractiveness Analysis, By Application 51
FIG NO. 21. Incremental Revenue Growth Opportunity by Application, 2024 – 2032 51
FIG NO. 22. Roof Windows Market Revenue, By Application, 2018, 2023, 2027 & 2032 52
FIG NO. 23. Finland & Nordic Roof Windows Market for Residential, Volume & Revenue (Units) (USD Million) 2018 – 2032 53
FIG NO. 24. Finland & Nordic Roof Windows Market for Commercial, Volume & Revenue (Units) (USD Million) 2018 – 2032 54
FIG NO. 25. Roof Windows Market Volume Share, By Sales Channel, 2023 & 2032 56
FIG NO. 26. Roof Windows Market Revenue Share, By Sales Channel, 2023 & 2032 56
FIG NO. 27. Market Attractiveness Analysis, By Sales Channel 57
FIG NO. 28. Incremental Revenue Growth Opportunity by Sales Channel, 2024 – 2032 57
FIG NO. 29. Roof Windows Market Revenue, By Sales Channel, 2018, 2023, 2027 & 2032 58
FIG NO. 30. Finland & Nordic Roof Windows Market for Direct Sales, Volume & Revenue (Units) (USD Million) 2018 – 2032 59
FIG NO. 31. Finland & Nordic Roof Windows Market for Distributors, Volume & Revenue (Units) (USD Million) 2018 – 2032 60
FIG NO. 32. Finland & Nordic Roof Windows Market Volume & Revenue, 2018 – 2032 (Units) (USD Million) 61
List of Table
TABLE NO. 1. : Finland & Nordic Roof Windows Market: Snapshot 20
TABLE NO. 2. : Drivers for the Roof Windows Market: Impact Analysis 23
TABLE NO. 3. : Restraints for the Roof Windows Market: Impact Analysis 25
TABLE NO. 4. : Finland & Nordic Roof Windows Market Volume, By Country, 2018 – 2023 (Units) 62
TABLE NO. 5. : Finland & Nordic Roof Windows Market Volume, By Country, 2024 – 2032 (Units) 62
TABLE NO. 6. : Finland & Nordic Roof Windows Market Revenue, By Country, 2018 – 2023 (USD Million) 63
TABLE NO. 7. : Finland & Nordic Roof Windows Market Revenue, By Country, 2024 – 2032 (USD Million) 63
TABLE NO. 8. : Finland & Nordic Roof Windows Market Volume, By Material Type, 2018 – 2023 (Units) 64
TABLE NO. 9. : Finland & Nordic Roof Windows Market Volume, By Material Type, 2024 – 2032 (Units) 64
TABLE NO. 10. : Finland & Nordic Roof Windows Market Revenue, By Material Type, 2018 – 2023 (USD Million) 65
TABLE NO. 11. : Finland & Nordic Roof Windows Market Revenue, By Material Type, 2024 – 2032 (USD Million) 65
TABLE NO. 12. : Finland & Nordic Roof Windows Market Volume, By Application, 2018 – 2023 (Units) 66
TABLE NO. 13. : Finland & Nordic Roof Windows Market Volume, By Application, 2024 – 2032 (Units) 66
TABLE NO. 14. : Finland & Nordic Roof Windows Market Revenue, By Application, 2018 – 2023 (USD Million) 67
TABLE NO. 15. : Finland & Nordic Roof Windows Market Revenue, By Application, 2024 – 2032 (USD Million) 67
TABLE NO. 16. : Finland & Nordic Roof Windows Market Volume, By Sales Channel, 2018 – 2023 (Units) 68
TABLE NO. 17. : Finland & Nordic Roof Windows Market Volume, By Sales Channel, 2024 – 2032 (Units) 68
TABLE NO. 18. : Finland & Nordic Roof Windows Market Revenue, By Sales Channel, 2018 – 2023 (USD Million) 69
TABLE NO. 19. : Finland & Nordic Roof Windows Market Revenue, By Sales Channel, 2024 – 2032 (USD Million) 69