
Pre-Engineered Buildings Market Overview:
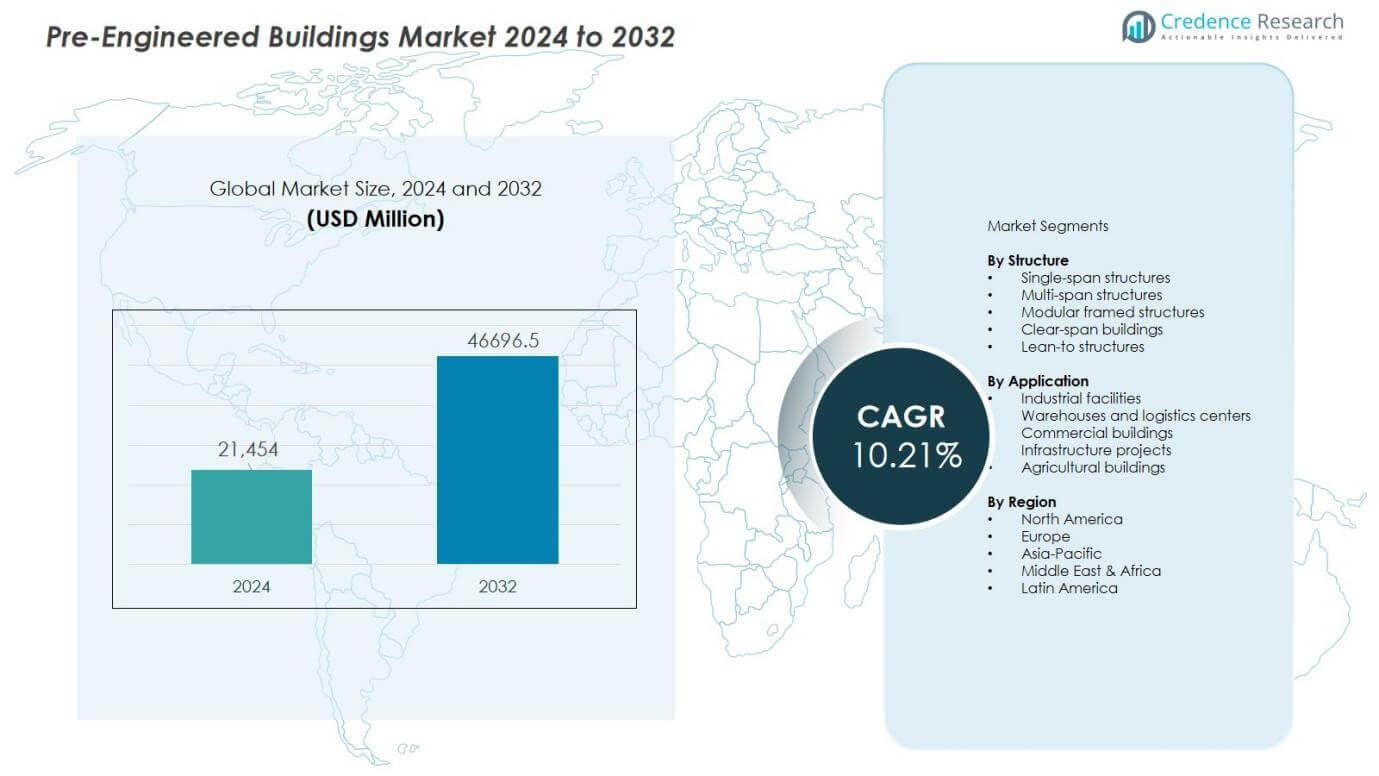
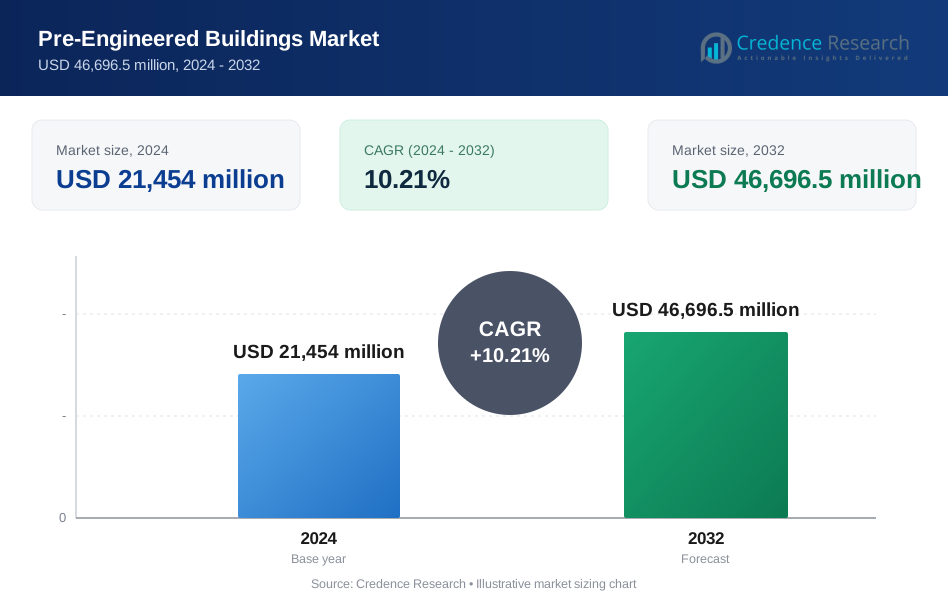
The Pre-Engineered Buildings Market size was valued at USD 21,454 million in 2024 and is anticipated to reach USD 46696.5 million by 2032, at a CAGR of 10.21 % during the forecast period.
| REPORT ATTRIBUTE | DETAILS |
|---|---|
| Historical Period | 2020-2024 |
| Base Year | 2025 |
| Forecast Period | 2026-2032 |
| Pre-Engineered Buildings Market Size 2024 | USD 83 million |
| Pre-Engineered Buildings Market, CAGR | 10.17% |
| Pre-Engineered Buildings Market Size 2032 | USD 179.57 million |
Pre-Engineered Buildings Market Insights:
- Asia-Pacific (~42%), North America (~27%), and Europe (~18%) represent the top three regional shares, supported by large-scale industrialization and infrastructure spending in Asia-Pacific, logistics and commercial construction demand in North America, and energy-efficient building regulations in Europe.
- Middle East & Africa (~8%) ranks as the fastest-growing region, fueled by industrial diversification, logistics hub development, free-zone expansion, and government-backed infrastructure programs.
- By application, industrial facilities account for ~48% share, reflecting strong demand from manufacturing plants, factories, and heavy industrial units requiring scalable and rapid construction solutions.
- Warehouses and logistics centers hold ~32% share, supported by sustained growth in e-commerce, organized retail, and supply-chain modernization across major economies.
Pre-Engineered Buildings Market Drivers:
Accelerated Construction Timelines and Cost Optimization Across Projects
The Pre-Engineered Buildings Market benefits from shortened project schedules that support faster asset deployment across industrial and commercial developments. Factory-controlled fabrication improves precision and reduces on-site labor dependency. It enables predictable timelines that align with tight commissioning targets. Developers favor it to control capital expenditure and minimize schedule risk. Standardized components also support consistent quality across multiple sites.
- For Instance, BlueScope Buildings utilized factory-controlled fabrication to erect a 50,000 sq ft warehouse in eight weeks, compared to 20 weeks for traditional methods
Expanding Industrial, Warehousing, and Logistics Infrastructure Demand
Rising demand for warehouses, manufacturing units, and logistics hubs strengthens the Pre-Engineered Buildings Market. Growth in e-commerce and organized retail increases demand for large-span, high-bay structures. It supports flexible layouts that adapt to automation and storage optimization. Industrial users value scalability to match capacity expansion plans. This preference reinforces repeat adoption across multi-location networks.
- For instance, Amazon utilized pre-engineered buildings to construct over 355 U.S. warehouses covering 319 million square feet by 2023, enabling rapid scalability for e-commerce fulfillment.
Sustainability Compliance and Resource-Efficient Construction Practices
Sustainability mandates and corporate ESG goals drive adoption within the Pre-Engineered Buildings Market. Optimized steel usage reduces material waste and supports circular construction practices. It enables integration of energy-efficient insulation and rooftop solar systems. Lower site disturbance aligns with environmental permitting requirements. These attributes improve long-term operating efficiency and regulatory alignment.
Design Flexibility and Technological Advancement in Building Systems
Advances in digital design tools strengthen the Pre-Engineered Buildings Market by improving customization and execution accuracy. Building information modeling supports clash detection and design optimization. It allows rapid modification to meet evolving end-user needs. Improved coatings and structural systems extend service life. This progress enhances confidence among developers and contractors.
Pre-Engineered Buildings Market Trends:
Rising Adoption of Digitally Enabled Design and Integrated Project Execution Models
The Pre-Engineered Buildings Market reflects a clear shift toward digitally enabled design workflows that improve project accuracy and delivery speed. Advanced modeling platforms support precise structural planning and reduce design conflicts before fabrication. It enables coordinated execution between manufacturers, contractors, and project owners. Standardization combined with configurable modules improves consistency without limiting customization. Developers prefer digital workflows to improve cost forecasting and procurement planning. Integration with automated fabrication systems enhances dimensional accuracy. This trend supports reliable delivery across complex and large-scale projects.
- For Instance, BlueScope utilizes advanced BIM-integrated platforms to design and engineer large-scale facilities, such as the 120,000-square-foot assembly plant for Burr Oak Tool Inc., ensuring high-precision fabrication and eliminating onsite design conflicts.
Increasing Preference for Sustainable, High-Performance Building Solutions
Sustainability-driven construction practices shape material selection and system design within the Pre-Engineered Buildings Market. High-strength steel grades and optimized framing reduce overall material consumption. It supports efficient thermal insulation and daylight utilization for lower operational energy demand. Demand for green-certified industrial and commercial facilities strengthens this shift. Owners prioritize long service life and reduced maintenance exposure. Prefabricated systems also support easier disassembly and reuse. These characteristics align with corporate sustainability objectives and regulatory expectations.
- For Instance, BlueScope Steel utilizes high-strength steel grades such as G550 (550 MPa) in its COLORBOND product range.
Pre-Engineered Buildings Market Challenges Analysis:
Volatility in Raw Material Pricing and Supply Chain Reliability Constraints
The Pre-Engineered Buildings Market faces persistent challenges from fluctuating steel prices that affect project cost predictability. Steel represents a major portion of total structure cost, which increases exposure to commodity cycles. It complicates long-term pricing commitments for contractors and developers. Supply chain disruptions also affect lead times for primary frames and secondary components. Dependence on a limited number of qualified suppliers intensifies procurement risk. Logistics delays disrupt coordinated site execution schedules. These factors pressure margins and contract stability.
Regulatory Complexity and Skilled Workforce Availability Limitations
Regulatory variation across regions challenges standardization within the Pre-Engineered Buildings Market. Local building codes often require project-specific redesign and approvals. It increases design lead times and documentation effort. Skilled labor shortages in erection and quality inspection create execution risks. Limited familiarity with advanced prefabricated systems affects installation accuracy. Training requirements add to project costs and timelines. These constraints slow broader market penetration.
Pre-Engineered Buildings Market Opportunities:
Expansion of Industrialization and Infrastructure Investment Across Emerging Economies
The Pre-Engineered Buildings Market gains strong opportunity from accelerated industrial growth in emerging economies. Governments prioritize manufacturing zones, logistics parks, and export hubs. It supports rapid deployment of factories and warehouses with predictable budgets. Public infrastructure programs favor scalable construction methods to meet tight timelines. Private developers seek solutions that reduce site complexity and financing exposure. Industrial clusters in Asia, the Middle East, and Africa strengthen long-term demand. These conditions expand addressable project volumes.
Technological Innovation and Customization for Value-Added Applications
Product innovation creates new revenue pathways within the Pre-Engineered Buildings Market. Advanced coatings improve corrosion resistance and extend structural life. It enables application in harsh environments such as coastal and industrial zones. Hybrid designs support multi-story commercial and institutional projects. Integration with smart building systems enhances asset value. Customization options meet sector-specific operational needs. This evolution supports premium pricing and differentiation.
Pre-Engineered Buildings Market Segmentation Analysis:
By Structure:
The Pre-Engineered Buildings Market by structure includes single-span, multi-span, and modular framed systems. Single-span structures hold strong demand for warehouses and logistics facilities due to unobstructed floor space. Multi-span systems support large industrial plants and heavy manufacturing units that require higher load-bearing capacity. It also benefits from modular structural designs that allow phased expansion. Flexibility in bay spacing and roof configurations improves suitability across end uses. Structural standardization supports faster approvals and repeat deployment.
- For Instance, Butler Manufacturing, BlueScope Steel has provided structural solutions for Amazon facilities, such as the fulfillment center in Pflugerville, Texas
By Application:
By application, the Pre-Engineered Buildings Market serves industrial, commercial, and infrastructure segments. Industrial applications dominate due to widespread use in factories, assembly units, and storage facilities. Commercial adoption rises in retail centers, offices, and institutional buildings that require rapid completion. It also supports infrastructure projects such as airports, metro depots, and power facilities. Demand from logistics and e-commerce hubs remains strong. Application diversity improves market resilience.
- For instance, Tata BlueScope Steel constructed its own 47,860 square meter coated steel manufacturing facility in Jamshedpur using pre-engineered building (PEB) technology, illustrating a scale of nearly 50,000 square meters.
By Region:
Regionally, the Pre-Engineered Buildings Market shows strong performance in Asia-Pacific, supported by manufacturing growth and infrastructure investment. North America maintains steady demand driven by industrial modernization and warehouse expansion. It also gains traction in Europe due to energy-efficient building mandates. Middle East and Africa record rising adoption across industrial and commercial construction. Latin America presents gradual growth tied to logistics and industrial development.
Segmentations:
By Structure
- Single-span structures
- Multi-span structures
- Modular framed structures
- Clear-span buildings
- Lean-to structures
By Application
- Industrial facilities
- Warehouses and logistics centers
- Commercial buildings
- Infrastructure projects
- Agricultural buildings
By Region
- North America
- U.S.
- Canada
- Mexico
- Europe
- Germany
- France
- U.K.
- Italy
- Spain
- Rest of Europe
- Asia Pacific
- China
- Japan
- India
- South Korea
- South-east Asia
- Rest of Asia Pacific
- Latin America
- Brazil
- Argentina
- Rest of Latin America
- Middle East & Africa
- GCC Countries
- South Africa
- Rest of the Middle East and Africa
Regional Analysis:
Asia-Pacific Driven by Rapid Industrialization and Infrastructure Expansion
The Pre-Engineered Buildings Market in Asia-Pacific shows strong momentum due to large-scale industrialization and urban infrastructure development. Manufacturing expansion in China, India, and Southeast Asia supports sustained demand for factories and warehouses. It benefits from government-backed industrial corridors and logistics parks. Growth in e-commerce strengthens demand for large distribution facilities. Cost-sensitive developers prefer standardized building systems to control capital outlay. Rising private investment supports repeat project execution. The region remains the primary growth engine.
North America Supported by Logistics Modernization and Commercial Construction
North America maintains a significant share in the Pre-Engineered Buildings Market driven by logistics modernization and commercial expansion. Strong warehouse demand follows growth in online retail and supply chain restructuring. It supports retrofitting and replacement of aging industrial facilities. Contractors value predictable timelines and controlled quality. Adoption of energy-efficient structures aligns with sustainability objectives. Investment in data centers and cold storage facilities strengthens regional demand. The market reflects stable, technology-led growth.
Europe, Middle East, and Other Regions Shaped by Regulation and Infrastructure Demand
Europe holds a steady position in the Pre-Engineered Buildings Market supported by strict energy efficiency regulations and industrial upgrades. It favors high-performance steel structures with optimized thermal profiles. Middle East markets show rising demand across industrial and commercial construction. Infrastructure diversification and free zone development support adoption. Latin America records gradual uptake driven by logistics and manufacturing investments. Regional diversity balances global demand patterns.
Key Player Analysis:
- Green buildings
- Robotics
- 3d printing
- Connected construction sites
- Materials science innovations
- Sustainable construction
- Analytics in Construction
- Offsite construction
- Advanced building material
- Construction drones
- Prefabrication
Competitive Analysis:
The Pre-Engineered Buildings Market features a competitive landscape shaped by global manufacturers and regional specialists that compete on design capability, execution speed, and cost discipline. Leading players focus on integrated offerings that combine design, fabrication, and erection to improve delivery control. It favors firms with strong steel sourcing networks and advanced fabrication facilities. Companies invest in digital design tools to improve accuracy and shorten lead times. Product differentiation centers on structural optimization, coating technology, and compliance with regional codes. Regional players leverage local knowledge to secure infrastructure and industrial contracts. Strategic partnerships with contractors and developers strengthen market access. Price competition remains intense in cost-sensitive regions, while value-added solutions command premiums in mature markets. Continuous investment in capacity expansion and technology upgrades defines competitive positioning.
Recent Developments:
- In October 2025, Buildots acquired Genda, a workforce and safety management platform, to integrate construction progress tracking with labor insights for enhanced site productivity.
- In November 2025, Alquist launched partnerships with Walmart, Hugg & Hall, and FMGI to deploy 3D-printed construction technology across commercial retail projects, enabling robotic printing of structural walls starting in December.
Report Coverage:
The research report offers an in-depth analysis based on Structure, Application and Region. It details leading Market players, providing an overview of their business, product offerings, investments, revenue streams, and key applications. Additionally, the report includes insights into the competitive environment, SWOT analysis, current Market trends, as well as the primary drivers and constraints. Furthermore, it discusses various factors that have driven Market expansion in recent years. The report also explores Market dynamics, regulatory scenarios, and technological advancements that are shaping the industry. It assesses the impact of external factors and global economic changes on Market growth. Lastly, it provides strategic recommendations for new entrants and established companies to navigate the complexities of the Market.
Future Outlook:
- The Pre-Engineered Buildings Market is expected to advance through broader acceptance of standardized, factory-fabricated construction across industrial and commercial projects.
- Developers will prioritize faster project delivery and predictable execution schedules to manage capital deployment and meet tight operational timelines.
- Technological adoption will strengthen design precision, project coordination, and fabrication quality across complex and multi-location developments.
- Sustainability requirements will encourage wider use of optimized steel structures that support energy efficiency and reduced material consumption.
- Industrial expansion in emerging economies will create sustained demand for manufacturing plants, logistics hubs, and utility facilities.
- Customization capabilities will improve to address sector-specific needs without compromising speed or cost efficiency.
- Integration of smart building features will enhance asset performance and long-term operational value for owners.
- Growth in e-commerce and supply chain restructuring will reinforce demand for large-span and high-bay warehouse structures.
- Regulatory alignment and code-compliant design systems will improve acceptance across diverse geographic markets.
- Competitive focus will shift toward value-added services, lifecycle performance, and long-term client partnerships.
Request a Free Sample
Fill in your details and we'll send you a free sample report.
- Sample data tables & charts
- Research methodology
Need a Custom Version of This Report?
Tailor the scope, geography, or segments to your exact requirements.
- Custom geography or segment scope
- Direct access to our analyst team
Frequently Asked Questions
What is the current market size for the Pre-Engineered Buildings Market, and what is its projected size in 2032?
At what Compound Annual Growth Rate is the Pre-Engineered Buildings Market projected to grow between 2024 and 2032?
Which segment held the largest share of the Pre-Engineered Buildings Market in 2024?
What are the primary factors fueling the growth of the Pre-Engineered Buildings Market?
Who are the leading participants shaping the Pre-Engineered Buildings Market?
Which region commanded the largest share of the Pre-Engineered Buildings Market in 2024?
Table of Content
Chapter 1. Report Introduction
- 1.1 Report Description & Purpose
- 1.1.1 Report Title & Market Definition
- 1.1.2 Unique Selling Propositions (USP) & Key Differentiators
- 1.1.3 Value Proposition for Stakeholders
- 1.2 Research Objectives
- 1.2.1 Market Sizing Objectives (Volume & Revenue) (Volume Where Applicable)
- 1.2.2 Segmentation Objectives
- 1.2.3 Competitive Intelligence Objectives
- 1.2.4 Forecast & Scenario Objectives
- 1.3 Report Scope
- 1.3.1 Pre-Engineered Buildings Scope – Segments & Subsegments Covered
- 1.3.2 Geographic Scope – Regions & Countries Covered
- 1.3.3 Historical Period, Base Year & Forecast Period (2024; forecast to 2032)
- 1.3.4 Inclusions & Exclusions
- 1.4 Industry Classification & Applicable Codes
- 1.5 Currency, Measurement Units & Valuation Basis
- 1.6 Target Stakeholders
- 1.7 Limitations & Assumptions
Chapter 2. Executive Summary
- 2.1 Global Pre-Engineered Buildings Market Snapshot
- 2.1.1 Market Size – Historical (2024) & Forecast (2024-2032) (2024: USD 21,454 million → 2032: USD 46,696.5 million)
- 2.1.2 Volume & Revenue – Global Totals (Volume Where Applicable)
- 2.1.3 Key Market Highlights – Top Five Facts
- 2.2 Pre-Engineered Buildings Market Segmentation Snapshot
- 2.2.1 Market Split by Region – 2024 vs. 2032
- 2.3 Competitive Snapshot
- 2.3.1 Top 10 Players by Revenue Share – 2024
- 2.3.2 Top 10 Players by Volume Share – 2024 (Volume Where Applicable)
- 2.3.3 Recent Strategic Developments (18-Month Summary)
- 2.4 Key Investment Highlights & Strategic Conclusions
Chapter 3. Pre-Engineered Buildings Market Dynamics & Industry Analysis
- 3.1 Market Overview & Context
- 3.1.1 Pre-Engineered Buildings Market Position in the Broader Industry Value Chain
- 3.1.2 Demand Structure & Purchasing Dynamics
- 3.1.3 Market Maturity & Development Stage by Region
- 3.2 Pre-Engineered Buildings Market Drivers
- 3.3 Pre-Engineered Buildings Market Restraints & Challenges
- 3.4 Pre-Engineered Buildings Market Opportunities
- 3.5 Porter's Five Forces Analysis
- 3.5.1 Threat of New Entrants
- 3.5.2 Bargaining Power of Suppliers
- 3.5.3 Bargaining Power of Buyers
- 3.5.4 Threat of Substitutes
- 3.5.5 Competitive Rivalry – Intensity Assessment
- 3.6 Pre-Engineered Buildings Value Chain Analysis
- 3.6.1 Upstream – Key Inputs, Resources & Suppliers
- 3.6.1.1 Key Input/Resource 1
- 3.6.1.2 Key Input/Resource 2
- 3.6.1.3 Key Input/Resource 3
- 3.6.2 Midstream – Core Operations & Value Creation
- 3.6.2.1 Operating Model & Process Overview
- 3.6.2.2 Key Operating Locations & Capabilities by Company
- 3.6.3 Downstream – Market Channels & End Users
- 3.6.3.1 Direct Sales & Customer Engagement Channels
- 3.6.3.2 Indirect Sales, Intermediaries & Partner Channels
- 3.6.4 Value Chain Profitability Analysis
- 3.6.1 Upstream – Key Inputs, Resources & Suppliers
- 3.7 PESTEL Analysis
- 3.7.1 Political Factors
- 3.7.2 Economic Factors
- 3.7.3 Social Factors
- 3.7.4 Technological Factors
- 3.7.5 Environmental Factors
- 3.7.6 Legal Factors
- 3.8 Pre-Engineered Buildings Supply Chain Analysis
- 3.8.1 Critical Input & Resource Availability Risk Assessment
- 3.8.2 Supplier & Operational Concentration Risk (Geographic Exposure)
- 3.8.3 Supply & Service Disruption Impact Analysis
- 3.9 Regulatory & Policy Landscape
Note: The regulatory and policy landscape section covers regulations based on their applicability to the market, Pre-Engineered Buildings category, geography, and scope of the study. Only regulatory frameworks with a material impact on operations, compliance, trade, sustainability, or market access are analyzed in detail.
Chapter 4. Key Investment Pockets & Opportunity Analysis
- 4.1 Pre-Engineered Buildings Market Attractiveness Analysis
- 4.1.1 By Region – Investment Attractiveness Matrix (Market Size × CAGR)
- 4.2 Absolute Revenue Growth Opportunity
- 4.2.1 By Region – Absolute Revenue Growth Through 2032
- 4.3 Incremental Demand Opportunity
- 4.3.1 By Region – Incremental Demand Through 2032
- 4.3.2 Segment – Incremental Demand
- 4.4 Emerging Submarket Opportunity Deep Dive (Subject to Applicability)
- 4.5 Priority Market Opportunity Scorecards
- 4.5.1 United States
- 4.5.2 Europe
- 4.5.3 Asia
- 4.5.4 Middle East & Africa
Note: Priority market opportunity scorecards reflect the geographic scope and strategic relevance of the study. Listed markets are indicative and may be adapted to the industry.
Chapter 5. Pre-Engineered Buildings Cross-Border Trade & Market Access Analysis
- 5.1 International Trade & Cross-Border Activity Overview
- 5.1.1 Global Export Value by Country (2024)
- 5.1.2 Global Export Volume by Country (2024) (Volume Where Applicable)
- 5.1.3 Global Import Value by Country (2024)
- 5.1.4 Global Import Volume by Country (2024) (Volume Where Applicable)
- 5.1.5 Net Trade Balance by Country (2024)
- 5.2 Export Analysis – Segment
- 5.2.1 Category 1 (Applicable Classification Code)
- 5.2.2 Category 2 (Applicable Classification Code)
- 5.2.3 Category 3 (Applicable Classification Code)
- 5.2.4 Category 4 (Applicable Classification Code)
- 5.2.5 Category 5 (Applicable Classification Code)
- 5.3 Import Analysis – Segment
- 5.3.1 Category 1 (Applicable Classification Code)
- 5.3.2 Category 2 (Applicable Classification Code)
- 5.3.3 Category 3 (Applicable Classification Code)
- 5.3.4 Category 4 (Applicable Classification Code)
- 5.3.5 Category 5 (Applicable Classification Code)
- 5.4 Cross-Border Pricing & Transaction Benchmarks
- 5.4.1 Export Pricing – Segment & Country
- 5.4.2 Import Pricing – Segment & Source Country
- 5.4.3 Price Trends (2024)
- 5.5 Key Cross-Border Trade & Delivery Routes
- 5.5.1 Cross-Border Trade/Delivery Route 1
- 5.5.2 Cross-Border Trade/Delivery Route 2
- 5.5.3 Cross-Border Trade/Delivery Route 3
- 5.5.4 Cross-Border Trade/Delivery Route 4
- 5.5.5 Cross-Border Trade/Delivery Route 5
- 5.6 Trade Policy & Market Access Impact Assessment
- 5.6.1 Tariff & Non-Tariff Barriers
- 5.6.2 Regional Trade & Economic Integration Frameworks
- 5.6.3 Bilateral & Multilateral Trade Agreements
- 5.6.4 Cross-Border Operating, Licensing & Localization Requirements
Note: This chapter applies where cross-border trade or delivery is relevant to Pre-Engineered Buildings. Goods, services, and digital offerings are assessed using applicable classifications and transaction measures. Import-export volumes, trade balances, and route analyses are included only where meaningful to the market.
Chapter 6. Competitive Landscape & Company Benchmarking
- 6.1 Pre-Engineered Buildings Market Concentration & Structure
- 6.1.1 Herfindahl-Hirschman Index (HHI) – vs. 2024
- 6.1.2 Leading, Mid-Sized & Emerging Player Structure
- 6.1.3 Global, Regional & Local Player Dynamics
- 6.2 Pre-Engineered Buildings Market Share Analysis – 2024
- 6.2.1 Global Revenue Share by Company
- 6.2.2 Global Volume Share by Company (Volume Where Applicable)
- 6.2.3 Regional Revenue Share
- 6.2.4 Market Share Evolution ( vs. 2024)
- 6.2.5 Company Market Share by Key Segment
- 6.2.6 Company Market Share by Customer Group
- 6.3 Operating Scale, Capacity & Infrastructure Analysis
- 6.3.1 Global Operating Scale & Supply Capacity
- 6.3.2 Resource Utilization & Operating Efficiency
- 6.3.3 Output, Service Delivery & Activity Metrics
- 6.3.4 Operating Footprint & Infrastructure Map
- 6.3.5 Planned Operational & Capacity Expansion
- 6.4 Pre-Engineered Buildings Competitive Benchmarking Matrix
- 6.4.1 Revenue, Growth, Profitability & Operating Metric Comparison
- 6.4.2 Channel Revenue Mix
- 6.4.3 Geographic Revenue Exposure
- 6.4.4 R&D Intensity
- 6.4.5 Sustainability Maturity
- 6.5 Strategic Developments in Pre-Engineered Buildings (Last 24 Months)
- 6.5.1 Mergers, Acquisitions & Divestments
- 6.5.2 New Products, Services & Solutions in Pre-Engineered Buildings
- 6.5.3 Operational & Infrastructure Expansions
- 6.5.4 Strategic Alliances, Joint Ventures & Partnerships
- 6.5.5 Distribution Expansion & Market Entry
- 6.5.6 Sustainability & ESG Initiatives
- 6.6 Competitive Strategy Mapping
- 6.6.1 Leader, Challenger, Follower & Niche Classification
- 6.6.2 Pricing Strategy Comparison
- 6.6.3 Channel Strategy Matrix
Note: Strategic developments are included based on their materiality and the availability of reliable information.
Chapter 7. Global Pre-Engineered Buildings Market – By Sales & Delivery Channel
- 7.1 Segment Overview
- 7.1.1 Volume & Revenue Split by Channel (2024 & 2032) (Volume Where Applicable)
- 7.1.2 Channel Mix Evolution (2024-2032)
Chapter 8. Regional Market Analysis – Global Overview
- 8.1 Global Regional Overview
- 8.1.1 Regional Volume Share (Volume Where Applicable)
- 8.1.2 Regional Revenue Share
- 8.1.3 Regional Volume by Region (Volume Where Applicable)
- 8.1.4 Regional Revenue by Region
- 8.1.5 Regional Forecast Through 2032
- 8.2 Cross-Regional Segment Analysis
- 8.2.1 By Sales & Delivery Channel
- 8.2.2 By Competitive Positioning & Price Tier
Chapter 9. North America Pre-Engineered Buildings Market
- 9.1 United States
- 9.2 Canada
- 9.3 Mexico
Chapter 10. Europe Pre-Engineered Buildings Market
- 10.1 Germany
- 10.2 France
- 10.3 Italy
- 10.4 United Kingdom
- 10.5 Spain
- 10.6 Poland
- 10.7 Russia
- 10.8 Netherlands
- 10.9 Belgium
- 10.10 Sweden
- 10.11 Denmark
- 10.12 Norway
- 10.13 Rest of Europe
Chapter 11. Asia Pacific Pre-Engineered Buildings Market
- 11.1 China
- 11.2 India
- 11.3 Japan
- 11.4 South Korea
- 11.5 Thailand
- 11.6 Indonesia
- 11.7 Vietnam
- 11.8 Malaysia
- 11.9 Australia
- 11.10 Rest of Asia Pacific
Chapter 12. Latin America Pre-Engineered Buildings Market
- 12.1 Brazil
- 12.2 Argentina
- 12.3 Colombia
- 12.4 Chile
- 12.5 Rest of Latin America
Chapter 13. Middle East Pre-Engineered Buildings Market
- 13.1 Saudi Arabia
- 13.2 United Arab Emirates
- 13.3 Turkey
- 13.4 Israel
- 13.5 Iran
- 13.6 Rest of the Middle East
Chapter 14. Africa Pre-Engineered Buildings Market
- 14.1 South Africa
- 14.2 Egypt
- 14.3 Nigeria
- 14.4 Morocco
- 14.5 Rest of Africa
Chapter 15. Pre-Engineered Buildings Company Profiles
- 15.1 [Company 01]
- 15.1.1 Company Overview
- 15.1.2 Key Management Personnel
- 15.1.3 Products & Services Portfolio
- 15.1.4 Financial Performance
- 15.1.5 Key Market Focus & Geographic Presence
- 15.1.6 Recent Developments & Strategic Initiatives
Note: The company profile list is preliminary and may change based on research findings, market developments, data availability, and client requirements.
Chapter 16. Appendices
- Appendix A – List of Abbreviations & Acronyms
- Appendix B – Industry Classification Code Reference – Full Series
- Appendix C – Supply, Output & Operating Capacity Data Tables
- Appendix D – End-Use & Demand Base Tables
- Appendix E – Demand, Adoption & Usage Assumptions
- Appendix F – Pricing & Revenue Metric Reference Tables
- Appendix G – Company Operations & Infrastructure Database
- Appendix H – Cross-Border Trade & Activity Data Tables (Where Applicable)
- Appendix I – Regulatory Summary Tables
- Appendix J – Primary Research Participant List (Anonymized)
- Appendix K – Primary Research Questionnaire Framework
- Appendix L – Data Sources & Bibliography
- Appendix M – Market Size Divergence & Source Comparison
Chapter 17. Research Methodology
- 17.1 Research Framework & Philosophy
- 17.2 Secondary Research – Sources, Hierarchy & Data Extraction
- 17.3 Data Modeling – Bottom-Up & Top-Down Market Sizing
- 17.4 Primary Research – Stakeholder Framework, LOI & Sample Sizes
- 17.5 Forecast Methodology – Regression, Scenario & Sensitivity Analysis
- 17.6 Quality Control – Four-Layer Validation Framework
- 17.7 Limitations & Standard Assumptions
- 17.8 Disclaimer
