
Market Overview
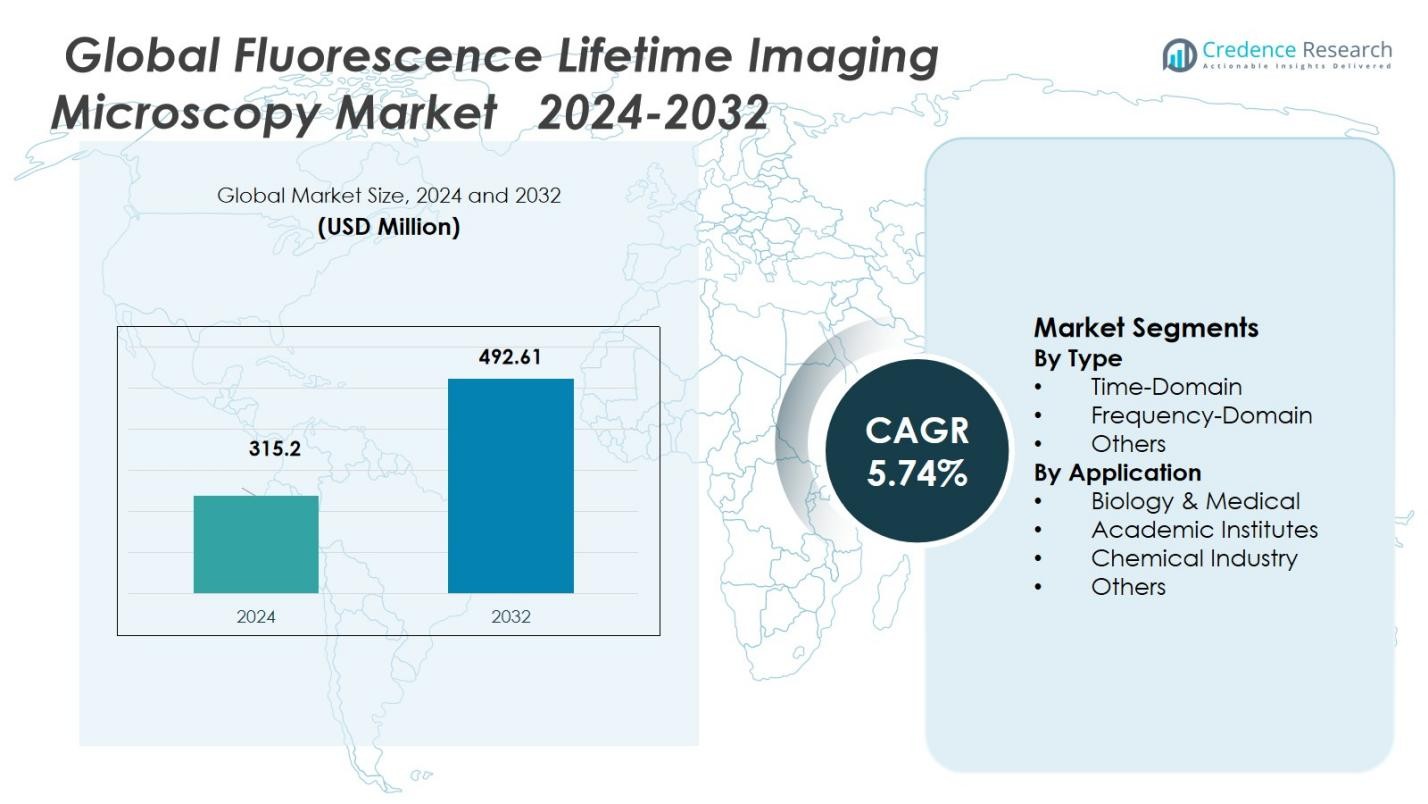
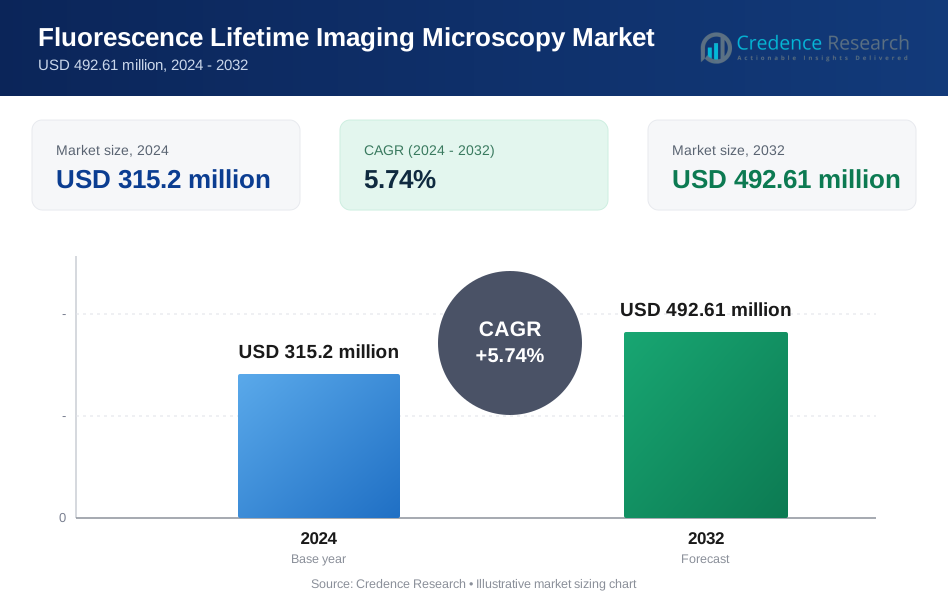
The global Fluorescence Lifetime Imaging Microscopy Market size was valued at USD 315.2 Million in 2024 and is anticipated to reach USD 492.61 Million by 2032, at a CAGR of 5.74% during the forecast period.
| REPORT ATTRIBUTE | DETAILS |
|---|---|
| Historical Period | 2020-2023 |
| Base Year | 2024 |
| Forecast Period | 2025-2032 |
| Fluorescence Lifetime Imaging Microscopy Market Size 2024 | USD 315.2 Million |
| Fluorescence Lifetime Imaging Microscopy Market, CAGR | 5.74% |
| Fluorescence Lifetime Imaging Microscopy Market Size 2032 | USD 492.61 Million |
Global Fluorescence Lifetime Imaging Microscopy Market includes leading players such as Leica Microsystems, Olympus Corporation, Nikon Corporation, Bruker Corporation and PicoQuant GmbH among others, which spearhead innovation and product development in FLIM technologies. These companies consistently expand their portfolios and enhance system sensitivity and imaging capabilities, driving global adoption across research, clinical, and industrial segments. The region of North America leads the market with a share of 35%, supported by strong research infrastructure, funding, and a high concentration of academic and healthcare institutions. Europe follows, underpinned by mature biotech and pharma sectors, while Asia‑Pacific emerges as a rapidly growing region with expanding research investments and increasing demand for advanced imaging platforms. This regional distribution underlines where demand and growth momentum are currently concentrated.
Market Insights
- The Global Fluorescence Lifetime Imaging Microscopy Market was valued at USD 315.2 million in 2024 and is projected to grow at a CAGR of 5.74%.
- Increasing adoption of FLIM systems in biomedical research and precision medicine drives demand, as institutions invest in advanced imaging for molecular diagnostics and cellular studies.
- Time‑Domain FLIM remains the dominant segment, capturing 60% of total market share, due to its superior temporal resolution and accurate lifetime measurement capabilities.
- The Biology & Medical application sub‑segment leads with 45% share, fueled by rising demand in oncology, neuroscience, and molecular biology research.
- North America commands a 35% regional share, supported by strong research infrastructure and funding; Europe and Asia‑Pacific follow, with Asia‑Pacific showing accelerating growth potential.
 Market Segmentation Analysis:
By Type
The Time‑Domain segment dominates the global Fluorescence Lifetime Imaging Microscopy (FLIM) market, holding 60% of the total market share. This dominance is attributed to the high temporal resolution and precision that Time‑Domain FLIM offers, particularly through methods like time‑correlated single photon counting (TCSPC). This technique’s ability to deliver high-quality data in cellular studies and molecular interaction analyses is crucial in various fields, including medical and biological research. The segment’s strength is driven by its capability to provide detailed lifetime measurements, making it the go‑to choice for applications requiring precise decay kinetics. This robust functionality continues to fuel the growth and preference of Time‑Domain FLIM in both academic and clinical settings.
- For instance, PicoQuant’s TCSPC‑based systems such as the MicroTime 200 have enabled sub‑50‑picosecond temporal precision, allowing researchers to resolve fast photophysical processes in live‑cell imaging.
By Application
The Biology & Medical application segment is the leading sector in the global FLIM market, capturing 45% of the total market share. This segment’s growth is largely driven by the increasing demand for advanced imaging technologies in cellular biology, molecular diagnostics, and oncology research. FLIM’s ability to offer non-invasive, high-resolution imaging has made it a key tool in understanding disease mechanisms at the molecular level. The expanding focus on precision medicine, coupled with rising healthcare expenditures and research funding, continues to propel FLIM’s adoption in medical research labs. Consequently, the Biology & Medical application segment remains the largest revenue generator for the market, contributing significantly to its overall expansion.
- For instance, Nikon Corporation’s NIS-Elements software, integrated with FLIM modules, allows researchers to quantify protein interactions within living cells—a feature widely used in cancer and neurobiology studies.
Key Growth Drivers
Technological Advancements and Enhanced System Usability
Advances in imaging hardware and software including improved detectors, faster acquisition electronics, and simplified user interfaces are significantly expanding the appeal of FLIM systems beyond highly specialized labs. These enhancements allow researchers and clinicians to capture high‑resolution lifetime data with greater ease and reliability, lowering the entry barrier for institutions that previously avoided FLIM due to complexity. As a result, this driver accelerates adoption across diverse settings, broadening the customer base and boosting overall market growth.
- For instance, Leica Microsystems integrated hybrid detectors (HyD S) in its STELLARIS platform to deliver higher photon detection efficiency and enable easier lifetime acquisition.
Rising Demand in Biomedical Research and Precision Medicine
Growing investments in biomedical research especially in molecular biology, oncology, neuroscience, and drug discovery are fueling demand for FLIM, given its capability to provide detailed information about molecular environments and interactions. As precision medicine, biomarker research, and personalized therapies become central to healthcare innovation, FLIM’s non‑invasive, high‑information imaging adds significant value. This surge in research activity and regulatory/medical interest directly supports expanding FLIM deployments in research institutes, hospitals, and pharmaceutical companies.
- For instance, Leica Microsystems integrated FLIM technology into its SP8 FALCON confocal platform, which has been adopted by several hospital research centers for live-cell metabolic imaging.
Increasing Research & Development Investments Worldwide
Global escalation in R&D budgets particularly in life sciences and pharmaceutical sectors is translating into greater acquisition of advanced microscopy tools. Institutions now more frequently allocate funds to cutting-edge imaging modalities, recognizing that detailed lifetime imaging can accelerate discoveries in cell biology, drug response, and molecular diagnostics. This influx of capital underpins procurement of FLIM systems, thereby driving overall market growth and enabling sustained long‑term expansion.
Key Trends & Opportunities
Integration of FLIM with Other Imaging Modalities
A notable trend is the merging of FLIM with complementary imaging techniques (e.g., confocal, multiphoton, super‑resolution, or other advanced microscopy) to enable multi‑dimensional, highly detailed biological analysis. This multimodal integration broadens FLIM’s applicability, allowing researchers to correlate lifetime data with structural or functional imaging. Such hybrid platforms can offer both spatial detail and molecular‑environment insight, opening opportunities in complex tissue imaging, multiplexed assays, and advanced diagnostics.
- For instance, Leica Microsystems integrated FLIM into its STELLARIS confocal platform to combine fluorescence lifetime and intensity data in real time, enhancing metabolic and FRET-based studies.
Advancements in Data Analysis - ML/DL and Phasor Approaches
Recent progress in computational methods particularly machine‑learning/deep‑learning (ML/DL) algorithms and phasor‑based lifetime data analysis is significantly improving FLIM data processing, accuracy, and usability. These tools can denoise noisy lifetime images, automate segmentation, and extract meaningful biological insights more efficiently, even from challenging or low‑photon samples. As analysis becomes more robust and user‑friendly, FLIM adoption expands in research labs that may lack deep fluorescence‑imaging expertise, creating new market potentials.
- For instance, Nikon Instruments integrated DL-based denoising in its NIS-Elements software, enabling real-time enhancement of lifetime images and improving signal-to-noise ratios in live-cell imaging.
Key Challenges
High Capital Expenditure and Cost Constraints
Acquisition of FLIM systems requires substantial capital investment, which remains a major barrier for many smaller research labs, academic institutions, or clinics operating under budget constraints. The high upfront cost including specialized detectors, pulsed lasers, and supporting electronics can delay or prevent adoption despite FLIM’s advantages. This cost barrier may slow penetration in emerging markets or under‑funded research settings.
Steep Learning Curve and Requirement for Specialized Expertise
Operating FLIM instruments and interpreting lifetime data demands specialized training and expertise. Many institutions lack personnel with the requisite background, leading to underutilization or sub‑optimal results. This steep learning curve can deter potential buyers and limit broader adoption across research and clinical environments, especially where resources for training or technical support are limited.
Regional Analysis
North America
North America holds a market share of 35% in the global FLIM market, making it the largest regional contributor. The region benefits from well-established biomedical research infrastructure, strong government and private funding for life sciences, and a high concentration of leading academic and healthcare institutions. These factors drive early adoption of advanced imaging modalities such as FLIM for oncology, neuroscience, and molecular diagnostics. The presence of major industry players and continuous research investments further support robust demand. Consequently, North America remains the primary revenue engine for global FLIM growth.
Europe
Europe commands a 30% share of the global FLIM market, making it the second-largest region. The region’s mature pharmaceutical and biotechnology sectors, strong research institutions across Germany, the United Kingdom, France, and other advanced economies, and supportive public research funding create favorable conditions for FLIM adoption. Growing interest in molecular biology, drug discovery, and clinical diagnostics fuels demand. European collaborative research programs and increasing integration of advanced imaging techniques into life-sciences studies ensure that FLIM continues to expand across both academic and industrial labs throughout the region.
Asia-Pacific
The Asia-Pacific region accounts for 35% of the FLIM market, emerging as a fast-growing regional market. Rapidly expanding investments in healthcare infrastructure, increasing research & development funding in life sciences, and growing interest in advanced imaging for disease diagnostics and biomedical research contribute to strong uptake. Countries such as China, India, Japan, and South Korea are investing in modern imaging modalities to support cancer research, neuroscience, and drug development. Rising demand across academic institutions, biotechnology firms, and healthcare providers positions Asia-Pacific as a critical growth frontier for FLIM.
Latin America
Latin America’s share of the global FLIM market remains modest, collectively under 10%. Market growth in this region is driven by emerging academic research, growing interest in molecular diagnostics, and gradual expansion of healthcare infrastructure. Although penetration of advanced imaging modalities is lower compared with developed regions, rising adoption in leading research centers and incremental investments in biotechnology and medical research create potential. Market uptake remains constrained by limited R&D budgets and comparatively lower institutional funding, but Latin America represents a nascent opportunity for FLIM deployment.
Middle East & Africa
The Middle East & Africa region holds a small but growing share of the global FLIM market, similarly under 10%. Growth is fueled by rising healthcare expenditures, increased focus on biomedical research in select countries, and expanding interest in advanced diagnostic and research capabilities. Adoption remains limited outside major urban and research centers due to constrained funding and lower penetration of high-end imaging modalities. Nevertheless, growing demand for cancer diagnostics, collaborative research projects, and rising investments in life sciences infrastructure offer a pathway for gradual expansion of FLIM usage in the region.
Market Segmentations:
By Type
- Time-Domain
- Frequency-Domain
- Others
By Application
- Biology & Medical
- Academic Institutes
- Chemical Industry
- Others
By Geography
- North America
- U.S.
- Canada
- Mexico
- Europe
- Germany
- France
- U.K.
- Italy
- Spain
- Rest of Europe
- Asia Pacific
- China
- Japan
- India
- South Korea
- South-east Asia
- Rest of Asia Pacific
- Latin America
- Brazil
- Argentina
- Rest of Latin America
- Middle East & Africa
- GCC Countries
- South Africa
- Rest of the Middle East and Africa
Competitive Landscape
The competitive landscape of the global Fluorescence Lifetime Imaging Microscopy (FLIM) market features key players such as Leica Microsystems, Olympus Corporation, Carl Zeiss AG, Bruker Corporation, and PicoQuant GmbH who lead technology innovation and market penetration. These firms continuously expand their product portfolios by launching advanced FLIM systems with improved lifetime resolution, sensitivity, and user‑friendly interfaces. They also invest in R&D to integrate FLIM with complementary imaging modalities, strengthening their competitive edge. The market remains moderately concentrated, with these leaders commanding significant share, while smaller niche players and new entrants compete on specialized features or regional coverage. Competitive dynamics are shaped by technological differentiation, strategic collaborations, and service/support capabilities. As FLIM adoption grows across academic, clinical, and industrial segments, competition is expected to intensify around innovation, cost‑effectiveness, and global distribution networks.
Key Player Analysis
- Vienna BioCenter
- Renishaw Plc
- Teledyne Digital Imaging US, Inc.
- PicoQuant GmbH
- SIMTRUM Pte. Ltd.
- Leica Microsystems GmbH
- Scitech Pty Ltd
- Becker & Hickl GmbH
- CompareNetworks, Inc. (Labcompare)
- IBIDI GMBH
Recent Developments
- In March 2025 PicoQuant introduced NovaISM, a new software for FLIM and Image Scanning Microscopy (ISM) that enhances spatial resolution and contrast when used with their Luminosa microscope.
- In June 2024, HORIBA Scientific launched its new InverTau™ platform — a confocal FLIM system that adds high-speed laser scanning, pulsed‑laser excitation, and single-photon counting detectors to conventional inverted microscopes, enhancing FLIM accessibility for diverse lab setups.
- In August 2025, Leica Microsystems formed a strategic distribution partnership with Fisher Scientific to broaden commercial reach across EMEA, potentially widening access to FLIM and other microscopy instruments in academic and clinical markets.
Report Coverage
The research report offers an in-depth analysis based on Type, Application and Geography. It details leading market players, providing an overview of their business, product offerings, investments, revenue streams, and key applications. Additionally, the report includes insights into the competitive environment, SWOT analysis, current market trends, as well as the primary drivers and constraints. Furthermore, it discusses various factors that have driven market expansion in recent years. The report also explores market dynamics, regulatory scenarios, and technological advancements that are shaping the industry. It assesses the impact of external factors and global economic changes on market growth. Lastly, it provides strategic recommendations for new entrants and established companies to navigate the complexities of the market.
Future Outlook
- The global Fluorescence Lifetime Imaging Microscopy (FLIM) market is likely to see robust expansion as more biomedical and life‑science researchers adopt FLIM for advanced cellular and molecular studies.
- Growing demand for precision‑medicine applications and molecular diagnostics will further drive uptake of FLIM systems in hospitals, academic labs, and biotech firms.
- Integration of FLIM with complementary imaging technologies (e.g., multiphoton microscopy, super‑resolution microscopy) will unlock new use cases, broadening application scope beyond traditional cell biology.
- Improvements in data‑analysis workflows — including machine‑learning/deep‑learning based denoising and phasor‑based lifetime analysis — will make FLIM more user‑friendly and accessible even to labs with limited imaging expertise.
- Development of compact, modular, or lower-cost FLIM systems will lower entry barriers, encouraging adoption among smaller academic institutions and emerging biotech firms.
- Expanding R&D investments from pharmaceutical and biotech companies will drive demand for FLIM in drug discovery, high-content screening, and biomarker research.
- Growth in emerging economies especially in Asia-Pacific will offer new geographic markets as research funding and healthcare infrastructure improve in those regions.
- Wider use of FLIM for metabolic imaging (e.g., autofluorescent biomarkers) and tissue‑level diagnostics will open opportunities in clinical research and translational medicine.
- Increasing collaborations between instrument manufacturers, academic institutions and pharmaceutical companies will accelerate innovation and help tailor FLIM solutions for specialized applications.
- As adoption broadens, demand for support services training, maintenance, data analysis will rise, creating ancillary markets around FLIM.
Request a Free Sample
Fill in your details and we'll send you a free sample report.
- Sample data tables & charts
- Research methodology
Need a Custom Version of This Report?
Tailor the scope, geography, or segments to your exact requirements.
- Custom geography or segment scope
- Direct access to our analyst team
Frequently Asked Questions
What is the current market size for the Global Fluorescence Lifetime Imaging Microscopy Market, and what is its projected size in 2032?
At what Compound Annual Growth Rate is the Global Fluorescence Lifetime Imaging Microscopy Market projected to grow between 2025 and 2032?
Which Global Fluorescence Lifetime Imaging Microscopy Market segment held the largest share in 2024?
What are the primary factors fueling the growth of the Global Fluorescence Lifetime Imaging Microscopy Market?
Who are the leading companies in the Global Fluorescence Lifetime Imaging Microscopy Market?
Which region commanded the largest share of the Global Fluorescence Lifetime Imaging Microscopy Market in 2024?
Table of Content
Chapter 1. Report Introduction
- 1.1 Report Description & Purpose
- 1.1.1 Report Title & Market Definition
- 1.1.2 Unique Selling Propositions (USP) & Key Differentiators
- 1.1.3 Value Proposition for Stakeholders
- 1.2 Research Objectives
- 1.2.1 Market Sizing Objectives (Volume & Revenue)
- 1.2.2 Segmentation Objectives
- 1.2.3 Competitive Intelligence Objectives
- 1.2.4 Forecast & Scenario Objectives
- 1.3 Report Scope
- 1.3.1 Fluorescence Lifetime Imaging Microscopy Scope – Types & Subtypes Covered
- 1.3.2 Geographic Scope – Regions & Countries Covered
- 1.3.3 Historical Period, Base Year & Forecast Period (2024; forecast to 2032)
- 1.3.4 Inclusions & Exclusions
- 1.4 HS Code & Classification Framework
- 1.5 Currency, Units & Pricing Basis
- 1.6 Target Stakeholders
- 1.7 Limitations & Assumptions
Chapter 2. Executive Summary
- 2.1 Global Fluorescence Lifetime Imaging Microscopy Market Snapshot
- 2.1.1 Market Size – Historical (2024) & Forecast (2024-2032) (2024: USD 315.2 million → 2032: USD 492.61 million)
- 2.1.2 Volume & Revenue – Global Totals
- 2.1.3 Key Market Highlights – Top Five Facts
- 2.2 Fluorescence Lifetime Imaging Microscopy Market Segmentation Snapshot
- 2.2.1 Market Split by Region – 2024 vs. 2032
- 2.3 Competitive Snapshot
- 2.3.1 Top 10 Players by Revenue Share – 2024
- 2.3.2 Top 10 Players by Volume Share – 2024
- 2.3.3 Recent Strategic Developments (18-Month Summary)
- 2.4 Key Investment Highlights & Strategic Conclusions
Chapter 3. Fluorescence Lifetime Imaging Microscopy Market Dynamics & Industry Analysis
- 3.1 Market Overview & Context
- 3.1.1 Fluorescence Lifetime Imaging Microscopy Market Position in the Broader Automotive Value Chain
- 3.1.2 OEM vs. Replacement Market Dynamics
- 3.1.3 Market Maturity & Development Stage by Region
- 3.2 Fluorescence Lifetime Imaging Microscopy Market Drivers
- 3.3 Fluorescence Lifetime Imaging Microscopy Market Restraints & Challenges
- 3.4 Fluorescence Lifetime Imaging Microscopy Market Opportunities
- 3.5 Porter's Five Forces Analysis
- 3.5.1 Threat of New Entrants
- 3.5.2 Bargaining Power of Suppliers
- 3.5.3 Bargaining Power of Buyers
- 3.5.4 Threat of Substitutes
- 3.5.5 Competitive Rivalry – Intensity Assessment
- 3.6 Fluorescence Lifetime Imaging Microscopy Value Chain Analysis
- 3.6.1 Upstream – Raw Material/Input Suppliers
- 3.6.1.1 Raw Material/Input 1
- 3.6.1.2 Raw Material/Input 2
- 3.6.1.3 Raw Material/Input 3
- 3.6.2 Midstream – Production/Manufacturing/Service Delivery
- 3.6.2.1 Production/Process Overview
- 3.6.2.2 Key Facility Locations & Capacity by Manufacturer
- 3.6.3 Downstream – Distribution & End Consumer
- 3.6.3.1 Primary Channel – B2B/OEM
- 3.6.3.2 Secondary Channels – Dealer, Retail, Online, Direct
- 3.6.4 Value Chain Profitability Analysis
- 3.6.1 Upstream – Raw Material/Input Suppliers
- 3.7 PESTEL Analysis
- 3.7.1 Political Factors
- 3.7.2 Economic Factors
- 3.7.3 Social Factors
- 3.7.4 Technological Factors
- 3.7.5 Environmental Factors
- 3.7.6 Legal Factors
- 3.8 Fluorescence Lifetime Imaging Microscopy Supply Chain Analysis
- 3.8.1 Raw Material/Input Supply Risk Assessment
- 3.8.2 Manufacturing Concentration Risk (Geographic Exposure)
- 3.8.3 Trade Disruption Impact Analysis
- 3.9 Regulatory & Policy Landscape
Note: The regulatory and policy landscape section covers regulations based on their applicability to the market, Fluorescence Lifetime Imaging Microscopy category, geography, and scope of the study. Only regulatory frameworks with a material impact on operations, compliance, trade, sustainability, or market access are analyzed in detail.
Chapter 4. Key Investment Pockets & Opportunity Analysis
- 4.1 Fluorescence Lifetime Imaging Microscopy Market Attractiveness Analysis
- 4.1.1 By Region – Investment Attractiveness Matrix (Volume × CAGR)
- 4.2 Absolute Revenue Growth Opportunity
- 4.2.1 By Region – Absolute USD Growth Through 2032
- 4.3 Incremental Volume Opportunity
- 4.3.1 By Region – Incremental Volume Through 2032
- 4.3.2 Segment – Incremental Volume
- 4.4 Emerging Submarket Opportunity Deep Dive (Subject to Applicability)
- 4.5 Emerging Market Opportunity Scorecards
- 4.5.1 United States
- 4.5.2 Europe
- 4.5.3 Asia
- 4.5.4 Middle East & Africa
Note: Emerging Market Opportunity Scorecards will be included based on relevance and strategic importance. Regions listed are indicative and may vary depending on data availability and market dynamics.
Chapter 5. Fluorescence Lifetime Imaging Microscopy Import-Export Analysis & Trade Flows
- 5.1 Global Trade Overview
- 5.1.1 Global Export Value by Country (2024)
- 5.1.2 Global Export Volume by Country (2024)
- 5.1.3 Global Import Value by Country (2024)
- 5.1.4 Global Import Volume by Country (2024)
- 5.1.5 Net Trade Balance by Country (2024)
- 5.2 Export Analysis – Segment
- 5.2.1 Type 1 (HS Code)
- 5.2.2 Type 2 (HS Code)
- 5.2.3 Type 3 (HS Code)
- 5.2.4 Type 4 (HS Code)
- 5.2.5 Type 5 (HS Code)
- 5.3 Import Analysis – Segment
- 5.3.1 Type 1 (HS Code)
- 5.3.2 Type 2 (HS Code)
- 5.3.3 Type 3 (HS Code)
- 5.3.4 Type 4 (HS Code)
- 5.3.5 Type 5 (HS Code)
- 5.4 Average Unit Trade Prices
- 5.4.1 Average Export Price – Segment & Country
- 5.4.2 Average Import Price – Segment & Source Country
- 5.4.3 Price Trends (2024)
- 5.5 Key Trade Route Analysis
- 5.5.1 Trade Route 1
- 5.5.2 Trade Route 2
- 5.5.3 Trade Route 3
- 5.5.4 Trade Route 4
- 5.5.5 Trade Route 5
- 5.6 Trade Policy Impact Assessment
- 5.6.1 US Anti-Dumping & Section 301 Tariffs
- 5.6.2 EU Customs Union Impact
- 5.6.3 Major Free Trade Agreements
- 5.6.4 USMCA Rules of Origin
Note: Trade policy analysis will be included only where relevant to the Fluorescence Lifetime Imaging Microscopy market.
Chapter 6. Competitive Landscape & Company Benchmarking
- 6.1 Fluorescence Lifetime Imaging Microscopy Market Concentration & Structure
- 6.1.1 Herfindahl-Hirschman Index (HHI) – vs. 2024
- 6.1.2 Tier 1, Tier 2 & Tier 3 Market Structure
- 6.1.3 Global, Regional & Local Player Dynamics
- 6.2 Fluorescence Lifetime Imaging Microscopy Market Share Analysis – 2024
- 6.2.1 Global Revenue Share by Company
- 6.2.2 Global Volume Share by Company
- 6.2.3 Regional Revenue Share
- 6.2.4 Market Share Evolution ( vs. 2024)
- 6.2.5 OEM Segment Share by Company
- 6.2.6 Replacement Segment Share by Company
- 6.3 Production/Delivery Capacity & Facility Analysis
- 6.3.1 Global Installed Capacity
- 6.3.2 Capacity Utilization Rates
- 6.3.3 Production/Output Volume
- 6.3.4 Facility Locations & Capacity Map
- 6.3.5 Planned Capacity Additions
- 6.4 Fluorescence Lifetime Imaging Microscopy Competitive Benchmarking Matrix
- 6.4.1 Revenue, Volume, CAGR & Profitability Comparison
- 6.4.2 Channel Revenue Mix
- 6.4.3 Geographic Revenue Exposure
- 6.4.4 R&D Intensity
- 6.4.5 Sustainability Maturity
- 6.5 Strategic Developments in Fluorescence Lifetime Imaging Microscopy (Last 24 Months)
- 6.5.1 Mergers, Acquisitions & Divestments
- 6.5.2 New Fluorescence Lifetime Imaging Microscopy Launches
- 6.5.3 Facility Expansions
- 6.5.4 Strategic Alliances, Joint Ventures & Partnerships
- 6.5.5 Distribution Expansion & Market Entry
- 6.5.6 Sustainability & ESG Initiatives
- 6.6 Competitive Strategy Mapping
- 6.6.1 Leader, Challenger, Follower & Niche Classification
- 6.6.2 Pricing Strategy Comparison
- 6.6.3 Channel Strategy Matrix
Note: Strategic developments are included based on their materiality and the availability of reliable information.
Chapter 7. Global Fluorescence Lifetime Imaging Microscopy Market – By Distribution Channel
- 7.1 Segment Overview
- 7.1.1 Volume & Revenue Split by Channel (2024 & 2032)
- 7.1.2 Channel Mix Evolution (2024-2032)
Chapter 8. Regional Market Analysis – Global Overview
- 8.1 Global Regional Overview
- 8.1.1 Regional Volume Share
- 8.1.2 Regional Revenue Share
- 8.1.3 Regional Volume by Region
- 8.1.4 Regional Revenue by Region
- 8.1.5 Regional Forecast Through 2032
- 8.2 Cross-Regional Segment Analysis
- 8.2.1 By Distribution Channel
- 8.2.2 By Brand/Price Tier
Chapter 9. North America Fluorescence Lifetime Imaging Microscopy Market
- 9.1 United States
- 9.2 Canada
- 9.3 Mexico
Chapter 10. Europe Fluorescence Lifetime Imaging Microscopy Market
- 10.1 Germany
- 10.2 France
- 10.3 Italy
- 10.4 United Kingdom
- 10.5 Spain
- 10.6 Poland
- 10.7 Russia
- 10.8 Netherlands
- 10.9 Belgium
- 10.10 Sweden
- 10.11 Denmark
- 10.12 Norway
- 10.13 Rest of Europe
Chapter 11. Asia Pacific Fluorescence Lifetime Imaging Microscopy Market
- 11.1 China
- 11.2 India
- 11.3 Japan
- 11.4 South Korea
- 11.5 Thailand
- 11.6 Indonesia
- 11.7 Vietnam
- 11.8 Malaysia
- 11.9 Australia
- 11.10 Rest of Asia Pacific
Chapter 12. Latin America Fluorescence Lifetime Imaging Microscopy Market
- 12.1 Brazil
- 12.2 Argentina
- 12.3 Colombia
- 12.4 Chile
- 12.5 Rest of Latin America
Chapter 13. Middle East Fluorescence Lifetime Imaging Microscopy Market
- 13.1 Saudi Arabia
- 13.2 United Arab Emirates
- 13.3 Turkey
- 13.4 Israel
- 13.5 Iran
- 13.6 Rest of the Middle East
Chapter 14. Africa Fluorescence Lifetime Imaging Microscopy Market
- 14.1 South Africa
- 14.2 Egypt
- 14.3 Nigeria
- 14.4 Morocco
- 14.5 Rest of Africa
Chapter 15. Fluorescence Lifetime Imaging Microscopy Company Profiles
- 15.1 [Company 01]
- 15.1.1 Company Overview
- 15.1.2 Key Management Personnel
- 15.1.3 Products & Services Portfolio
- 15.1.4 Financial Performance
- 15.1.5 Key Market Focus & Geographic Presence
- 15.1.6 Recent Developments & Strategic Initiatives
Note: The company profile list is preliminary and may change based on research findings, market developments, data availability, and client requirements.
Chapter 16. Appendices
- Appendix A – List of Abbreviations & Acronyms
- Appendix B – Industry Classification Code Reference – Full Series
- Appendix C – Production & Capacity Data Tables
- Appendix D – End-Use & Demand Base Tables
- Appendix E – Consumption & Replacement Rate Assumptions
- Appendix F – ASP Reference Tables
- Appendix G – Manufacturing & Facility Database
- Appendix H – Import-Export Data Tables
- Appendix I – Regulatory Summary Tables
- Appendix J – Primary Research Participant List (Anonymized)
- Appendix K – Primary Research Questionnaire Framework
- Appendix L – Data Sources & Bibliography
- Appendix M – Market Size Divergence & Source Comparison
Chapter 17. Research Methodology
- 17.1 Research Framework & Philosophy
- 17.2 Secondary Research – Sources, Hierarchy & Data Extraction
- 17.3 Data Modeling – Bottom-Up & Top-Down Market Sizing
- 17.4 Primary Research – Stakeholder Framework, LOI & Sample Sizes
- 17.5 Forecast Methodology – Regression, Scenario & Sensitivity Analysis
- 17.6 Quality Control – Four-Layer Validation Framework
- 17.7 Limitations & Standard Assumptions
- 17.8 Disclaimer
