
Cell Invasion and Migration Assays Market Overview:
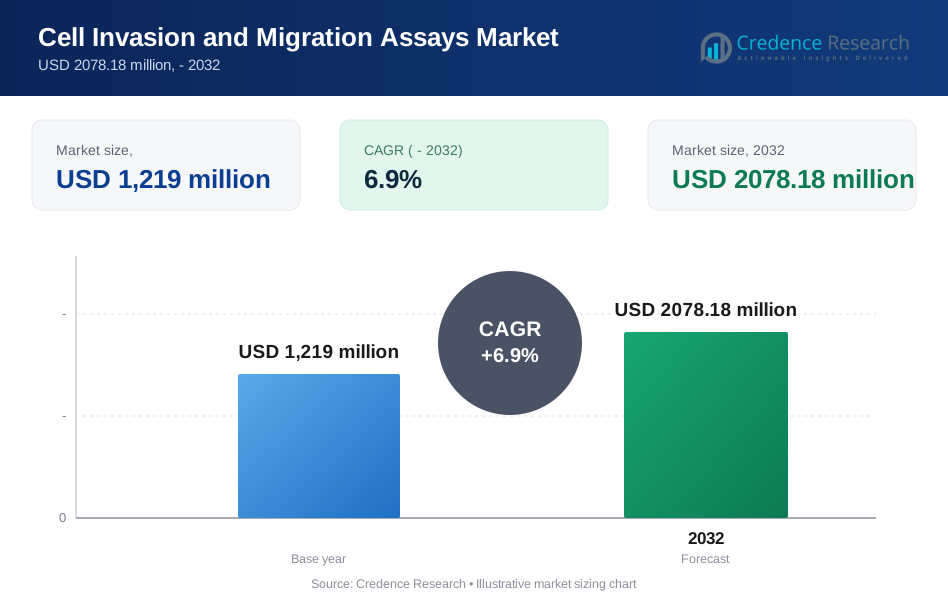
Cell invasion and migration assays Market was valued at USD 1219 million in 2024 and is anticipated to reach USD 2078.18 million by 2032, growing at a CAGR of 6.9% during the forecast period.
| REPORT ATTRIBUTE | DETAILS |
|---|---|
| Historical Period | 2020-2023 |
| Base Year | 2024 |
| Forecast Period | 2025-2032 |
| Cell Invasion and Migration Assays Market Size 2024 | USD 1219 million |
| Cell Invasion and Migration Assays Market, CAGR | 6.9% |
| Cell Invasion and Migration Assays Market Size 2032 | USD 2078.18 million |
Cell Invasion and Migration Assays Market Insights
- Demand rises as cancer research expands, with cell migration assays holding the largest segment share due to wide use in metastasis and drug-response studies.
- Key trends include rapid adoption of 3D matrices, live-cell imaging, and microfluidic platforms that improve accuracy and real-time tracking of cell behavior.
- The market remains competitive with Sigma-Aldrich, Corning, BD Biosciences, Thermo Fisher Scientific, and Lonza leading through advanced kits, imaging systems, and automation.
- North America leads with 39% share in 2024 due to strong oncology funding, while Asia Pacific grows fastest as biopharma activity rises and CRO adoption accelerates.
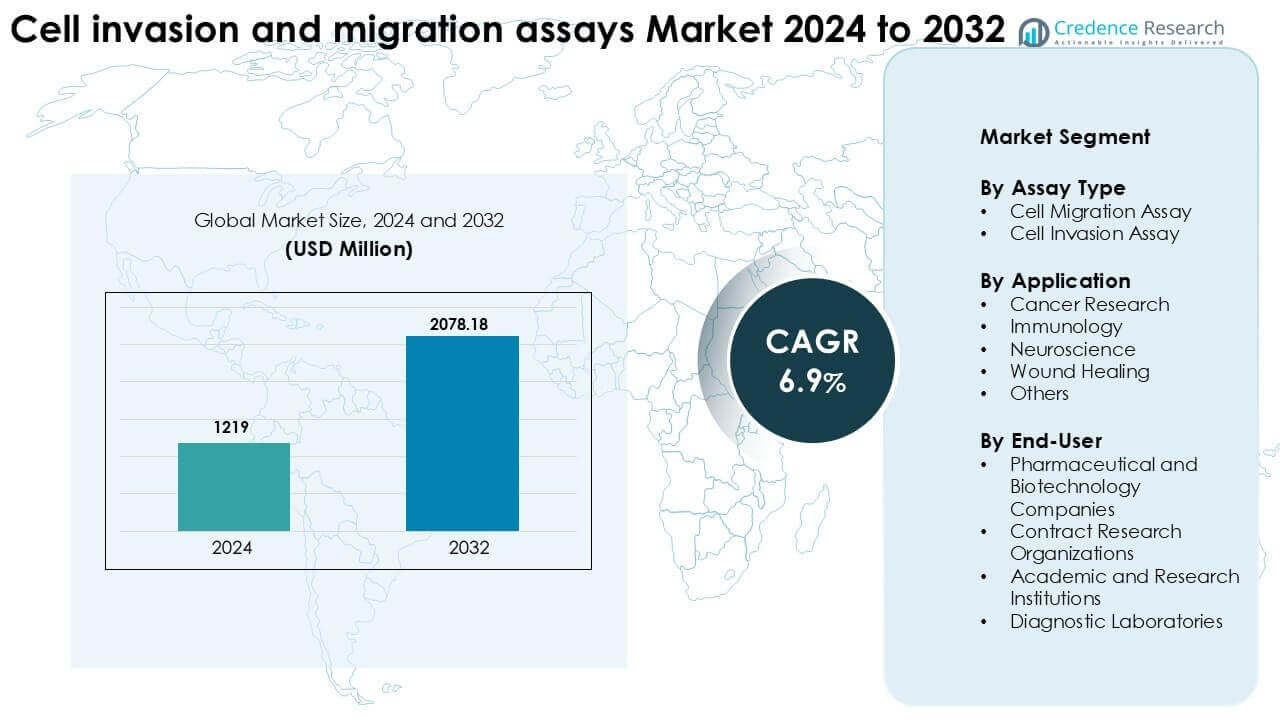
Market Segmentation Analysis:
By Assay Type
Cell migration assays lead this segment with around 56% share in 2024. Researchers prefer migration assays due to simple workflows, fast results, and broad fit in oncology and wound-healing studies. Strong use in screening metastatic behavior further lifts demand. Cell invasion assays grow steadily as 3D matrices and advanced extracellular-matrix models gain traction. Rising investment in precision oncology and increasing adoption of high-content imaging platforms support both assay categories.
- For instance, Corning’s Transwell migration and invasion systems use standardized inserts with pore sizes of 3.0 µm and 8.0 µm and are available in 24-well and 96-well formats, enabling parallel testing of dozens of compounds in a single run.
By Application
Cancer research dominates with nearly 48% share in 2024, driven by rising studies on metastasis, drug resistance, and tumor–microenvironment interactions. The strong pipeline of targeted therapies increases demand for high-throughput invasion and migration models. Immunology gains momentum as cell trafficking and immune-cell activation studies expand. Neuroscience and wound healing applications grow as labs adopt advanced real-time tracking tools and 3D culture models for regenerative studies.
- For instance, PerkinElmer’s Operetta CLS high-content imaging system supports automated acquisition from up to 384 wells per plate and analyzes hundreds of individual cells per well, enabling large-scale cancer migration and invasion screens.
By End-User
Pharmaceutical and biotechnology companies lead with close to 52% share in 2024 due to heavy investment in oncology drug development and preclinical screening. These companies rely on standardized assays to validate compound behavior and reduce early-stage failures. Academic and research institutions show steady growth as grant-funded cancer and immunology projects increase. Contract research organizations expand their share by offering assay outsourcing, while diagnostic laboratories adopt these tools for research-oriented applications.
Key Growth Drivers
Rising Oncology Research and Focus on Metastasis Biology
Cancer studies fuel strong demand for cell invasion and migration assays as researchers work to understand metastatic progression and evaluate anti-metastatic drugs. Across research labs and clinical development programs, these assays help map tumor cell movement, EMT behavior, and drug response under controlled in-vitro conditions. The rapid growth of targeted therapies and immuno-oncology increases the need for models that reflect real tumor–microenvironment interactions. Advancements such as high-content imaging, 3D extracellular-matrix platforms, and real-time tracking systems further enhance assay reliability. Pharmaceutical companies use these assays to screen large compound libraries, while academic labs rely on them to explore pathways linked with metastasis. Rising global cancer incidence strengthens long-term adoption.
- For instance, Corning Incorporated produces Corning® BioCoat™ Matrigel® Invasion Chambers for metastasis research, specifically to study the invasive potential of tumor cells. pounds per plate. The Matrigel matrix contains over 100 ECM proteins, closely mimicking basement-membrane composition for reliable EMT and invasion studies.
Expansion of Immunology and Cell-Based Therapeutics Research
Demand grows as immunology labs use invasion and migration assays to study immune-cell trafficking, inflammation pathways, and T-cell behavior. The rise of cell-based therapies such as CAR-T, NK-cell therapies, and macrophage-modulating drugs increases the need for validated platforms that track immune-cell movement toward target cells. These assays support mechanism-of-action studies, cytokine-driven migration assessment, and optimization of engineered immune cells. Researchers also use these tools to evaluate disease models for autoimmune disorders and chronic inflammatory conditions. As global investments in immunotherapy rise, adoption expands across pharmaceutical companies, CROs, and academic institutes.
- For instance, BD Biosciences enables immune-cell migration studies using BD Falcon™ Cell Culture Inserts with transparent PET membranes offered in 3 µm and 5 µm pore sizes optimized for lymphocytes and monocytes. The 24-well system supports volumes of up to 0.8 mL per insert and allows tracking of more than 100,000 immune cells per condition. These inserts are routinely paired with flow cytometry panels exceeding 18 parameters to quantify migrated CAR-T and NK cell populations with high reproducibility.
Adoption of Advanced 3D Models and High-Throughput Screening Platforms
Advanced 3D matrices, organoids, and microfluidic systems push demand for high-precision invasion and migration assays. These models replicate physiological environments better than traditional 2D assays, giving researchers more relevant insights. High-throughput screening (HTS) setups allow fast testing of thousands of compounds, reducing preclinical timelines and improving decision-making. Automated imaging, AI-driven analytics, and label-free tracking enhance data accuracy. Pharmaceutical developers adopt these integrated systems to improve predictive outcomes and reduce attrition in early drug discovery. As labs move toward more reproducible and scalable solutions, modern technologies act as major growth accelerators.
Key Trends & Opportunities
Shift Toward Real-Time, Live-Cell Imaging Systems
A major trend involves rapid adoption of real-time imaging tools that track cell motion continuously. These systems provide dynamic data instead of endpoint measurements, helping researchers detect subtle behavioral changes in drug-exposed or genetically modified cells. Growing integration of AI-powered analytics, automated image segmentation, and kinetic modeling unlocks deeper insights into invasion patterns. Companies developing live-cell imaging equipment see strong collaboration opportunities with assay kit manufacturers. This trend creates room for innovation in software-driven quantification, high-resolution imaging workflows, and cloud-based data processing.
- For instance, Sartorius supports live invasion and migration studies through the IncuCyte® Live-Cell Analysis System, which captures phase-contrast and fluorescence images at intervals as short as 15 minutes inside a 37 °C, 5 % CO₂ incubator environment. The platform supports standard 24- and 96-well invasion assay formats and enables continuous monitoring of thousands of cells per well. Built-in analysis algorithms quantify wound width, cell confluence, and migration distance in micrometers over multi-day experiments.
Growing Use of Organoids, Spheroids, and Microfluidic Devices
Organoids and spheroids provide near-physiological environments that improve accuracy for invasion and migration testing. As labs shift from 2D models to complex 3D structures, assay developers gain opportunities to introduce specialized matrices, hydrogels, and ECM-based tools. Microfluidic “lab-on-chip” platforms add further precision by simulating gradients, shear forces, and tissue barriers. These advancements attract interest from pharma and academia due to improved replicability and reduced reliance on animal models. The trend supports growth in personalized drug testing, cancer metastasis modeling, and immune-cell behavior studies.
- For instance, Typical seeding densities for spheroid formation often range from a few hundred to several thousand cells (e.g., 500 to 10,000) to control size. Spheroids are frequently embedded in ECM matrices like Corning® Matrigel® for 3D invasion and migration analysis.
Increasing Outsourcing to CROs for High-Complexity Assays
Pharmaceutical companies and biotech firms outsource advanced invasion and migration studies to CROs to reduce costs and accelerate timelines. CROs offer expertise in assay optimization, high-content imaging, and multi-parametric data analysis, making them ideal partners for complex studies. Growing volumes of oncology and immunology pipelines drive long-term outsourcing demand. This creates opportunities for CROs to expand service portfolios, integrate automation, and develop specialized platforms for 3D invasion models and immune-cell migration assays.
Key Challenges
Limited Standardization and High Variability Across Assay Platforms
A major challenge is the lack of uniform protocols across laboratories, which creates variability in results. Differences in matrices, cell density, reagent composition, and imaging methods reduce reproducibility. This affects drug-screening outcomes and complicates comparison across studies. Assay developers must address this by improving consistency, offering standardized reagent kits, and integrating automated systems that minimize user-dependent variation. Regulatory expectations for reproducible preclinical data increase pressure on labs and suppliers to adopt stricter standards.
High Cost of Advanced Systems and Technical Expertise Requirements
Modern 3D matrices, microfluidic platforms, and high-content imaging systems remain costly for smaller research labs. Skilled personnel are needed to run advanced assays and interpret complex datasets. This raises operational barriers and slows adoption in low-budget academic settings or emerging markets. Maintenance costs and instrument calibration add further pressure. Vendors are working on cost-efficient platforms and integrated software to widen access, but affordability remains a constraint for broad global adoption.
Regional Analysis
North America
North America leads the Cell Invasion and Migration Assays Market with about 39% share in 2024. Strong funding for cancer research, broad use of high-content imaging systems, and significant adoption of 3D assay platforms drive regional dominance. The U.S. holds most of the share due to large pharmaceutical pipelines and extensive academic research output. Rising investment in immunotherapy and precision oncology further supports adoption. Canada adds steady growth through government-supported clinical research programs and biotech expansion. High availability of automated assay instruments and well-established CRO networks strengthens long-term market growth across the region.
Europe
Europe holds nearly 28% share in 2024, supported by strong oncology research programs and active collaboration between universities, CROs, and pharmaceutical companies. Germany, the U.K., and France drive most demand due to advanced laboratory infrastructure and high uptake of live-cell imaging tools. EU-backed cancer initiatives encourage adoption of 3D invasion models and microfluidic platforms. Growing interest in immune-cell migration studies and regenerative medicine strengthens regional demand. Regulatory emphasis on reproducibility and data quality boosts use of standardized assay kits and automated platforms, sustaining Europe’s steady expansion in this market.
Asia Pacific
Asia Pacific accounts for around 23% share in 2024 and represents the fastest-growing regional market. Strong expansion in biopharmaceutical manufacturing, increased funding for cancer and immunology research, and rapid adoption of advanced cell-based assays drive growth. China leads due to rising oncology pipelines and heavy investment in high-throughput screening infrastructure. India, Japan, and South Korea show strong uptake as research institutes adopt 3D culture systems and microfluidic tools. Growing CRO activity, cost-efficient research operations, and increasing clinical studies strengthen long-term opportunities across the region.
Latin America
Latin America holds close to 6% share in 2024, supported by growing academic research capacity and expanding biotechnology activity in Brazil, Mexico, and Argentina. Adoption rises as universities incorporate live-cell imaging and advanced assay kits into cancer and immunology studies. Pharmaceutical companies increasingly partner with local CROs for early-stage screening tasks. Limited laboratory infrastructure slows high-end platform adoption, but rising investment in oncology research and training programs improves long-term prospects. Government-backed health research initiatives help expand demand for standardized migration and invasion assays across the region.
Middle East & Africa
The Middle East & Africa region captures about 4% share in 2024, with growth driven by increasing investment in research infrastructure and expanding clinical studies in Gulf countries. The UAE and Saudi Arabia lead due to new cancer research centers and wider adoption of cell-based assay systems in academic institutions. Africa shows gradual demand led by South Africa’s growing biomedical research efforts. Limited access to high-end imaging systems restricts broader adoption, but rising collaboration with global pharma and research organizations enhances future opportunities for advanced invasion and migration assay use.
Cell Invasion and Migration Assays Market Segmentations:
By Assay Type
- Cell Migration Assay
- Cell Invasion Assay
By Application
- Cancer Research
- Immunology
- Neuroscience
- Wound Healing
- Others
By End-User
- Pharmaceutical and Biotechnology Companies
- Contract Research Organizations
- Academic and Research Institutions
- Diagnostic Laboratories
By Geography
- North America
- U.S.
- Canada
- Mexico
- Europe
- Germany
- France
- U.K.
- Italy
- Spain
- Rest of Europe
- Asia Pacific
- China
- Japan
- India
- South Korea
- South-east Asia
- Rest of Asia Pacific
- Latin America
- Brazil
- Argentina
- Rest of Latin America
- Middle East & Africa
- GCC Countries
- South Africa
- Rest of the Middle East and Africa
Competitive Landscape
The Cell Invasion and Migration Assays Market features strong competition led by companies such as Sigma-Aldrich, Corning Incorporated, BD Biosciences, Abcam, Lonza, Promega Corporation, PerkinElmer, Cell Biolabs, Agilent Technologies, and Thermo Fisher Scientific. These players focus on developing advanced assay kits, 3D matrices, microfluidic platforms, and automated imaging tools to support oncology and immunology research. Many companies expand their portfolios through product launches, strategic partnerships, and technology upgrades, especially in high-content screening and AI-driven analysis. Suppliers also invest in standardized assays to improve reproducibility across laboratories. Growing demand from pharmaceutical companies, CROs, and academic institutions encourages firms to offer scalable, high-throughput solutions. Asia Pacific’s rapid research growth and outsourcing strength create new expansion opportunities, pushing global players to strengthen distribution networks and enhance technical support services across emerging markets.
Key Player Analysis
- Sigma-Aldrich
- Corning Incorporated
- BD Biosciences
- Abcam
- Lonza
- Promega Corporation
- PerkinElmer
- Cell Biolabs
- Agilent Technologies
- Thermo Fisher Scientific
Recent Developments
- In December 2025, Agilent released 21 CFR Part 11–compliant software for the xCELLigence RTCA eSight platform, helping regulated labs manage real-time cell analysis data; paired with the xCELLigence RTCA DP system, which continuously measures cell invasion and migration, this strengthens Agilent’s offering for compliant migration and invasion assay workflows.
- In October 2025, Cell Biolabs updated and promoted its CytoSelect 96-Well Cell Migration and Invasion Assay Kit, which uses 8 µm membranes and basement-membrane–coated inserts with streamlined fluorometric readout to quantify migratory and invasive cells in a high-throughput 96-well format.
- In October 2025, Sigma-Aldrich / Merck Group (MilliporeSigma) entered into a strategic collaboration with Promega to advance 3D cell drug discovery technologies potentially impacting cell migration/invasion assay solutions as part of advanced drug discovery workflows.
Report Coverage
The research report offers an in-depth analysis based on Assay Type, Application, End-User and Geography. It details leading market players, providing an overview of their business, product offerings, investments, revenue streams, and key applications. Additionally, the report includes insights into the competitive environment, SWOT analysis, current market trends, as well as the primary drivers and constraints. Furthermore, it discusses various factors that have driven market expansion in recent years. The report also explores market dynamics, regulatory scenarios, and technological advancements that are shaping the industry. It assesses the impact of external factors and global economic changes on market growth. Lastly, it provides strategic recommendations for new entrants and established companies to navigate the complexities of the market.
Future Outlook
- Demand will rise as oncology pipelines expand and metastasis research becomes more advanced.
- Adoption of 3D culture systems and organoid-based invasion models will increase across labs.
- High-content imaging and AI-driven analytics will streamline data interpretation and improve accuracy.
- Microfluidic platforms will gain traction due to better simulation of physiological environments.
- CRO outsourcing will grow as pharma companies seek faster and cost-efficient screening services.
- Immunology and cell-therapy research will boost use of migration assays for immune-cell tracking.
- Automation will expand, reducing manual variability and improving assay reproducibility.
- Standardized assay kits will gain preference as demand for cross-lab consistency strengthens.
- Emerging markets will invest more in advanced research infrastructure, driving wider adoption.
- Integration of real-time, label-free monitoring technologies will reshape next-generation assay workflows.
Request a Free Sample
Fill in your details and we'll send you a free sample report.
- Sample data tables & charts
- Research methodology
Need a Custom Version of This Report?
Tailor the scope, geography, or segments to your exact requirements.
- Custom geography or segment scope
- Direct access to our analyst team
Frequently Asked Questions
What is the current market size for Cell invasion and migration assays Market, and what is its projected size in 2032?
At what Compound Annual Growth Rate is Cell invasion and migration assays Market projected to grow between 2024 and 2032?
Which Cell invasion and migration assays Market segment held the largest share in 2024?
What are the primary factors fueling the growth of Cell invasion and migration assays Market?
Who are the leading companies in Cell invasion and migration assays Market?
Which region commanded the largest share of Cell invasion and migration assays Market?
Table of Content
Chapter 1. Report Introduction
- 1.1 Report Description & Purpose
- 1.1.1 Report Title & Market Definition
- 1.1.2 Unique Selling Propositions (USP) & Key Differentiators
- 1.1.3 Value Proposition for Stakeholders
- 1.2 Research Objectives
- 1.2.1 Market Sizing Objectives (Volume & Revenue)
- 1.2.2 Segmentation Objectives
- 1.2.3 Competitive Intelligence Objectives
- 1.2.4 Forecast & Scenario Objectives
- 1.3 Report Scope
- 1.3.1 Cell Invasion and Migration Assays Scope – Types & Subtypes Covered
- 1.3.2 Geographic Scope – Regions & Countries Covered
- 1.3.3 Historical Period, Base Year & Forecast Period (the historical period; forecast to 2032)
- 1.3.4 Inclusions & Exclusions
- 1.4 HS Code & Classification Framework
- 1.5 Currency, Units & Pricing Basis
- 1.6 Target Stakeholders
- 1.7 Limitations & Assumptions
Chapter 2. Executive Summary
- 2.1 Global Cell Invasion and Migration Assays Market Snapshot
- 2.1.1 Market Size – Historical (the historical period) & Forecast (2032) (base year: USD 1,219 million → 2032: USD 2078.18 million)
- 2.1.2 Volume & Revenue – Global Totals
- 2.1.3 Key Market Highlights – Top Five Facts
- 2.2 Cell Invasion and Migration Assays Market Segmentation Snapshot
- 2.2.1 Market Split by Region – vs. 2032
- 2.3 Competitive Snapshot
- 2.3.1 Top 10 Players by Revenue Share –
- 2.3.2 Top 10 Players by Volume Share –
- 2.3.3 Recent Strategic Developments (18-Month Summary)
- 2.4 Key Investment Highlights & Strategic Conclusions
Chapter 3. Cell Invasion and Migration Assays Market Dynamics & Industry Analysis
- 3.1 Market Overview & Context
- 3.1.1 Cell Invasion and Migration Assays Market Position in the Broader Automotive Value Chain
- 3.1.2 OEM vs. Replacement Market Dynamics
- 3.1.3 Market Maturity & Development Stage by Region
- 3.2 Cell Invasion and Migration Assays Market Drivers
- 3.3 Cell Invasion and Migration Assays Market Restraints & Challenges
- 3.4 Cell Invasion and Migration Assays Market Opportunities
- 3.5 Porter's Five Forces Analysis
- 3.5.1 Threat of New Entrants
- 3.5.2 Bargaining Power of Suppliers
- 3.5.3 Bargaining Power of Buyers
- 3.5.4 Threat of Substitutes
- 3.5.5 Competitive Rivalry – Intensity Assessment
- 3.6 Cell Invasion and Migration Assays Value Chain Analysis
- 3.6.1 Upstream – Raw Material/Input Suppliers
- 3.6.1.1 Raw Material/Input 1
- 3.6.1.2 Raw Material/Input 2
- 3.6.1.3 Raw Material/Input 3
- 3.6.2 Midstream – Production/Manufacturing/Service Delivery
- 3.6.2.1 Production/Process Overview
- 3.6.2.2 Key Facility Locations & Capacity by Manufacturer
- 3.6.3 Downstream – Distribution & End Consumer
- 3.6.3.1 Primary Channel – B2B/OEM
- 3.6.3.2 Secondary Channels – Dealer, Retail, Online, Direct
- 3.6.4 Value Chain Profitability Analysis
- 3.6.1 Upstream – Raw Material/Input Suppliers
- 3.7 PESTEL Analysis
- 3.7.1 Political Factors
- 3.7.2 Economic Factors
- 3.7.3 Social Factors
- 3.7.4 Technological Factors
- 3.7.5 Environmental Factors
- 3.7.6 Legal Factors
- 3.8 Cell Invasion and Migration Assays Supply Chain Analysis
- 3.8.1 Raw Material/Input Supply Risk Assessment
- 3.8.2 Manufacturing Concentration Risk (Geographic Exposure)
- 3.8.3 Trade Disruption Impact Analysis
- 3.9 Regulatory & Policy Landscape
Note: The regulatory and policy landscape section covers regulations based on their applicability to the market, Cell Invasion and Migration Assays category, geography, and scope of the study. Only regulatory frameworks with a material impact on operations, compliance, trade, sustainability, or market access are analyzed in detail.
Chapter 4. Key Investment Pockets & Opportunity Analysis
- 4.1 Cell Invasion and Migration Assays Market Attractiveness Analysis
- 4.1.1 By Region – Investment Attractiveness Matrix (Volume × CAGR)
- 4.2 Absolute Revenue Growth Opportunity
- 4.2.1 By Region – Absolute USD Growth Through 2032
- 4.3 Incremental Volume Opportunity
- 4.3.1 By Region – Incremental Volume Through 2032
- 4.3.2 Segment – Incremental Volume
- 4.4 Emerging Submarket Opportunity Deep Dive (Subject to Applicability)
- 4.5 Emerging Market Opportunity Scorecards
- 4.5.1 United States
- 4.5.2 Europe
- 4.5.3 Asia
- 4.5.4 Middle East & Africa
Note: Emerging Market Opportunity Scorecards will be included based on relevance and strategic importance. Regions listed are indicative and may vary depending on data availability and market dynamics.
Chapter 5. Cell Invasion and Migration Assays Import-Export Analysis & Trade Flows
- 5.1 Global Trade Overview
- 5.1.1 Global Export Value by Country (the historical period)
- 5.1.2 Global Export Volume by Country (the historical period)
- 5.1.3 Global Import Value by Country (the historical period)
- 5.1.4 Global Import Volume by Country (the historical period)
- 5.1.5 Net Trade Balance by Country (the historical period)
- 5.2 Export Analysis – Segment
- 5.2.1 Type 1 (HS Code)
- 5.2.2 Type 2 (HS Code)
- 5.2.3 Type 3 (HS Code)
- 5.2.4 Type 4 (HS Code)
- 5.2.5 Type 5 (HS Code)
- 5.3 Import Analysis – Segment
- 5.3.1 Type 1 (HS Code)
- 5.3.2 Type 2 (HS Code)
- 5.3.3 Type 3 (HS Code)
- 5.3.4 Type 4 (HS Code)
- 5.3.5 Type 5 (HS Code)
- 5.4 Average Unit Trade Prices
- 5.4.1 Average Export Price – Segment & Country
- 5.4.2 Average Import Price – Segment & Source Country
- 5.4.3 Price Trends (the historical period)
- 5.5 Key Trade Route Analysis
- 5.5.1 Trade Route 1
- 5.5.2 Trade Route 2
- 5.5.3 Trade Route 3
- 5.5.4 Trade Route 4
- 5.5.5 Trade Route 5
- 5.6 Trade Policy Impact Assessment
- 5.6.1 US Anti-Dumping & Section 301 Tariffs
- 5.6.2 EU Customs Union Impact
- 5.6.3 Major Free Trade Agreements
- 5.6.4 USMCA Rules of Origin
Note: Trade policy analysis will be included only where relevant to the Cell Invasion and Migration Assays market.
Chapter 6. Competitive Landscape & Company Benchmarking
- 6.1 Cell Invasion and Migration Assays Market Concentration & Structure
- 6.1.1 Herfindahl-Hirschman Index (HHI) – vs.
- 6.1.2 Tier 1, Tier 2 & Tier 3 Market Structure
- 6.1.3 Global, Regional & Local Player Dynamics
- 6.2 Cell Invasion and Migration Assays Market Share Analysis –
- 6.2.1 Global Revenue Share by Company
- 6.2.2 Global Volume Share by Company
- 6.2.3 Regional Revenue Share
- 6.2.4 Market Share Evolution ( vs. )
- 6.2.5 OEM Segment Share by Company
- 6.2.6 Replacement Segment Share by Company
- 6.3 Production/Delivery Capacity & Facility Analysis
- 6.3.1 Global Installed Capacity
- 6.3.2 Capacity Utilization Rates
- 6.3.3 Production/Output Volume
- 6.3.4 Facility Locations & Capacity Map
- 6.3.5 Planned Capacity Additions
- 6.4 Cell Invasion and Migration Assays Competitive Benchmarking Matrix
- 6.4.1 Revenue, Volume, CAGR & Profitability Comparison
- 6.4.2 Channel Revenue Mix
- 6.4.3 Geographic Revenue Exposure
- 6.4.4 R&D Intensity
- 6.4.5 Sustainability Maturity
- 6.5 Strategic Developments in Cell Invasion and Migration Assays (Last 24 Months)
- 6.5.1 Mergers, Acquisitions & Divestments
- 6.5.2 New Cell Invasion and Migration Assays Launches
- 6.5.3 Facility Expansions
- 6.5.4 Strategic Alliances, Joint Ventures & Partnerships
- 6.5.5 Distribution Expansion & Market Entry
- 6.5.6 Sustainability & ESG Initiatives
- 6.6 Competitive Strategy Mapping
- 6.6.1 Leader, Challenger, Follower & Niche Classification
- 6.6.2 Pricing Strategy Comparison
- 6.6.3 Channel Strategy Matrix
Note: Strategic developments are included based on their materiality and the availability of reliable information.
Chapter 7. Global Cell Invasion and Migration Assays Market – By Distribution Channel
- 7.1 Segment Overview
- 7.1.1 Volume & Revenue Split by Channel ( & 2032)
- 7.1.2 Channel Mix Evolution (2032)
Chapter 8. Regional Market Analysis – Global Overview
- 8.1 Global Regional Overview
- 8.1.1 Regional Volume Share
- 8.1.2 Regional Revenue Share
- 8.1.3 Regional Volume by Region
- 8.1.4 Regional Revenue by Region
- 8.1.5 Regional Forecast Through 2032
- 8.2 Cross-Regional Segment Analysis
- 8.2.1 By Distribution Channel
- 8.2.2 By Brand/Price Tier
Chapter 9. North America Cell Invasion and Migration Assays Market
- 9.1 United States
- 9.2 Canada
- 9.3 Mexico
Chapter 10. Europe Cell Invasion and Migration Assays Market
- 10.1 Germany
- 10.2 France
- 10.3 Italy
- 10.4 United Kingdom
- 10.5 Spain
- 10.6 Poland
- 10.7 Russia
- 10.8 Netherlands
- 10.9 Belgium
- 10.10 Sweden
- 10.11 Denmark
- 10.12 Norway
- 10.13 Rest of Europe
Chapter 11. Asia Pacific Cell Invasion and Migration Assays Market
- 11.1 China
- 11.2 India
- 11.3 Japan
- 11.4 South Korea
- 11.5 Thailand
- 11.6 Indonesia
- 11.7 Vietnam
- 11.8 Malaysia
- 11.9 Australia
- 11.10 Rest of Asia Pacific
Chapter 12. Latin America Cell Invasion and Migration Assays Market
- 12.1 Brazil
- 12.2 Argentina
- 12.3 Colombia
- 12.4 Chile
- 12.5 Rest of Latin America
Chapter 13. Middle East Cell Invasion and Migration Assays Market
- 13.1 Saudi Arabia
- 13.2 United Arab Emirates
- 13.3 Turkey
- 13.4 Israel
- 13.5 Iran
- 13.6 Rest of the Middle East
Chapter 14. Africa Cell Invasion and Migration Assays Market
- 14.1 South Africa
- 14.2 Egypt
- 14.3 Nigeria
- 14.4 Morocco
- 14.5 Rest of Africa
Chapter 15. Cell Invasion and Migration Assays Company Profiles
- 15.1 [Company 01]
- 15.1.1 Company Overview
- 15.1.2 Key Management Personnel
- 15.1.3 Products & Services Portfolio
- 15.1.4 Financial Performance
- 15.1.5 Key Market Focus & Geographic Presence
- 15.1.6 Recent Developments & Strategic Initiatives
Note: The company profile list is preliminary and may change based on research findings, market developments, data availability, and client requirements.
Chapter 16. Appendices
- Appendix A – List of Abbreviations & Acronyms
- Appendix B – Industry Classification Code Reference – Full Series
- Appendix C – Production & Capacity Data Tables
- Appendix D – End-Use & Demand Base Tables
- Appendix E – Consumption & Replacement Rate Assumptions
- Appendix F – ASP Reference Tables
- Appendix G – Manufacturing & Facility Database
- Appendix H – Import-Export Data Tables
- Appendix I – Regulatory Summary Tables
- Appendix J – Primary Research Participant List (Anonymized)
- Appendix K – Primary Research Questionnaire Framework
- Appendix L – Data Sources & Bibliography
- Appendix M – Market Size Divergence & Source Comparison
Chapter 17. Research Methodology
- 17.1 Research Framework & Philosophy
- 17.2 Secondary Research – Sources, Hierarchy & Data Extraction
- 17.3 Data Modeling – Bottom-Up & Top-Down Market Sizing
- 17.4 Primary Research – Stakeholder Framework, LOI & Sample Sizes
- 17.5 Forecast Methodology – Regression, Scenario & Sensitivity Analysis
- 17.6 Quality Control – Four-Layer Validation Framework
- 17.7 Limitations & Standard Assumptions
- 17.8 Disclaimer
