
Market Overview:
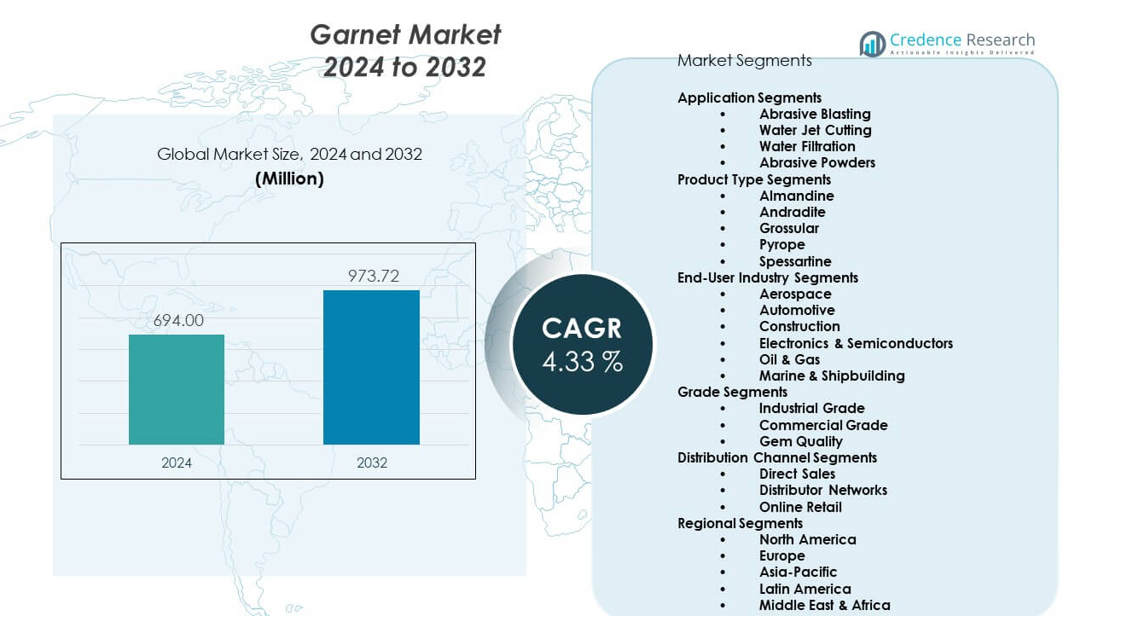
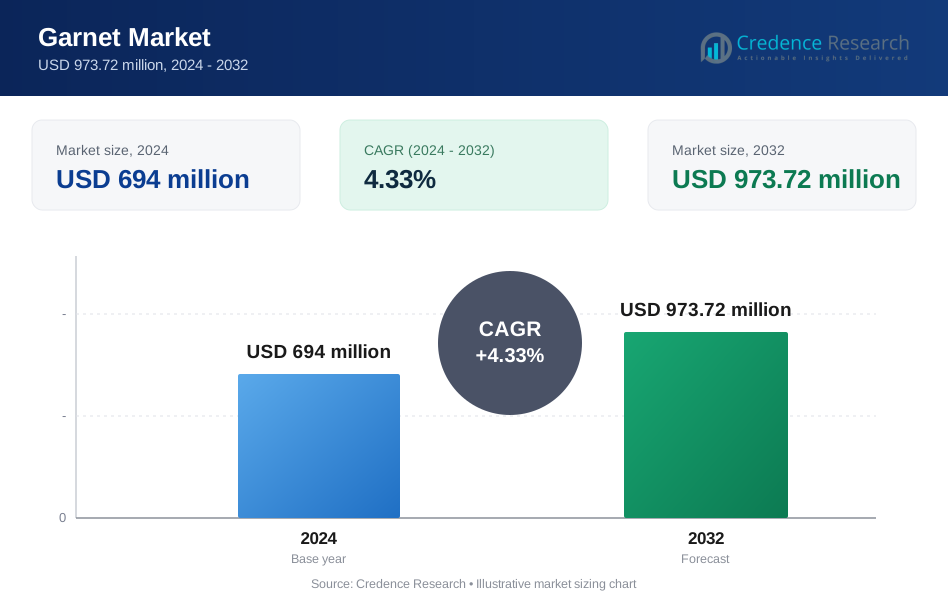
The Garnet Market was valued at USD 694 million in 2024 and is projected to reach USD 973.72 million by 2032. The market is expected to expand at a CAGR of 4.33% during the forecast period.
| REPORT ATTRIBUTE | DETAILS |
|---|---|
| Historical Period | 2020-2023 |
| Base Year | 2024 |
| Forecast Period | 2025-2032 |
| Garnet Market Size 2024 | USD 694 million |
| Garnet Market, CAGR | 4.33% |
| Garnet Market Size 2032 | USD 973.72 million |
Market growth is driven by increasing use of garnet in abrasive blasting and waterjet cutting operations. Industries favor garnet due to high cutting efficiency, low dust emission, and worker safety benefits. Shipbuilding and steel fabrication rely on garnet for surface preparation and coating removal. Waterjet cutting adoption rises as manufacturers seek precise and cold-cutting solutions. Environmental regulations discourage silica sand use, supporting garnet substitution. Recyclability further improves cost efficiency for end users. Consistent performance strengthens long-term industrial demand.
Asia Pacific leads the garnet market due to abundant natural reserves and strong processing capacity. India and Australia dominate global production and export volumes, supported by established mining operations. China drives consumption through construction, metal fabrication, and infrastructure projects. North America shows stable demand from aerospace, automotive, and waterjet cutting industries. Europe maintains steady use in industrial blasting and filtration applications. The Middle East sees growth from oil, gas, and ship maintenance activities. Africa emerges as a supplier through expanding mining investments.
Market Insights:
- The Garnet Market was valued at USD 694 million in 2024 and is projected to reach USD 973.72 million by 2032, growing at a CAGR of 4.33% due to steady industrial and infrastructure demand.
- Asia-Pacific leads with over 50% market share, driven by strong mining capacity, large-scale manufacturing, and high consumption in China, India, and Australia.
- North America holds about 27.5% share, supported by aerospace, automotive, and strict industrial safety standards, while Europe follows with roughly 20% share due to mature surface treatment and filtration industries.
- Asia-Pacific remains the fastest-growing region with more than 50% share, supported by rapid infrastructure development, export-oriented mining, and expanding waterjet cutting adoption.
- Abrasive blasting accounts for nearly 45% of total demand due to heavy industrial use, while waterjet cutting contributes about 30% driven by precision manufacturing growth.
Market Drivers:
Rising Industrial Dependence On High-Efficiency Abrasive Materials Across Heavy Industries
The Garnet Market benefits from sustained demand across metal fabrication and surface treatment sectors. Steel manufacturers rely on garnet for effective scale and rust removal. Shipyards depend on controlled blasting to maintain hull integrity. The material delivers uniform hardness and sharp grain structure. Industrial users value predictable surface finish quality across assets. Low dust generation supports safer work environments. Occupational health regulations favor safer abrasive materials. Recurring maintenance cycles ensure steady consumption volumes.
- For instance, GMA Garnet Group reports that its almandine garnet achieves less than 1% free silica content and maintains consistent Mohs hardness of 7.5–8, supporting safer blasting operations in shipyards and steel plants.
Growing Penetration Of Precision Waterjet Cutting Across Manufacturing Segments
The Garnet Market gains strength from broader adoption of waterjet cutting systems. Manufacturers prefer waterjets for cold and distortion-free cutting. Garnet enables accurate processing of metals, stone, and composites. Aerospace suppliers demand tight tolerance and clean edge quality. Automotive component makers seek consistent cutting performance. Fabrication units value repeatable abrasive behavior. Recycling capability supports cost control goals. Precision manufacturing requirements sustain long-term demand.
- For instance, Barton International states that its waterjet-grade garnet supports cutting tolerances within ±0.05 mm in aerospace-grade aluminum and titanium applications, meeting precision requirements for aircraft component suppliers.
Stricter Environmental And Worker Safety Regulations Supporting Safer Abrasive Choices
The Garnet Market aligns well with tightening industrial safety standards worldwide. Regulators restrict silica sand use due to health risks. Industries actively seek compliant abrasive alternatives. Garnet reduces airborne particle exposure at worksites. Environmental audits favor inert mineral materials. Waste handling becomes easier due to chemical stability. Compliance planning shapes procurement strategies. Safety-focused policies reinforce adoption momentum.
Expansion Of Infrastructure Maintenance And Asset Refurbishment Activities Worldwide
The Garnet Market benefits from rising infrastructure maintenance needs. Aging bridges require frequent surface preparation. Ports and marine assets depend on corrosion control programs. Energy pipelines undergo regular refurbishment cycles. Public agencies demand reliable cleaning media. Garnet performs consistently on steel and concrete structures. Long asset lifecycles drive repeat usage. Maintenance contracts support stable demand flow.
Market Trends:
Rising Focus On Abrasive Reusability And Multi-Cycle Operational Efficiency
The Garnet Market reflects stronger emphasis on abrasive reuse efficiency. Industrial users seek materials that support multiple blasting cycles. Reusable garnet improves overall cost management. Recycling systems reduce material waste volumes. Equipment suppliers design recovery-compatible systems. Users monitor particle breakdown closely. Sustainability targets influence procurement decisions. Durable abrasives gain preference across industries.
- For instance, Australian Garnet Pty Ltd. confirms its garnet maintains effective blasting performance for up to 4 reuse cycles in controlled recovery systems, reducing abrasive consumption in infrastructure maintenance projects.
Increasing Demand For Tight Mesh Control And Certified Quality Grades
The Garnet Market shows clear preference for standardized specifications. Buyers require consistent particle size distribution. Controlled mesh sizes ensure uniform surface results. Quality consistency reduces rework and downtime. Certified grading builds buyer confidence. Traceability supports industrial compliance needs. Procurement teams favor verified suppliers. Quality assurance becomes a key differentiator.
- For instance, RZG Garnet Ltd. operates a fully automated processing facility with optical sorting and screening systems capable of delivering mesh size variance below ±5%, supporting high-precision blasting and cutting applications.
Expansion Of Garnet Applications In Industrial And Municipal Filtration Systems
The Garnet Market continues to diversify into filtration applications. Water treatment plants use garnet in multi-media filters. The material improves filtration depth and flow stability. Industrial wastewater systems adopt durable filter beds. Low attrition rates extend service life. Municipal utilities value operational reliability. Clean water regulations support broader adoption. Non-abrasive uses balance demand cycles.
Growing Preference For Regional Supply Security And Localized Sourcing Models
The Garnet Market reflects changing supply chain priorities. Buyers prefer dependable regional sourcing options. Transport cost control influences supplier selection. Local sourcing reduces delivery lead time risks. Domestic mining supports industrial continuity goals. Governments promote mineral self-reliance initiatives. Supply resilience improves contract stability. Localization reshapes long-term procurement strategies.
Market Challenges Analysis:
Natural Resource Quality Variability And Consistency Management Constraints
The Garnet Market faces challenges from uneven mineral deposit quality. Hardness and purity vary across mining regions. Quality variation affects industrial performance reliability. Standardization becomes difficult for large buyers. Processing requirements rise for lower-grade material. Quality assurance adds operational complexity. Supplier qualification timelines extend. Consistency remains a major concern.
Supply Chain Exposure To Mining Disruptions And Export Logistics Complexity
The Garnet Market depends heavily on stable mining operations. Production stoppages affect material availability. Export logistics introduce cost uncertainty. Buyers face freight and port-related risks. Regulatory changes influence extraction schedules. Weather conditions disrupt mine output. Long transport routes increase delivery uncertainty. Inventory planning becomes critical.
Market Opportunities:
Rising Demand From Advanced Manufacturing And High-Precision Engineering Industries
The Garnet Market can benefit from advanced manufacturing expansion. Precision engineering requires controlled material removal. Garnet supports machining of composites and alloys. Electronics manufacturing demands clean cutting processes. Aerospace components require high accuracy. Automation favors consistent abrasive inputs. High-value parts justify premium grades. Advanced sectors open new demand channels.
Expansion Of Mining Capacity And Investment In Value-Added Processing Facilities
The Garnet Market sees opportunity in upstream development. New mining projects increase supply diversity. Processing upgrades improve material consistency. Value-added facilities enable customized grades. Export-focused producers expand global reach. Local processing adds economic value. Technology adoption improves beneficiation efficiency. Supply diversification strengthens market resilience.
Market Segmentation Analysis:
Application Segments
The Garnet Market shows strong concentration in abrasive blasting due to widespread use in surface preparation. Water jet cutting holds a critical role in precision manufacturing where clean and cold cutting is required. Water filtration applications expand through municipal and industrial treatment systems that value durability and low attrition. Abrasive powders support fine grinding and polishing in specialized manufacturing. Each application benefits from garnet’s hardness and chemical stability. It supports consistent performance across heavy and precision tasks.
- For instance, Opta Group supplies garnet filtration media used in multi-media water filters that achieve turbidity reduction below 1 NTU in industrial wastewater treatment plants, confirming performance reliability.
Product Type Segments
Almandine dominates usage due to wide availability and balanced hardness. Andradite serves niche industrial and ornamental uses. Grossular finds demand in both industrial and decorative applications. Pyrope supports specific abrasive and gem-related needs. Spessartine remains relevant for specialty uses with controlled specifications. Product choice depends on mineral composition, hardness, and application suitability.
- For instance, Trimex Sands Private Limited produces almandine garnet with Fe₂O₃ content optimized for abrasive strength, supplying consistent grades for industrial blasting and waterjet cutting applications across fabrication and infrastructure sectors.
End-User Industry Segments
Aerospace relies on garnet for precision cutting and surface treatment. Automotive manufacturing uses it for component finishing and fabrication. Construction drives demand through blasting and filtration applications. Electronics and semiconductors require controlled abrasive inputs. Oil and gas depend on it for pipeline and equipment maintenance. Marine and shipbuilding sustain demand through corrosion control activities.
Grade Segments
Industrial grade garnet supports heavy-duty applications. Commercial grade balances performance and cost efficiency. Gem quality serves jewelry and premium decorative uses. Each grade addresses distinct performance expectations.
Distribution Channel Segments
Direct sales dominate large industrial procurement. Distributor networks ensure regional availability and logistics support. Online retail serves smaller buyers and specialized orders.
Segmentation:
Application Segments
- Abrasive Blasting
- Water Jet Cutting
- Water Filtration
- Abrasive Powders
Product Type Segments
- Almandine
- Andradite
- Grossular
- Pyrope
- Spessartine
End-User Industry Segments
- Aerospace
- Automotive
- Construction
- Electronics & Semiconductors
- Oil & Gas
- Marine & Shipbuilding
Grade Segments
- Industrial Grade
- Commercial Grade
- Gem Quality
Distribution Channel Segments
- Direct Sales
- Distributor Networks
- Online Retail
Regional Segments
- North America
- U.S.
- Canada
- Mexico
- Europe
- Germany
- France
- U.K.
- Italy
- Spain
- Rest of Europe
- Asia Pacific
- China
- Japan
- India
- South Korea
- South-east Asia
- Rest of Asia Pacific
- Latin America
- Brazil
- Argentina
- Rest of Latin America
- Middle East & Africa
- GCC Countries
- South Africa
- Rest of the Middle East and Africa
Regional Analysis:
Asia-Pacific Dominates Global Demand And Supply Leadership
The Garnet Market sees Asia-Pacific as the leading region with over 50% market share. China and India drive this dominance through strong mining output and industrial consumption. Australia supports regional strength with large-scale reserves and export capacity. It benefits from cost-effective production and skilled processing infrastructure. Manufacturing growth supports demand across abrasives and waterjet cutting. Infrastructure development sustains long-term consumption patterns. Regional suppliers maintain strong global trade positions.
North America Maintains Strong Industrial And Technology-Led Demand
The Garnet Market holds a market share of about 27.5% in North America. The United States leads regional demand through aerospace, automotive, and industrial maintenance sectors. It supports high adoption of waterjet cutting systems. Strict safety standards favor garnet over silica-based abrasives. Industrial refurbishment activity sustains steady usage. Canada contributes through mining and filtration applications. Stable supply chains strengthen buyer confidence.
Europe, Middle East & Africa, And Latin America Show Balanced Expansion
The Garnet Market records Europe as the second-largest regional contributor with a strong share led by Germany, the UK, France, Italy, and Spain. Industrial surface treatment and filtration support regional demand. Middle East & Africa show emerging growth through oil, gas, and marine maintenance projects. It benefits from rising infrastructure investment in Saudi Arabia and the UAE. Latin America holds a smaller but steady share driven by Brazil, Mexico, and Argentina. Mining and construction activity support gradual uptake. Regional diversification improves global demand balance.
Key Player Analysis:
- GMA Garnet Group
- RZG Garnet Ltd.
- Trimex Sands Private Limited
- Barton International
- Indian Ocean Garnet Sands Company Ltd.
- V. Mineral Pvt. Ltd.
- Rizhao Garnet Ltd.
- Opta Group
- Australian Garnet Pty Ltd.
- Industrial Minerals NZ Ltd.
Competitive Analysis:
The Garnet Market shows a moderately consolidated structure with strong presence of integrated mining and processing companies. Leading players focus on reserve ownership, processing efficiency, and long-term supply contracts. It favors companies with stable mining licenses and export capabilities. Product quality consistency remains a key competitive factor. Firms compete on mesh control, recyclability, and application-specific grades. Vertical integration supports cost control and supply reliability. Regional players strengthen positions through proximity to end users. Strategic partnerships with waterjet and blasting equipment suppliers enhance market access. Sustainability practices increasingly influence buyer selection. Competitive intensity remains steady due to high entry barriers.
Recent Developments:
- During July 2025, Opta Group completed the acquisition of the m-tec Group, headquartered in Wesel, Germany, with the acquired operations now operating under the name OPTA Wesel GmbH & Co. KG. This acquisition significantly expanded Opta's European regional presence and enhanced its capability to deliver desulfurization solutions with strengthened local customer support and service reliability. The acquisition aligns with Opta's broader strategic pattern of expansion through targeted acquisitions, building on previous transactions including NuFlux LLC and Nupro Corporation in October 2023, Metcan Industrial Corporation in November 2021, and Anker Industries in 2023.
- In June 2025, GMA Garnet Group entered into a strategic partnership with Allredi, a prominent North American distributor of surface preparation and abrasives products. This collaboration expanded Allredi's access to GMA's comprehensive abrasive product line throughout the United States and Canada, leveraging GMA's processing facilities located in Texas, Oregon, and Pennsylvania to enhance distribution capabilities beyond previous regional limitations.
Report Coverage:
The research report offers an in-depth analysis based on application segments, product type segments, end-user industry segments, grade segments, distribution channel segments, and regional segments. It details leading market players, providing an overview of their business, product offerings, investments, revenue streams, and key applications. Additionally, the report includes insights into the competitive environment, SWOT analysis, current market trends, as well as the primary drivers and constraints. Furthermore, it discusses various factors that have driven market expansion in recent years. The report also explores market dynamics, regulatory scenarios, and technological advancements that are shaping the industry. It assesses the impact of external factors and global economic changes on market growth. Lastly, it provides strategic recommendations for new entrants and established companies to navigate the complexities of the market.
Future Outlook:
- Industrial maintenance demand will support steady consumption across surface preparation activities.
- Waterjet cutting adoption will expand across aerospace, automotive, and precision manufacturing sectors.
- Filtration applications will gain wider municipal and industrial acceptance due to durability benefits.
- Sustainability focus will strengthen demand for recyclable and low-waste garnet materials.
- Local sourcing strategies will influence supplier selection and long-term procurement planning.
- Processing automation will improve product consistency and operational efficiency for producers.
- Infrastructure refurbishment programs will sustain long-term usage across public and private assets.
- Specialty grades will gain share in high-value and precision-driven industries.
- Emerging markets will attract new mining and processing investments.
- Supply security will shape long-term contracts between producers and industrial buyers.
Request a Free Sample
Fill in your details and we'll send you a free sample report.
- Sample data tables & charts
- Research methodology
Need a Custom Version of This Report?
Tailor the scope, geography, or segments to your exact requirements.
- Custom geography or segment scope
- Direct access to our analyst team
Frequently Asked Questions
What is the current market size for the Garnet Market, and what is its projected size in 2032?
At what Compound Annual Growth Rate is the Garnet Market projected to grow between 2025 and 2032?
What are the primary applications of garnet?
How is the garnet market expected to evolve in the coming years?
What are the emerging trends in the garnet market?
Table of Content
Chapter 1. Report Introduction
- 1.1 Report Description & Purpose
- 1.1.1 Report Title & Market Definition
- 1.1.2 Unique Selling Propositions (USP) & Key Differentiators
- 1.1.3 Value Proposition for Stakeholders
- 1.2 Research Objectives
- 1.2.1 Market Sizing Objectives (Volume & Revenue)
- 1.2.2 Segmentation Objectives
- 1.2.3 Competitive Intelligence Objectives
- 1.2.4 Forecast & Scenario Objectives
- 1.3 Report Scope
- 1.3.1 Garnet Scope – Types & Subtypes Covered
- 1.3.2 Geographic Scope – Regions & Countries Covered
- 1.3.3 Historical Period, Base Year & Forecast Period (2024; forecast to 2032)
- 1.3.4 Inclusions & Exclusions
- 1.4 HS Code & Classification Framework
- 1.5 Currency, Units & Pricing Basis
- 1.6 Target Stakeholders
- 1.7 Limitations & Assumptions
Chapter 2. Executive Summary
- 2.1 Global Garnet Market Snapshot
- 2.1.1 Market Size – Historical (2024) & Forecast (2024-2032) (2024: USD 694 million → 2032: USD 973.72 million)
- 2.1.2 Volume & Revenue – Global Totals
- 2.1.3 Key Market Highlights – Top Five Facts
- 2.2 Garnet Market Segmentation Snapshot
- 2.2.1 Market Split by Region – 2024 vs. 2032
- 2.3 Competitive Snapshot
- 2.3.1 Top 10 Players by Revenue Share – 2024
- 2.3.2 Top 10 Players by Volume Share – 2024
- 2.3.3 Recent Strategic Developments (18-Month Summary)
- 2.4 Key Investment Highlights & Strategic Conclusions
Chapter 3. Garnet Market Dynamics & Industry Analysis
- 3.1 Market Overview & Context
- 3.1.1 Garnet Market Position in the Broader Automotive Value Chain
- 3.1.2 OEM vs. Replacement Market Dynamics
- 3.1.3 Market Maturity & Development Stage by Region
- 3.2 Garnet Market Drivers
- 3.3 Garnet Market Restraints & Challenges
- 3.4 Garnet Market Opportunities
- 3.5 Porter's Five Forces Analysis
- 3.5.1 Threat of New Entrants
- 3.5.2 Bargaining Power of Suppliers
- 3.5.3 Bargaining Power of Buyers
- 3.5.4 Threat of Substitutes
- 3.5.5 Competitive Rivalry – Intensity Assessment
- 3.6 Garnet Value Chain Analysis
- 3.6.1 Upstream – Raw Material/Input Suppliers
- 3.6.1.1 Raw Material/Input 1
- 3.6.1.2 Raw Material/Input 2
- 3.6.1.3 Raw Material/Input 3
- 3.6.2 Midstream – Production/Manufacturing/Service Delivery
- 3.6.2.1 Production/Process Overview
- 3.6.2.2 Key Facility Locations & Capacity by Manufacturer
- 3.6.3 Downstream – Distribution & End Consumer
- 3.6.3.1 Primary Channel – B2B/OEM
- 3.6.3.2 Secondary Channels – Dealer, Retail, Online, Direct
- 3.6.4 Value Chain Profitability Analysis
- 3.6.1 Upstream – Raw Material/Input Suppliers
- 3.7 PESTEL Analysis
- 3.7.1 Political Factors
- 3.7.2 Economic Factors
- 3.7.3 Social Factors
- 3.7.4 Technological Factors
- 3.7.5 Environmental Factors
- 3.7.6 Legal Factors
- 3.8 Garnet Supply Chain Analysis
- 3.8.1 Raw Material/Input Supply Risk Assessment
- 3.8.2 Manufacturing Concentration Risk (Geographic Exposure)
- 3.8.3 Trade Disruption Impact Analysis
- 3.9 Regulatory & Policy Landscape
Note: The regulatory and policy landscape section covers regulations based on their applicability to the market, Garnet category, geography, and scope of the study. Only regulatory frameworks with a material impact on operations, compliance, trade, sustainability, or market access are analyzed in detail.
Chapter 4. Key Investment Pockets & Opportunity Analysis
- 4.1 Garnet Market Attractiveness Analysis
- 4.1.1 By Region – Investment Attractiveness Matrix (Volume × CAGR)
- 4.2 Absolute Revenue Growth Opportunity
- 4.2.1 By Region – Absolute USD Growth Through 2032
- 4.3 Incremental Volume Opportunity
- 4.3.1 By Region – Incremental Volume Through 2032
- 4.3.2 Segment – Incremental Volume
- 4.4 Emerging Submarket Opportunity Deep Dive (Subject to Applicability)
- 4.5 Emerging Market Opportunity Scorecards
- 4.5.1 United States
- 4.5.2 Europe
- 4.5.3 Asia
- 4.5.4 Middle East & Africa
Note: Emerging Market Opportunity Scorecards will be included based on relevance and strategic importance. Regions listed are indicative and may vary depending on data availability and market dynamics.
Chapter 5. Garnet Import-Export Analysis & Trade Flows
- 5.1 Global Trade Overview
- 5.1.1 Global Export Value by Country (2024)
- 5.1.2 Global Export Volume by Country (2024)
- 5.1.3 Global Import Value by Country (2024)
- 5.1.4 Global Import Volume by Country (2024)
- 5.1.5 Net Trade Balance by Country (2024)
- 5.2 Export Analysis – Segment
- 5.2.1 Type 1 (HS Code)
- 5.2.2 Type 2 (HS Code)
- 5.2.3 Type 3 (HS Code)
- 5.2.4 Type 4 (HS Code)
- 5.2.5 Type 5 (HS Code)
- 5.3 Import Analysis – Segment
- 5.3.1 Type 1 (HS Code)
- 5.3.2 Type 2 (HS Code)
- 5.3.3 Type 3 (HS Code)
- 5.3.4 Type 4 (HS Code)
- 5.3.5 Type 5 (HS Code)
- 5.4 Average Unit Trade Prices
- 5.4.1 Average Export Price – Segment & Country
- 5.4.2 Average Import Price – Segment & Source Country
- 5.4.3 Price Trends (2024)
- 5.5 Key Trade Route Analysis
- 5.5.1 Trade Route 1
- 5.5.2 Trade Route 2
- 5.5.3 Trade Route 3
- 5.5.4 Trade Route 4
- 5.5.5 Trade Route 5
- 5.6 Trade Policy Impact Assessment
- 5.6.1 US Anti-Dumping & Section 301 Tariffs
- 5.6.2 EU Customs Union Impact
- 5.6.3 Major Free Trade Agreements
- 5.6.4 USMCA Rules of Origin
Note: Trade policy analysis will be included only where relevant to the Garnet market.
Chapter 6. Competitive Landscape & Company Benchmarking
- 6.1 Garnet Market Concentration & Structure
- 6.1.1 Herfindahl-Hirschman Index (HHI) – vs. 2024
- 6.1.2 Tier 1, Tier 2 & Tier 3 Market Structure
- 6.1.3 Global, Regional & Local Player Dynamics
- 6.2 Garnet Market Share Analysis – 2024
- 6.2.1 Global Revenue Share by Company
- 6.2.2 Global Volume Share by Company
- 6.2.3 Regional Revenue Share
- 6.2.4 Market Share Evolution ( vs. 2024)
- 6.2.5 OEM Segment Share by Company
- 6.2.6 Replacement Segment Share by Company
- 6.3 Production/Delivery Capacity & Facility Analysis
- 6.3.1 Global Installed Capacity
- 6.3.2 Capacity Utilization Rates
- 6.3.3 Production/Output Volume
- 6.3.4 Facility Locations & Capacity Map
- 6.3.5 Planned Capacity Additions
- 6.4 Garnet Competitive Benchmarking Matrix
- 6.4.1 Revenue, Volume, CAGR & Profitability Comparison
- 6.4.2 Channel Revenue Mix
- 6.4.3 Geographic Revenue Exposure
- 6.4.4 R&D Intensity
- 6.4.5 Sustainability Maturity
- 6.5 Strategic Developments in Garnet (Last 24 Months)
- 6.5.1 Mergers, Acquisitions & Divestments
- 6.5.2 New Garnet Launches
- 6.5.3 Facility Expansions
- 6.5.4 Strategic Alliances, Joint Ventures & Partnerships
- 6.5.5 Distribution Expansion & Market Entry
- 6.5.6 Sustainability & ESG Initiatives
- 6.6 Competitive Strategy Mapping
- 6.6.1 Leader, Challenger, Follower & Niche Classification
- 6.6.2 Pricing Strategy Comparison
- 6.6.3 Channel Strategy Matrix
Note: Strategic developments are included based on their materiality and the availability of reliable information.
Chapter 7. Global Garnet Market – By Distribution Channel
- 7.1 Segment Overview
- 7.1.1 Volume & Revenue Split by Channel (2024 & 2032)
- 7.1.2 Channel Mix Evolution (2024-2032)
Chapter 8. Regional Market Analysis – Global Overview
- 8.1 Global Regional Overview
- 8.1.1 Regional Volume Share
- 8.1.2 Regional Revenue Share
- 8.1.3 Regional Volume by Region
- 8.1.4 Regional Revenue by Region
- 8.1.5 Regional Forecast Through 2032
- 8.2 Cross-Regional Segment Analysis
- 8.2.1 By Distribution Channel
- 8.2.2 By Brand/Price Tier
Chapter 9. North America Garnet Market
- 9.1 United States
- 9.2 Canada
- 9.3 Mexico
Chapter 10. Europe Garnet Market
- 10.1 Germany
- 10.2 France
- 10.3 Italy
- 10.4 United Kingdom
- 10.5 Spain
- 10.6 Poland
- 10.7 Russia
- 10.8 Netherlands
- 10.9 Belgium
- 10.10 Sweden
- 10.11 Denmark
- 10.12 Norway
- 10.13 Rest of Europe
Chapter 11. Asia Pacific Garnet Market
- 11.1 China
- 11.2 India
- 11.3 Japan
- 11.4 South Korea
- 11.5 Thailand
- 11.6 Indonesia
- 11.7 Vietnam
- 11.8 Malaysia
- 11.9 Australia
- 11.10 Rest of Asia Pacific
Chapter 12. Latin America Garnet Market
- 12.1 Brazil
- 12.2 Argentina
- 12.3 Colombia
- 12.4 Chile
- 12.5 Rest of Latin America
Chapter 13. Middle East Garnet Market
- 13.1 Saudi Arabia
- 13.2 United Arab Emirates
- 13.3 Turkey
- 13.4 Israel
- 13.5 Iran
- 13.6 Rest of the Middle East
Chapter 14. Africa Garnet Market
- 14.1 South Africa
- 14.2 Egypt
- 14.3 Nigeria
- 14.4 Morocco
- 14.5 Rest of Africa
Chapter 15. Garnet Company Profiles
- 15.1 [Company 01]
- 15.1.1 Company Overview
- 15.1.2 Key Management Personnel
- 15.1.3 Products & Services Portfolio
- 15.1.4 Financial Performance
- 15.1.5 Key Market Focus & Geographic Presence
- 15.1.6 Recent Developments & Strategic Initiatives
Note: The company profile list is preliminary and may change based on research findings, market developments, data availability, and client requirements.
Chapter 16. Appendices
- Appendix A – List of Abbreviations & Acronyms
- Appendix B – Industry Classification Code Reference – Full Series
- Appendix C – Production & Capacity Data Tables
- Appendix D – End-Use & Demand Base Tables
- Appendix E – Consumption & Replacement Rate Assumptions
- Appendix F – ASP Reference Tables
- Appendix G – Manufacturing & Facility Database
- Appendix H – Import-Export Data Tables
- Appendix I – Regulatory Summary Tables
- Appendix J – Primary Research Participant List (Anonymized)
- Appendix K – Primary Research Questionnaire Framework
- Appendix L – Data Sources & Bibliography
- Appendix M – Market Size Divergence & Source Comparison
Chapter 17. Research Methodology
- 17.1 Research Framework & Philosophy
- 17.2 Secondary Research – Sources, Hierarchy & Data Extraction
- 17.3 Data Modeling – Bottom-Up & Top-Down Market Sizing
- 17.4 Primary Research – Stakeholder Framework, LOI & Sample Sizes
- 17.5 Forecast Methodology – Regression, Scenario & Sensitivity Analysis
- 17.6 Quality Control – Four-Layer Validation Framework
- 17.7 Limitations & Standard Assumptions
- 17.8 Disclaimer
