Inkjet Printers Market Overview:
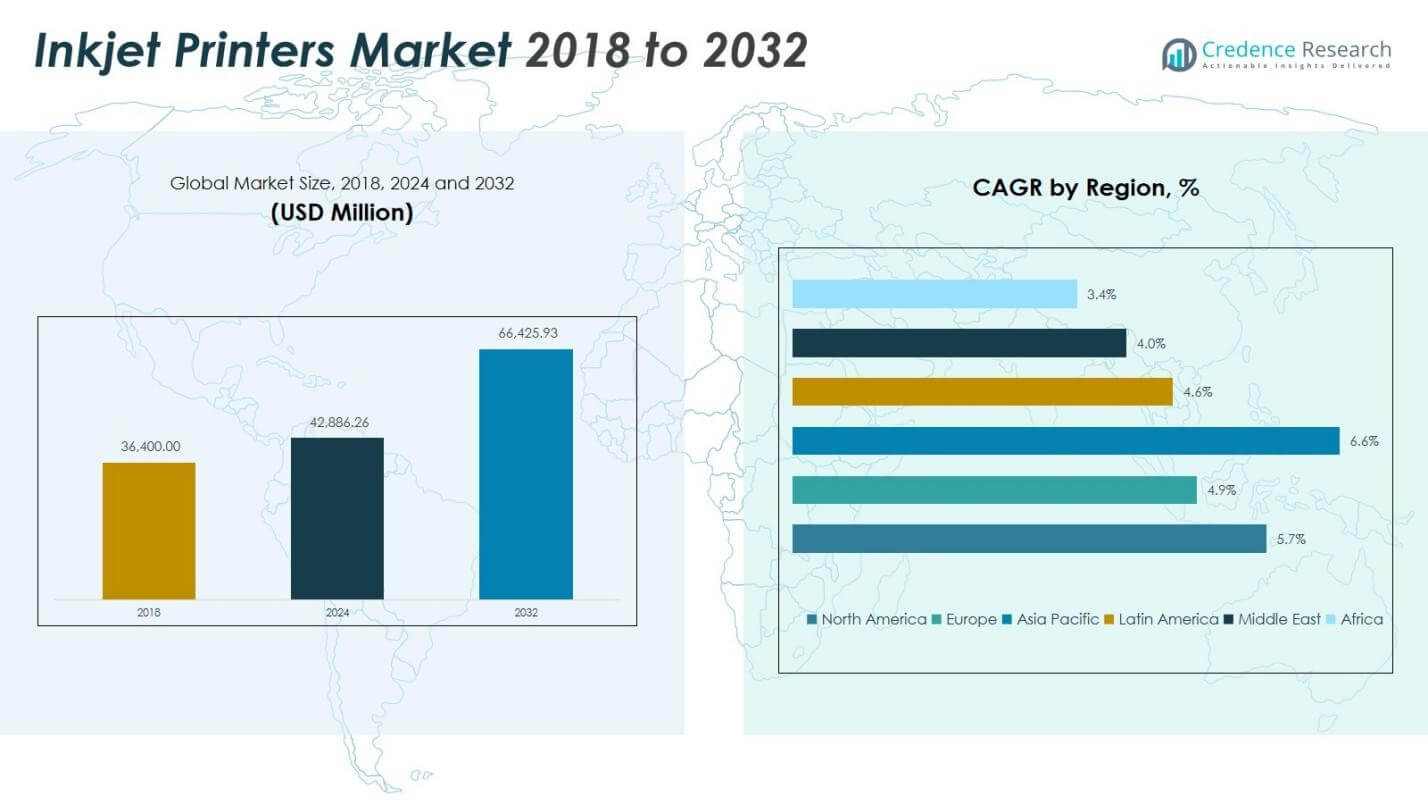
Inkjet Printers Market size was valued at USD 36,400.00 Million in 2018 and increased to USD 42,886.26 Million in 2024, and it is anticipated to reach USD 66,425.93 Million by 2032, growing at a CAGR of 5.71% during the forecast period.
| REPORT ATTRIBUTE |
DETAILS |
| Historical Period |
2020-2023 |
| Base Year |
2024 |
| Forecast Period |
2025-2032 |
| Inkjet Printers Market Size 2024 |
USD 42,886.26 million |
| Inkjet Printers Market, CAGR |
5.71% |
| Inkjet Printers Market Size 2032 |
USD 66,425.93 million |
Inkjet Printers Market Insights
- Market drivers include the rising adoption of digital and on-demand printing, strong demand from industrial coding, packaging, publishing, and textile applications, and increasing preference for high-resolution, flexible, and short-run print solutions across end-use sectors.
- Market trends reflect rapid growth in UV and textile inkjet technologies, increasing integration of IoT-enabled and cloud-connected printers, expansion of eco-efficient inks, and broader use of inkjet systems in customized, décor, and photo-quality applications.
- Competitive analysis indicates strong participation from global print technology manufacturers focusing on product innovation, print-head efficiency, energy-saving systems, and expansion into industrial and packaging markets through partnerships, portfolio upgrades, and aftermarket service development.
- Regional analysis shows Asia Pacific leading with 31.9% share in 2024, followed by North America and Europe, while the industrial segment holds 9% share, supported by manufacturing, labeling, and traceability applications across key growth markets.
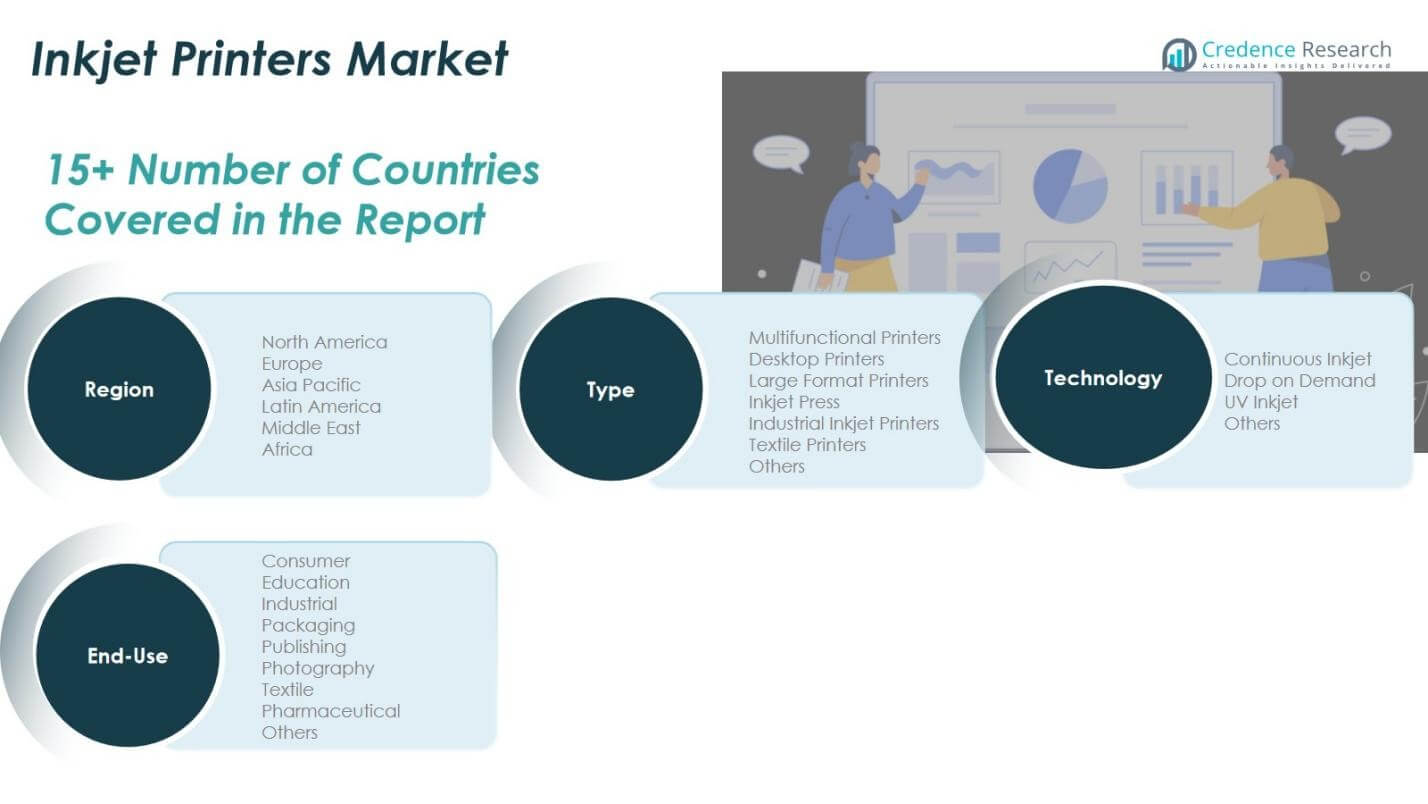
Inkjet Printers Market Segmentation Analysis:
By Type
The Inkjet Printers Market by type is led by Multifunctional Printers, which accounted for 32.8% share in 2024, driven by their ability to integrate printing, scanning, copying, and connectivity functions for home offices, enterprises, and SMEs. Desktop Printers retained strong adoption in SOHO environments, while Large Format Printers gained traction in signage and graphics applications. Inkjet Press systems expanded in commercial printing due to scalability and print quality, whereas Industrial Inkjet Printers and Textile Printers grew on the back of digital manufacturing trends. The Others category served niche professional and specialty-printing applications across emerging industry use cases.
- For instance, HP’s OfficeJet Pro 8139e offers AI-enabled printing, scanning, copying, and faxing with a 225-sheet capacity and speeds up to 20 ppm black for home offices and small businesses.
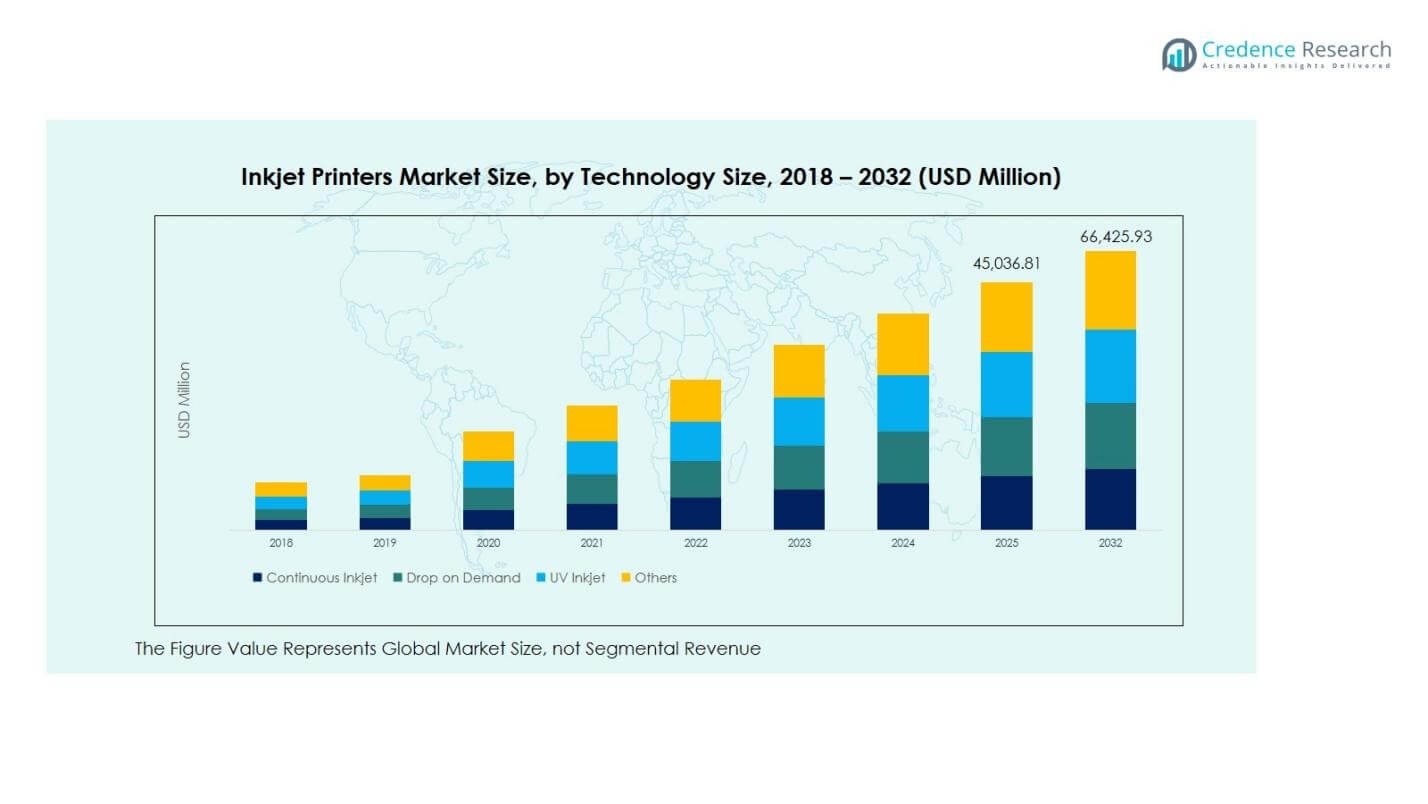
By Technology
The Inkjet Printers Market by technology is dominated by Drop on Demand (DoD) technology, which captured 41.5% share in 2024, supported by high-resolution output, material versatility, energy efficiency, and suitability for packaging, labeling, textiles, and industrial marking. Continuous Inkjet technology maintained significant demand in coding and batch-printing environments requiring non-stop operation, while UV Inkjet technology expanded with durable, fast-curing, and substrate-flexible printing advantages across signage and industrial décor applications. The Others segment included hybrid and specialty inkjet platforms tailored for security printing, ceramic applications, and advanced digital production environments.
- For instance, REA JET’s DOD 2.0 printer marks filled paper bags with alphanumeric texts, codes, and logos up to 140 mm height per print head at speeds to 600 m/min on absorbent and non-absorbent surfaces like paper and plastic.
By End-Use
The Inkjet Printers Market by end-use is led by the Industrial segment, holding 27.9% share in 2024, driven by rapid adoption in product labeling, component marking, coding, traceability, and customized manufacturing workflows. The Consumer segment remained resilient due to home printing, photo output, and remote-work usage, while Packaging applications expanded with e-commerce growth and regulatory labeling requirements. Publishing and Photography segments benefited from on-demand print runs and professional imaging output, whereas Textile and Pharmaceutical segments advanced through digital fabric printing, serialization, and compliance labeling. The Others category included creative studios, advertising, and specialty commercial print users.
Access crucial information at unmatched prices!
Request your sample report today & start making informed decisions powered by Credence Research Inc.!
Download Sample
Key Growth Drivers
Rising Demand for Digital and On-Demand Printing
The Inkjet Printers Market is experiencing strong growth due to rising adoption of digital and on-demand printing across consumer, commercial, and industrial environments. Organizations increasingly prefer short-run, variable-data, and customized print formats for packaging, labeling, publishing, and promotional materials, which drives the shift from conventional printing to inkjet systems. The growth of e-commerce and small businesses further accelerates demand for affordable, flexible, and versatile printing solutions. In addition, advancements in ink formulation, print head precision, and workflow automation enhance productivity and output quality, strengthening market penetration across office, home, and industrial print ecosystems.
- For instance, Domino’s K600i UV inkjet printer enables high-speed variable data printing of 2D codes, barcodes, and numbering on labels, tags, tickets, and pharma packaging at up to 200m/min. Paragon Identification SAS adopted it to personalize cinema cards, reducing waste and boosting speed.
Expansion of Industrial and Packaging Printing Applications
Industrial and packaging sectors significantly contribute to market expansion as inkjet technology becomes integral to product coding, marking, serialization, and traceability processes. Manufacturers across pharmaceuticals, food and beverages, electronics, and automotive industries rely on inkjet systems for batch identification, regulatory compliance labeling, and real-time production marking. The increasing adoption of automated manufacturing and smart factories enhances integration of inkjet printers with industrial production lines. The growth of flexible packaging and sustainability-driven labeling formats further drives investment in high-speed, durable, and energy-efficient industrial inkjet platforms.
- For instance, Videojet continuous inkjet printers enable printing of barcodes, expiration dates, and traceability codes directly on pharmaceutical packaging substrates like cartons, labels, plastic, and Tyvek.
Technological Advancements and Innovation in Print Quality
Technological innovation remains a key growth driver as manufacturers introduce high-resolution print heads, UV-curable inks, precision droplet control, and hybrid inkjet platforms to support diverse substrates and advanced printing requirements. Improvements in color accuracy, print durability, material compatibility, and curing efficiency expand inkjet adoption across signage, textiles, commercial graphics, and photo printing applications. Integration with cloud-connected workflows, IoT-enabled monitoring, and AI-based maintenance enhances reliability and operational efficiency. These advancements position inkjet printers as cost-effective, scalable, and high-performance alternatives to traditional printing technologies.
Key Trends & Opportunities
Growth of Textile, Decorative, and Customized Printing Solutions
A major trend shaping the Inkjet Printers Market is the rapid expansion of digital textile and decorative printing, driven by rising demand for customized apparel, home décor fabrics, soft signage, and fashion-on-demand production models. Inkjet-based textile printing supports eco-efficient manufacturing with lower water usage, reduced waste, and flexible design variation. Brands increasingly adopt digital printing to accelerate design-to-market timelines and enable mass personalization. Additionally, interior décor, ceramics, wallpaper, and architectural surfaces represent emerging opportunity areas where inkjet technology enables high-resolution visual finishes and material-specific printing innovation.
- For instance, Kyocera’s FOREARTH inkjet textile printer employs a water-free concept that reduces water consumption by 99% compared to traditional dye printing processes.
Adoption of Sustainable and Eco-Efficient Printing Technologies
Sustainability-driven innovation is creating new opportunities as enterprises and consumers prioritize environmentally responsible printing solutions. Manufacturers are investing in water-based, bio-based, and low-VOC inks, alongside energy-efficient curing systems and recyclable printing materials. Continuous improvements in print head lifespan, ink consumption efficiency, and waste-minimizing workflows reduce operational costs and environmental footprint. Regulatory compliance requirements in packaging and labeling further accelerate adoption of sustainable printing approaches. This trend supports long-term transition toward greener production ecosystems across industrial, commercial, and consumer printing segments.
- For instance, DIC Corporation developed AquaGreen inks with high bio-content levels and zero VOCs using water-based resin technology for flexographic printing, offering benefits like reduced emissions without compromising performance.
Key Challenges
High Operating Costs and Maintenance Requirements
Despite technological progress, the Inkjet Printers Market faces challenges related to high operating and lifecycle costs, particularly in industrial and commercial applications. Frequent ink replacement, consumable expenses, print head wear, and periodic calibration increase total cost of ownership for end users. Maintenance downtime may disrupt production continuity in high-volume environments, while specialized technical expertise is often required for system servicing. Small businesses and cost-sensitive users may delay upgrades due to capital investment barriers, which affects adoption rates, especially in developing markets and price-competitive printing segments.
Competition from Alternative Printing Technologies
The market encounters competitive pressure from alternative printing technologies such as laser printing, electrophotography, and traditional offset systems, which remain preferred in certain high-volume and cost-efficient production environments. Laser printers retain strong presence in enterprise and office ecosystems due to print speed and document consistency, while offset printing continues to dominate large-scale publishing and bulk production. In addition, customer perception regarding durability and long-term reliability sometimes favors competing technologies. These competitive dynamics require inkjet manufacturers to continuously innovate, differentiate performance capabilities, and demonstrate clear value advantages to sustain market growth.
Regional Analysis
North America
North America remains a leading region in the Inkjet Printers Market, supported by strong adoption across commercial printing, industrial coding, and home-office applications. The market was valued at USD 10,468.64 million in 2018 and increased to USD 12,145.13 million in 2024, accounting for 28.3% market share in 2024, driven by technological innovation, digital printing demand, and expanding packaging applications. By 2032, the market is projected to reach USD 18,778.73 million, reflecting a CAGR of 5.7%. Growth is reinforced by automation trends, enterprise digitalization, and the rising need for high-resolution, short-run, and customized printing solutions across industrial and consumer segments.
Europe
Europe demonstrates steady expansion in the Inkjet Printers Market, supported by increasing investment in industrial marking, packaging, textile printing, and sustainable labeling solutions. The regional market was valued at USD 8,583.12 million in 2018 and rose to USD 9,673.97 million in 2024, representing 22.6% market share in 2024. The market is forecast to reach USD 14,052.58 million by 2032, advancing at a CAGR of 4.9%. Growth is driven by regulatory compliance in product identification, digital print adoption in commercial graphics, and expanding demand for eco-efficient ink technologies across pharmaceuticals, food and beverages, retail packaging, and specialty printing applications.
Asia Pacific
Asia Pacific represents the fastest-growing regional market, supported by rapid industrialization, large-scale manufacturing activity, and expanding consumer electronics and textile sectors. The market value increased from USD 13,395.20 million in 2018 to USD 16,247.28 million in 2024, accounting for 31.9% market share in 2024, the highest among all regions. By 2032, the market is projected to reach USD 26,922.48 million, growing at a CAGR of 6.6%. Key growth drivers include rising packaging demand from e-commerce, cost-efficient production capabilities, and accelerated adoption of digital and industrial inkjet technologies across China, Japan, India, South Korea, and Southeast Asia.
Latin America
Latin America shows gradual but consistent growth in the Inkjet Printers Market, supported by expanding industrial manufacturing, packaging, retail labeling, and small-business printing needs. The regional market stood at USD 1,994.72 million in 2018 and grew to USD 2,324.01 million in 2024, representing 6.8% market share in 2024. By 2032, the market is expected to reach USD 3,299.38 million, advancing at a CAGR of 4.6%. Demand is driven by greater adoption of digital printing in logistics, food and beverages, pharmaceuticals, and commercial printing services, along with rising investments in automated coding and product traceability solutions across emerging economies.
Middle East
The Middle East Inkjet Printers Market continues to expand, supported by industrial automation, infrastructure development, and increasing demand for product identification and packaging labeling in manufacturing hubs. The market was valued at USD 1,128.40 million in 2018 and reached USD 1,226.27 million in 2024, contributing 3.5% market share in 2024. By 2032, the market is projected to rise to USD 1,667.66 million, reflecting a CAGR of 4.0%. Growth is encouraged by diversification initiatives in non-oil industries, expansion of retail and logistics networks, and rising preference for durable, high-resolution industrial and commercial inkjet printing solutions.
Africa
Africa presents emerging growth potential in the Inkjet Printers Market, driven by gradual industrial expansion, infrastructure development, and increasing demand for packaging, logistics labeling, and small-office printing applications. The market value increased from USD 829.92 million in 2018 to USD 1,269.61 million in 2024, accounting for 6.9% market share in 2024. By 2032, the market is forecast to reach USD 1,705.10 million, growing at a CAGR of 3.4%. Growth is supported by modernization of manufacturing facilities, expanding consumer markets, and rising adoption of affordable desktop, industrial, and multifunctional inkjet solutions across key African economies and emerging urban centers.
Inkjet Printers Market Segmentations:
By Type
- Multifunctional Printers
- Desktop Printers
- Large Format Printers
- Inkjet Press
- Industrial Inkjet Printers
- Textile Printers
- Others
By Technology
- Continuous Inkjet
- Drop on Demand
- UV Inkjet
- Others
By End-Use
- Consumer
- Education
- Industrial
- Packaging
- Publishing
- Photography
- Textile
- Pharmaceutical
- Others
By Geography
- North America
- Europe
- Germany
- France
- U.K.
- Italy
- Spain
- Rest of Europe
- Asia Pacific
- China
- Japan
- India
- South Korea
- South-east Asia
- Rest of Asia Pacific
- Latin America
- Brazil
- Argentina
- Rest of Latin America
- Middle East & Africa
- GCC Countries
- South Africa
- Rest of the Middle East and Africa
Competitive Landscape
Competitive landscape analysis of the Inkjet Printers Market highlights the presence of major players such as HP Development Company L.P., Canon Inc., Seiko Epson Corporation, Brother Industries Ltd., Xerox Corporation, Konica Minolta Inc., Mimaki Engineering Co., Ltd., KEYENCE Corporation, Videojet Technologies Inc., and CONTROL PRINT LTD. These companies focus on innovation-driven strategies, including advanced print-head technology, ink formulation development, UV and textile printing enhancements, and automation-enabled industrial printing solutions. Market leaders continue to expand product portfolios across multifunctional, large-format, industrial, and packaging applications while strengthening distribution networks and aftermarket service offerings. Strategic initiatives such as mergers, partnerships, and OEM collaborations support technology integration and regional expansion. Increasing investment in sustainable printing, cloud-connected workflows, and AI-enabled maintenance further enhances performance differentiation. At the same time, vendors emphasize cost-efficiency, print quality, and material compatibility to address evolving customer needs across consumer, commercial, and industrial environments, shaping a highly dynamic and innovation-centric competitive environment.
Shape Your Report to Specific Countries or Regions & Enjoy 30% Off!
Key Player Analysis
- Videojet Technologies Inc.
- Pannier Corporation
- Canon Inc.
- HP Development Company, L.P.
- Xerox Corporation
- Brother Industries, Ltd.
- KEYENCE CORPORATION
- Konica Minolta, Inc.
- Seiko Epson Corporation
- Mimaki
- InkJet, Inc.
- CONTROL PRINT LTD.
Recent Developments
- In November 2025, Markem-Imaje launched an enhanced 9712 Bi-Jet inkjet printer model with a new printhead configuration for high-speed and high-precision coding applications, addressing needs in packaging and industrial sectors.
- In August 2025, Xerox entered into a partnership with Kyocera Document Solutions Inc. to source high-speed cut-sheet inkjet production presses, marking its strategic return to the inkjet press market with expanded production print offerings.
- In October 2025, Keypoint Intelligence and 42 Technology formed a strategic collaboration to accelerate innovation in digital print, inkjet, and packaging technologies across the print industry.
Report Coverage
The research report offers an in-depth analysis based on Type, Technology, End Use and Geography. It details leading market players, providing an overview of their business, product offerings, investments, revenue streams, and key applications. Additionally, the report includes insights into the competitive environment, SWOT analysis, current market trends, as well as the primary drivers and constraints. Furthermore, it discusses various factors that have driven market expansion in recent years. The report also explores market dynamics, regulatory scenarios, and technological advancements that are shaping the industry. It assesses the impact of external factors and global economic changes on market growth. Lastly, it provides strategic recommendations for new entrants and established companies to navigate the complexities of the market.
Future Outlook
- The market will continue to grow as digital and on-demand printing adoption increases across industrial, packaging, and commercial applications.
- Inkjet technology will gain wider acceptance in textile, décor, and customized printing due to flexibility, design capability, and faster turnaround cycles.
- Industrial coding, marking, and traceability requirements will strengthen demand for high-speed and durable inkjet printing solutions.
- Advancements in print-head precision, UV curing, and ink chemistry will enhance print durability, resolution, and material compatibility.
- Cloud connectivity, IoT integration, and AI-based diagnostics will improve printer reliability, monitoring, and predictive maintenance.
- Sustainability initiatives will drive higher use of eco-efficient inks, energy-efficient systems, and waste-reduction printing workflows.
- The market will witness increased adoption of multifunctional and compact desktop inkjet devices in home and small-office environments.
- Expansion of e-commerce, logistics, and labeling applications will create strong growth opportunities for packaging-focused inkjet solutions.
- Hybrid printing systems combining digital and conventional workflows will gain traction in commercial and industrial printing ecosystems.
- Emerging markets will play a significant role in market expansion as manufacturing growth and digital transformation accelerate.


