| REPORT ATTRIBUTE |
DETAILS |
| Historical Period |
2020-2023 |
| Base Year |
2024 |
| Forecast Period |
2025-2032 |
| Metagenomics Market Size 2024 |
USD 2,325.77 million |
| Metagenomics Market, CAGR |
13.82% |
| Metagenomics Market Size 2032 |
USD 6,518.54 million |
Market Overview:
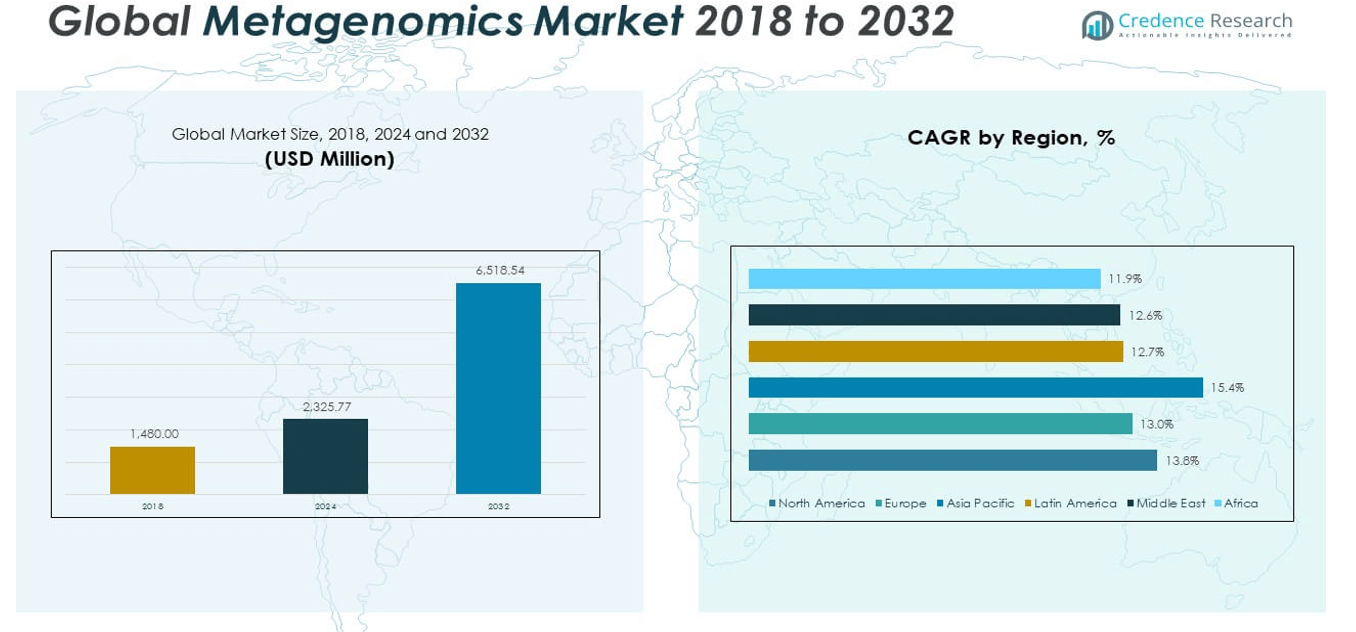
The Global Metagenomics Market size was valued at USD 1,480.00 million in 2018 to USD 2,325.77 million in 2024 and is anticipated to reach USD 6,518.54 million by 2032, at a CAGR of 13.82% during the forecast period.
Multiple factors contribute to the strong market momentum. A key driver is the continued reduction in sequencing costs enabled by next-generation and third-generation platforms, which allow for faster, more accurate, and scalable genome analysis. Technologies such as long-read sequencing and single-cell genomics have made it easier to capture complex microbial ecosystems. Another major driver is the expanding range of applications. In healthcare, metagenomics enables rapid pathogen detection and microbiome profiling to support personalized medicine and infectious disease diagnostics. In agriculture, it plays a critical role in soil health monitoring and precision farming practices. Environmental agencies and research institutions apply metagenomic methods to assess biodiversity and detect pollutants. Food and beverage companies use it to improve microbial safety and optimize fermentation processes. The third key factor is the growth of bioinformatics tools that manage and interpret the massive volumes of data generated by sequencing. AI-driven analytics, cloud-based platforms, and user-friendly software solutions are helping researchers and companies make better use of genomic insights.
Regionally, North America leads the Global Metagenomics Market in terms of revenue and technological adoption. The presence of key sequencing technology providers, strong research funding, and a mature healthcare infrastructure continue to support market leadership in the region. The United States, in particular, has been a frontrunner in clinical metagenomics, microbiome therapeutics, and agricultural genomics. Europe holds the second-largest share, driven by government-backed research programs, environmental monitoring mandates, and industrial innovation. Countries such as Germany, the United Kingdom, and France play prominent roles in advancing metagenomic applications. Asia Pacific is the fastest-growing region, with countries like China, India, and Japan investing heavily in genomics research, diagnostic infrastructure, and agricultural innovation. China’s role is further strengthened by the expansion of domestic sequencing capabilities and collaborations with global players. Latin America, the Middle East, and Africa represent emerging markets. Though their current contributions remain modest, ongoing developments in public health surveillance, ecological monitoring, and agricultural biotechnology are gradually expanding regional demand. These areas are expected to contribute increasingly to global growth as infrastructure and awareness improve.
Market Insights:
- The Global Metagenomics Market grew from USD 1,480.00 million in 2018 to USD 2,325.77 million in 2024 and is projected to reach USD 6,518.54 million by 2032, driven by increasing cross-sector adoption and a CAGR of 13.82%.
- Continuous improvements in next-generation and third-generation sequencing technologies are reducing cost barriers and enabling more accurate, scalable analysis of complex microbial communities.
- Metagenomics is gaining prominence in clinical diagnostics by supporting rapid, unbiased pathogen detection, antibiotic resistance tracking, and personalized microbiome-based therapies.
- Adoption is expanding across agriculture and environmental sectors where metagenomics enhances soil health monitoring, biodiversity tracking, and pollution analysis to support sustainability goals.
- Advanced bioinformatics infrastructure, including AI-based tools and cloud platforms, is helping researchers manage and interpret the large volumes of metagenomic data with greater accuracy and speed.
- The market faces key challenges such as high instrument costs, lack of workflow standardization, and the need for specialized bioinformatics expertise, which limit adoption in resource-constrained settings.
- North America leads the market in revenue and technology use, Europe follows with strong public research backing, and Asia Pacific emerges as the fastest-growing region with rising investments in genomics.
Access crucial information at unmatched prices!
Request your sample report today & start making informed decisions powered by Credence Research Inc.!
Download Sample
Market Drivers:
Advancements in Sequencing Technologies and Cost Reduction Are Widening Accessibility:
The Global Metagenomics Market is benefitting from rapid improvements in sequencing platforms, which continue to lower the cost and time required for metagenomic analysis. High-throughput systems such as Illumina’s NovaSeq and long-read technologies from PacBio and Oxford Nanopore are enhancing sequencing precision and coverage. These innovations support detailed analysis of microbial communities without the need for culturing. As sequencing becomes more affordable, institutions across healthcare, agriculture, and environmental sectors are increasingly investing in metagenomic capabilities. It has shifted from being a tool reserved for specialized research labs to a practical method in commercial and clinical settings. Declining per-sample costs and scalable workflows are expanding its use across global markets.
- For instance, Illumina’s NovaSeq X Series, launched in 2023, can generate up to 20,000 whole genomes per year on a single instrument, reducing the cost of whole-genome sequencing to below $200 per genome and supporting large-scale metagenomic studies with unprecedented throughput and accuracy.
Rising Application in Clinical Diagnostics and Infectious Disease Surveillance:
Healthcare institutions are incorporating metagenomic sequencing into diagnostic workflows to improve the speed and accuracy of pathogen detection. Unlike traditional methods, metagenomics enables unbiased detection of all microbial DNA within a sample, including unknown or unexpected pathogens. It supports faster diagnosis of infectious diseases, particularly in cases where conventional culture methods fail or provide limited information. The Global Metagenomics Market is gaining traction in hospitals, academic medical centers, and reference laboratories for its ability to uncover complex microbial interactions and antibiotic resistance markers. It is also being explored for its role in cancer diagnostics, respiratory illness monitoring, and microbiome-based treatment development. Broader adoption is supported by a shift toward personalized medicine and increasing awareness of microbiome health.
- For instance, the IDbyDNA Explify Platform, used in over 100 clinical laboratories worldwide, enables the identification of more than 50,000 pathogens from a single sample, providing actionable results in less than 24 hours for infectious disease diagnostics.
Growing Integration of Metagenomics in Agricultural and Environmental Applications:
Agricultural producers and environmental agencies are leveraging metagenomics to manage soil health, monitor biodiversity, and address contamination. In agriculture, soil and root microbiome analysis is helping to optimize crop yields, reduce pesticide use, and support sustainable farming practices. It provides insights into microbial interactions that influence plant growth and disease resistance. The Global Metagenomics Market is also expanding through its use in environmental monitoring, where it supports the analysis of water quality, pollution impact, and ecosystem shifts. Government and academic initiatives are funding projects aimed at cataloging microbial diversity across forests, oceans, and urban areas. These applications strengthen market demand beyond healthcare and extend the technology’s relevance to climate, conservation, and food security efforts.
Expansion of Bioinformatics Infrastructure and Software Solutions Supporting Data Analysis:
The volume and complexity of data generated by metagenomic sequencing demand robust computational tools. Market growth is supported by advances in bioinformatics platforms that simplify data interpretation and automate workflows. Cloud-based systems, AI-driven analytics, and visualization software are making metagenomic insights more accessible to non-specialists. The Global Metagenomics Market benefits from collaborations between sequencing companies, software developers, and research institutions aiming to standardize analysis pipelines. It is also seeing growth in demand for subscription-based software solutions that support long-term genomic research. Enhanced data security, user-friendly interfaces, and integration with laboratory systems are driving adoption across diagnostic, agricultural, and academic sectors.
Market Trends:
Shift Toward Portable and Point-of-Care Sequencing Devices:
Technological advancements are driving a shift toward portable sequencing platforms that support rapid and decentralized metagenomic testing. Handheld devices like Oxford Nanopore’s MinION are gaining adoption in field-based applications, including outbreak response, agricultural testing, and environmental surveys. These tools eliminate the need for complex lab infrastructure and enable real-time data generation in remote or resource-limited settings. The Global Metagenomics Market is witnessing increased demand from organizations that require mobility, speed, and flexibility in their operations. It supports field diagnostics in low- and middle-income countries, where infrastructure and turnaround time are critical constraints. Growing interest in near-patient testing for public health and surveillance is reinforcing the importance of portable sequencing technologies.
- For instance, Oxford Nanopore MinION device has been deployed in more than 100 countries, sold by 2024, and was used for real-time Ebola and SARS-CoV-2 surveillance in field settings, delivering sequencing results within six hours of sample collection.
Growing Focus on Functional Metagenomics for Enzyme and Drug Discovery:
Researchers are increasingly shifting from taxonomic profiling toward functional metagenomics to identify novel genes and biochemical functions within microbial communities. This trend supports the discovery of enzymes, antimicrobial compounds, and other bioactive molecules with industrial and pharmaceutical value. Functional metagenomics involves screening large metagenomic libraries to uncover metabolic pathways or resistance traits that are not detectable through sequencing alone. The Global Metagenomics Market is evolving to accommodate this focus by integrating screening tools, expression systems, and high-throughput assays into the research workflow. It is opening new commercial opportunities in sectors such as biotechnology, pharmaceuticals, and synthetic biology. Companies are exploring metagenomes from extreme environments like deep-sea vents or acidic hot springs for novel therapeutic and industrial applications.
- For instance, researchers using Thermo Fisher Scientific’s Ion Torrent platform screened over 10 million environmental DNA clones in 2023, leading to the discovery of more than 200 novel enzymes with industrial biocatalysis potential.
Collaboration Between Academia, Industry, and Government for Microbiome Initiatives:
Public–private partnerships are playing a pivotal role in advancing large-scale metagenomic studies and data sharing frameworks. Governments are funding national microbiome initiatives, while academic institutions collaborate with biotech firms to accelerate discovery and commercialization. The Global Metagenomics Market benefits from coordinated efforts such as the Human Microbiome Project, Earth Microbiome Project, and various country-specific biodiversity programs. These collaborations are generating extensive reference datasets that improve comparative analysis and support regulatory validation. It is also strengthening standardization of protocols and sequencing metrics across labs and institutions. This trend is driving consistency and transparency in metagenomic research and fostering a collaborative ecosystem.
Expansion of Metagenomics into Consumer Health and Wellness Products:
Metagenomic insights are extending beyond medical research into consumer products that promote gut health, skin microbiome balance, and personalized nutrition. Companies are launching microbiome-based supplements, skincare formulations, and dietary plans backed by metagenomic testing. The Global Metagenomics Market is now intersecting with direct-to-consumer health platforms offering test kits that analyze microbial diversity and provide tailored lifestyle recommendations. It supports growing consumer interest in preventive health and wellness optimization. Brands are using sequencing data to market the efficacy of probiotics, prebiotics, and cosmetic products. This trend is transforming microbiome science from a laboratory concept into a tool for personalized consumer engagement.
Market Challenges Analysis:
High Cost of Instruments, Complex Data Interpretation, and Limited Standardization:
The Global Metagenomics Market faces significant barriers related to high instrument costs and operational complexity. Advanced sequencing platforms and supporting infrastructure require substantial capital investment, making them inaccessible to smaller labs and institutions in developing regions. Despite falling per-sample sequencing costs, the total expense—including consumables, skilled labor, and data analysis tools—remains high. Interpreting metagenomic data also demands specialized bioinformatics expertise, which limits widespread adoption. Standardization challenges persist across workflows, from sample preparation to sequencing and downstream analysis. This lack of consistency affects data comparability across studies and complicates regulatory approval in clinical settings.
Regulatory Hurdles and Limited Clinical Validation Impact Market Expansion:
Regulatory frameworks for clinical metagenomics remain underdeveloped, particularly in diagnostics and therapeutics. Health authorities require rigorous validation of sequencing-based tests, yet metagenomic workflows often lack clear benchmarks or consensus protocols. The Global Metagenomics Market struggles to establish uniform quality controls that can satisfy clinical, agricultural, and environmental regulatory bodies. Limited clinical trials and insufficient outcome-based evidence further delay product approvals and reimbursement decisions. Concerns about data privacy, especially in human microbiome studies, introduce additional layers of compliance risk. It must navigate evolving legal standards while demonstrating consistent clinical utility to gain broader acceptance across regulated industries.
Market Opportunities:
Rising Demand for Personalized Medicine and Microbiome-Based Therapeutics:
The Global Metagenomics Market holds strong potential in personalized medicine, particularly in microbiome-guided diagnostics and treatment. Growing interest in gut health, immune modulation, and chronic disease management creates new opportunities for metagenomic profiling. Pharmaceutical companies are investing in microbiome-based drug discovery, targeting metabolic, neurological, and autoimmune conditions. It supports development of precision therapies that align with individual microbial compositions. Diagnostic firms can also expand test menus to include microbiome analysis for early disease detection and treatment response tracking. Consumer health brands are entering the market with personalized wellness products based on metagenomic data.
Emerging Applications in Environmental Sustainability and Agricultural Innovation:
The market can capitalize on growing demand for tools that support environmental sustainability and agricultural resilience. Metagenomics enables real-time monitoring of soil and water microbiomes, improving crop yield and ecological restoration. The Global Metagenomics Market can serve food security initiatives and climate resilience programs through microbial-based solutions. Governments and NGOs are funding ecosystem sequencing projects that require scalable metagenomic services. It also supports development of biofertilizers and pest control alternatives rooted in microbial community insights. Expanding use in precision agriculture and environmental genomics presents long-term growth prospects.
Market Segmentation Analysis:
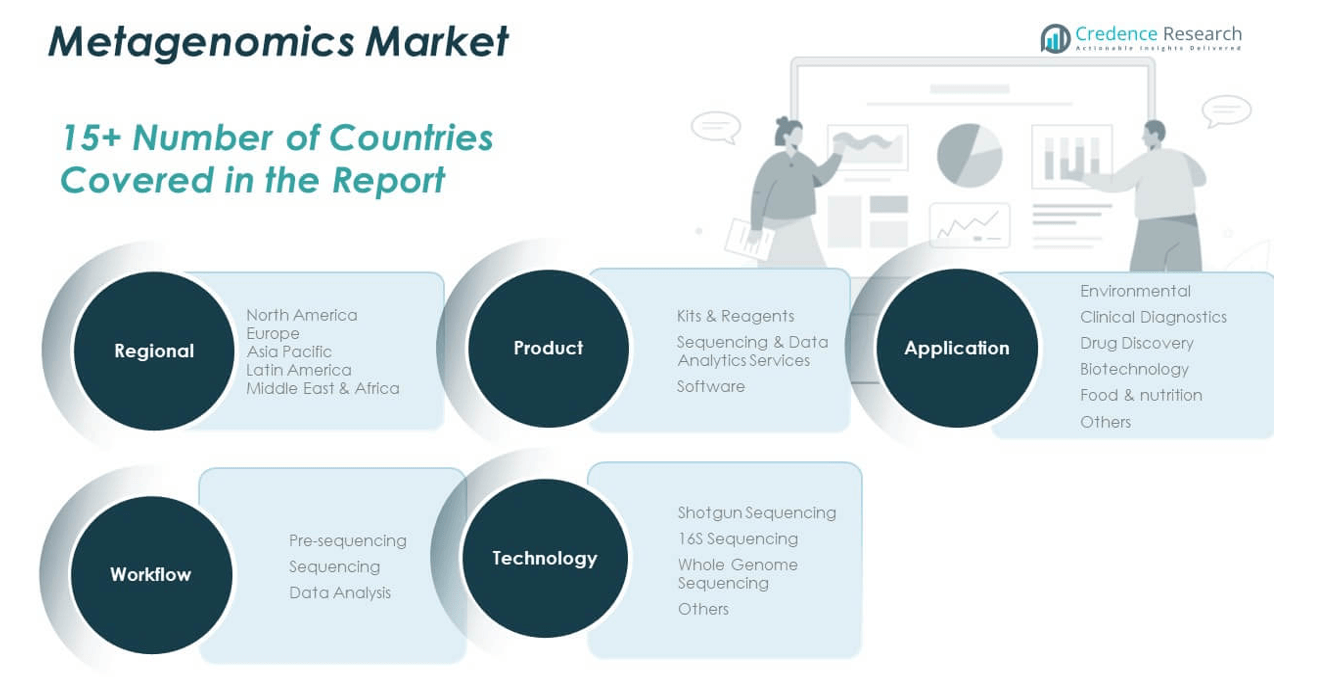
By Product
The Global Metagenomics Market includes kits & reagents, sequencing & data analytics services, and software. Kits & reagents dominate due to their essential role in sample preparation and consistent usage across labs. Sequencing & data analytics services are expanding with rising outsourcing trends among academic and clinical institutions. Software is emerging as a critical tool, driven by demand for automated, user-friendly, and AI-integrated analysis platforms.
- For instance, QIAGEN’s QIAamp DNA Mini Kit has been cited in over 10,000 peer-reviewed metagenomics studies for its efficiency in extracting high-quality microbial DNA, supporting both research and clinical applications worldwide.
By Application
Environmental applications lead the market, with metagenomics used extensively in soil, water, and biodiversity monitoring. Clinical diagnostics is a high-growth segment, where metagenomic sequencing supports pathogen identification and microbiome research. Drug discovery and biotechnology rely on functional metagenomics to identify novel genes, enzymes, and microbial pathways. Food & nutrition applications focus on improving fermentation processes and ensuring microbial safety. Others include niche uses such as forensic analysis and renewable energy research.
- For instance, the Earth Microbiome Project, powered by Illumina sequencing, has cataloged over 200,000 environmental samples from more than 40 countries, generating one of the world’s largest reference databases for soil and water microbiome analysis.
By Workflow
The market is structured into pre-sequencing, sequencing, and data analysis stages. Pre-sequencing covers DNA extraction and library preparation. Sequencing involves the core process of microbial genome reading. Data analysis is increasingly important due to the complexity and scale of sequencing outputs. Each stage is seeing investments in automation and standardization.
By Technology
Shotgun sequencing holds the largest share due to its comprehensive profiling capabilities. 16S sequencing remains widely used for targeted bacterial analysis in clinical and environmental settings. Whole genome sequencing is gaining traction for detailed microbial characterization. Others include advanced approaches such as metatranscriptomics and single-cell metagenomics.
Segmentation:
By Product
- Kits & Reagents
- Sequencing & Data Analytics Services
- Software
By Application
- Environmental
- Clinical Diagnostics
- Drug Discovery
- Biotechnology
- Food & Nutrition
- Others
By Workflow
- Pre-sequencing
- Sequencing
- Data Analysis
By Technology
- Shotgun Sequencing
- 16S Sequencing
- Whole Genome Sequencing
- Others
By Region
- North America
- Europe
- UK
- France
- Germany
- Italy
- Spain
- Russia
- Rest of Europe
- Asia Pacific
- China
- Japan
- South Korea
- India
- Australia
- Southeast Asia
- Rest of Asia Pacific
- Latin America
- Brazil
- Argentina
- Rest of Latin America
- Middle East
- GCC Countries
- Israel
- Turkey
- Rest of Middle East
- Africa
- South Africa
- Egypt
- Rest of Africa
Regional Analysis:
North America
The North America Metagenomics Market size was valued at USD 595.85 million in 2018 to USD 926.11 million in 2024 and is anticipated to reach USD 2,592.43 million by 2032, at a CAGR of 13.8% during the forecast period. North America holds the largest share of the Global Metagenomics Market, driven by robust research funding, advanced sequencing infrastructure, and high adoption of clinical metagenomics. The United States remains the key contributor, supported by strong academic–industry partnerships and the presence of companies like Illumina, Thermo Fisher Scientific, and QIAGEN. It leads in clinical diagnostics, drug discovery, and agricultural metagenomics. Government-backed microbiome initiatives and regulatory clarity support the region’s leadership. The demand for metagenomic tools in hospital labs and biotech firms continues to accelerate adoption across the U.S. and Canada.
Europe
The Europe Metagenomics Market size was valued at USD 368.08 million in 2018 to USD 554.63 million in 2024 and is anticipated to reach USD 1,463.10 million by 2032, at a CAGR of 13.0% during the forecast period. Europe is the second-largest regional market, with strong contributions from Germany, the United Kingdom, and France. The region benefits from public health genomics programs, microbiome-focused research, and environmental monitoring regulations. It shows strong momentum in applications such as food safety, wastewater analysis, and biodiversity mapping. The Global Metagenomics Market sees Europe advancing through cross-border academic collaboration and funding from EU-backed research programs. Regional companies and research centers are investing in software development and automation for metagenomic workflows.
Asia Pacific
The Asia Pacific Metagenomics Market size was valued at USD 320.42 million in 2018 to USD 528.75 million in 2024 and is anticipated to reach USD 1,654.41 million by 2032, at a CAGR of 15.4% during the forecast period. Asia Pacific is the fastest-growing region in the Global Metagenomics Market, led by China, India, Japan, and South Korea. National genomics programs, rising healthcare infrastructure, and growing interest in microbiome-based therapies are supporting rapid growth. China’s BGI is expanding sequencing capacity, while India is scaling microbiome research across agriculture and clinical applications. Regional governments are funding biodiversity and environmental metagenomics studies. Demand is increasing for data analytics tools and portable sequencing devices that support large-scale studies.
Latin America
The Latin America Metagenomics Market size was valued at USD 85.54 million in 2018 to USD 133.01 million in 2024 and is anticipated to reach USD 343.33 million by 2032, at a CAGR of 12.7% during the forecast period. Latin America is an emerging region with increasing awareness of metagenomic tools in public health, environmental protection, and food safety. Brazil and Mexico lead regional demand, with institutions expanding their capacity for microbiome and pathogen research. The Global Metagenomics Market is gaining interest here through international collaborations and disease surveillance initiatives. Academic labs and public health agencies are integrating sequencing in infectious disease response. Growth remains constrained by cost and limited infrastructure, but pilot programs and government support are improving access.
Middle East
The Middle East Metagenomics Market size was valued at USD 64.38 million in 2018 to USD 95.57 million in 2024 and is anticipated to reach USD 245.13 million by 2032, at a CAGR of 12.6% during the forecast period. The Middle East is gradually adopting metagenomic technologies in academic, agricultural, and public health sectors. Countries such as Israel and the UAE are leading with investments in genomics research and precision medicine. It is seeing growing deployment of metagenomics in water quality testing and environmental sustainability projects. Regional universities are forming partnerships to advance microbial genomics in food production and health monitoring. Market growth is supported by funding for innovation hubs and research facilities focused on biotechnology.
Africa:
The Africa Metagenomics Market size was valued at USD 45.73 million in 2018 to USD 87.69 million in 2024 and is anticipated to reach USD 220.13 million by 2032, at a CAGR of 11.9% during the forecast period. Africa represents a nascent but expanding market driven by demand for infectious disease control, ecosystem monitoring, and agricultural resilience. South Africa and Egypt are leading regional activity, supported by international funding and partnerships with global research institutions. The Global Metagenomics Market is slowly expanding across African research networks involved in microbiome mapping and soil health projects. Infrastructure constraints and limited skilled workforce remain challenges. New initiatives focused on genome education and training are helping to build regional capabilities.
Shape Your Report to Specific Countries or Regions & Enjoy 30% Off!
Key Player Analysis:
- Bio-Rad Laboratories, Inc.
- Illumina, Inc.
- PerkinElmer, Inc.
- Thermo Fisher Scientific, Inc.
- Novogene Co., Ltd.
- Promega Corporation
- QIAGEN
- Takara Bio, Inc.
- Oxford Nanopore Technologies
- Hoffmann-La Roche Ltd.
Competitive Analysis:
The Global Metagenomics Market is moderately consolidated, with key players focusing on product innovation, strategic partnerships, and service expansion. Companies such as Illumina, Thermo Fisher Scientific, QIAGEN, and Oxford Nanopore Technologies lead the market with advanced sequencing platforms and robust global distribution. Bio-Rad Laboratories, PerkinElmer, and Promega Corporation strengthen their positions through targeted reagent and kit offerings. Novogene and Takara Bio leverage cost-effective sequencing services and regional networks to expand reach. It is seeing increased collaboration between technology developers and academic research centers to accelerate metagenomic applications. Software providers are entering the space with AI-driven analytics to support data-heavy workflows. The competitive landscape continues to evolve with startups and niche players offering customized bioinformatics and cloud-based tools, intensifying the race for innovation and market share.
Recent Developments:
- In July 2025, Bio-Rad Laboratories expanded its Droplet Digital PCR (ddPCR) portfolio with the launch of four new platforms, including the QX Continuum™ and QX700™ series, following the acquisition of Stilla Technologies. This rollout brings the company’s digital PCR offering to over 400,000 assays, delivering high precision, advanced multiplexing, and streamlined workflows for genomics research and diagnostics.
- In July 2025, Novogene Europe announced the installation of its fifth Illumina NovaSeq X Plus sequencing system, significantly expanding its high-throughput sequencing capacity to meet rising demand in Europe. The NovaSeq X Plus can generate up to 16 terabases of data in 48 hours, supporting large-scale genomic and metagenomic studies.In April 2025, Novogene America showcased its 10X Single Cell Spatial RNA Sequencing service at AACR 2025, highlighting its commitment to advanced spatial transcriptomics for cancer and complex disease research.
- In June 2025, Thermo Fisher Scientific unveiled two next-generation mass spectrometers—the Orbitrap Astral Zoom and Orbitrap Excedion Pro—at the ASMS 2025 conference. These instruments offer enhanced analytical performance and speed, supporting advanced proteomics, biopharmaceutical development, and multiomics research, including metagenomics.
- In April 2025, Promega Corporation entered a strategic partnership with EditCo Bio to integrate its HiBiT, HaloTag, and NanoLuc technologies into EditCo’s CRISPR knock-in services. This collaboration enables precise gene editing and functional validation for cell-based assays and drug discovery, strengthening Promega’s presence in functional genomics and metagenomics applications.
Market Concentration & Characteristics:
The Global Metagenomics Market exhibits moderate market concentration, with a few dominant players controlling a significant share through proprietary sequencing platforms, reagent portfolios, and service networks. It is characterized by high entry barriers due to the need for advanced instrumentation, specialized expertise, and regulatory compliance. The market shows strong reliance on technological innovation, particularly in high-throughput sequencing, data analytics, and cloud-based platforms. Demand is driven by research institutions, clinical labs, and environmental agencies, each requiring tailored solutions. It supports long-term growth through recurring consumables, service contracts, and software subscriptions. The market remains highly research-driven, with collaboration between academic and commercial entities shaping new product development and application expansion.
Report Coverage:
The research report offers an in-depth analysis based on product, application, workflow, and technology. It details leading market players, providing an overview of their business, product offerings, investments, revenue streams, and key applications. Additionally, the report includes insights into the competitive environment, SWOT analysis, current market trends, as well as the primary drivers and constraints. Furthermore, it discusses various factors that have driven market expansion in recent years. The report also explores market dynamics, regulatory scenarios, and technological advancements that are shaping the industry. It assesses the impact of external factors and global economic changes on market growth. Lastly, it provides strategic recommendations for new entrants and established companies to navigate the complexities of the market.
Future Outlook:
- Rising adoption of metagenomics in clinical diagnostics will expand its role in infectious disease detection and microbiome-based therapies.
- Advancements in portable sequencing devices will support real-time, field-based microbial analysis.
- Integration of AI and machine learning in bioinformatics platforms will improve accuracy and reduce analysis time.
- Demand for personalized nutrition and wellness solutions will drive consumer-focused metagenomic applications.
- Expanding use in sustainable agriculture will promote soil health monitoring and microbiome-enhanced crop productivity.
- Increased investment in environmental monitoring will support biodiversity assessments and pollution tracking.
- Government-funded microbiome initiatives will accelerate research output and data standardization.
- Growth in sequencing-as-a-service models will make metagenomics more accessible to small labs and start-ups.
- Regional expansion in Asia Pacific and Latin America will be fueled by genomics infrastructure development.
- Regulatory progress and clinical validation will support broader adoption in healthcare and pharma sectors.


