Steam, gas and polymer floods sustain aging Gulf reservoirs
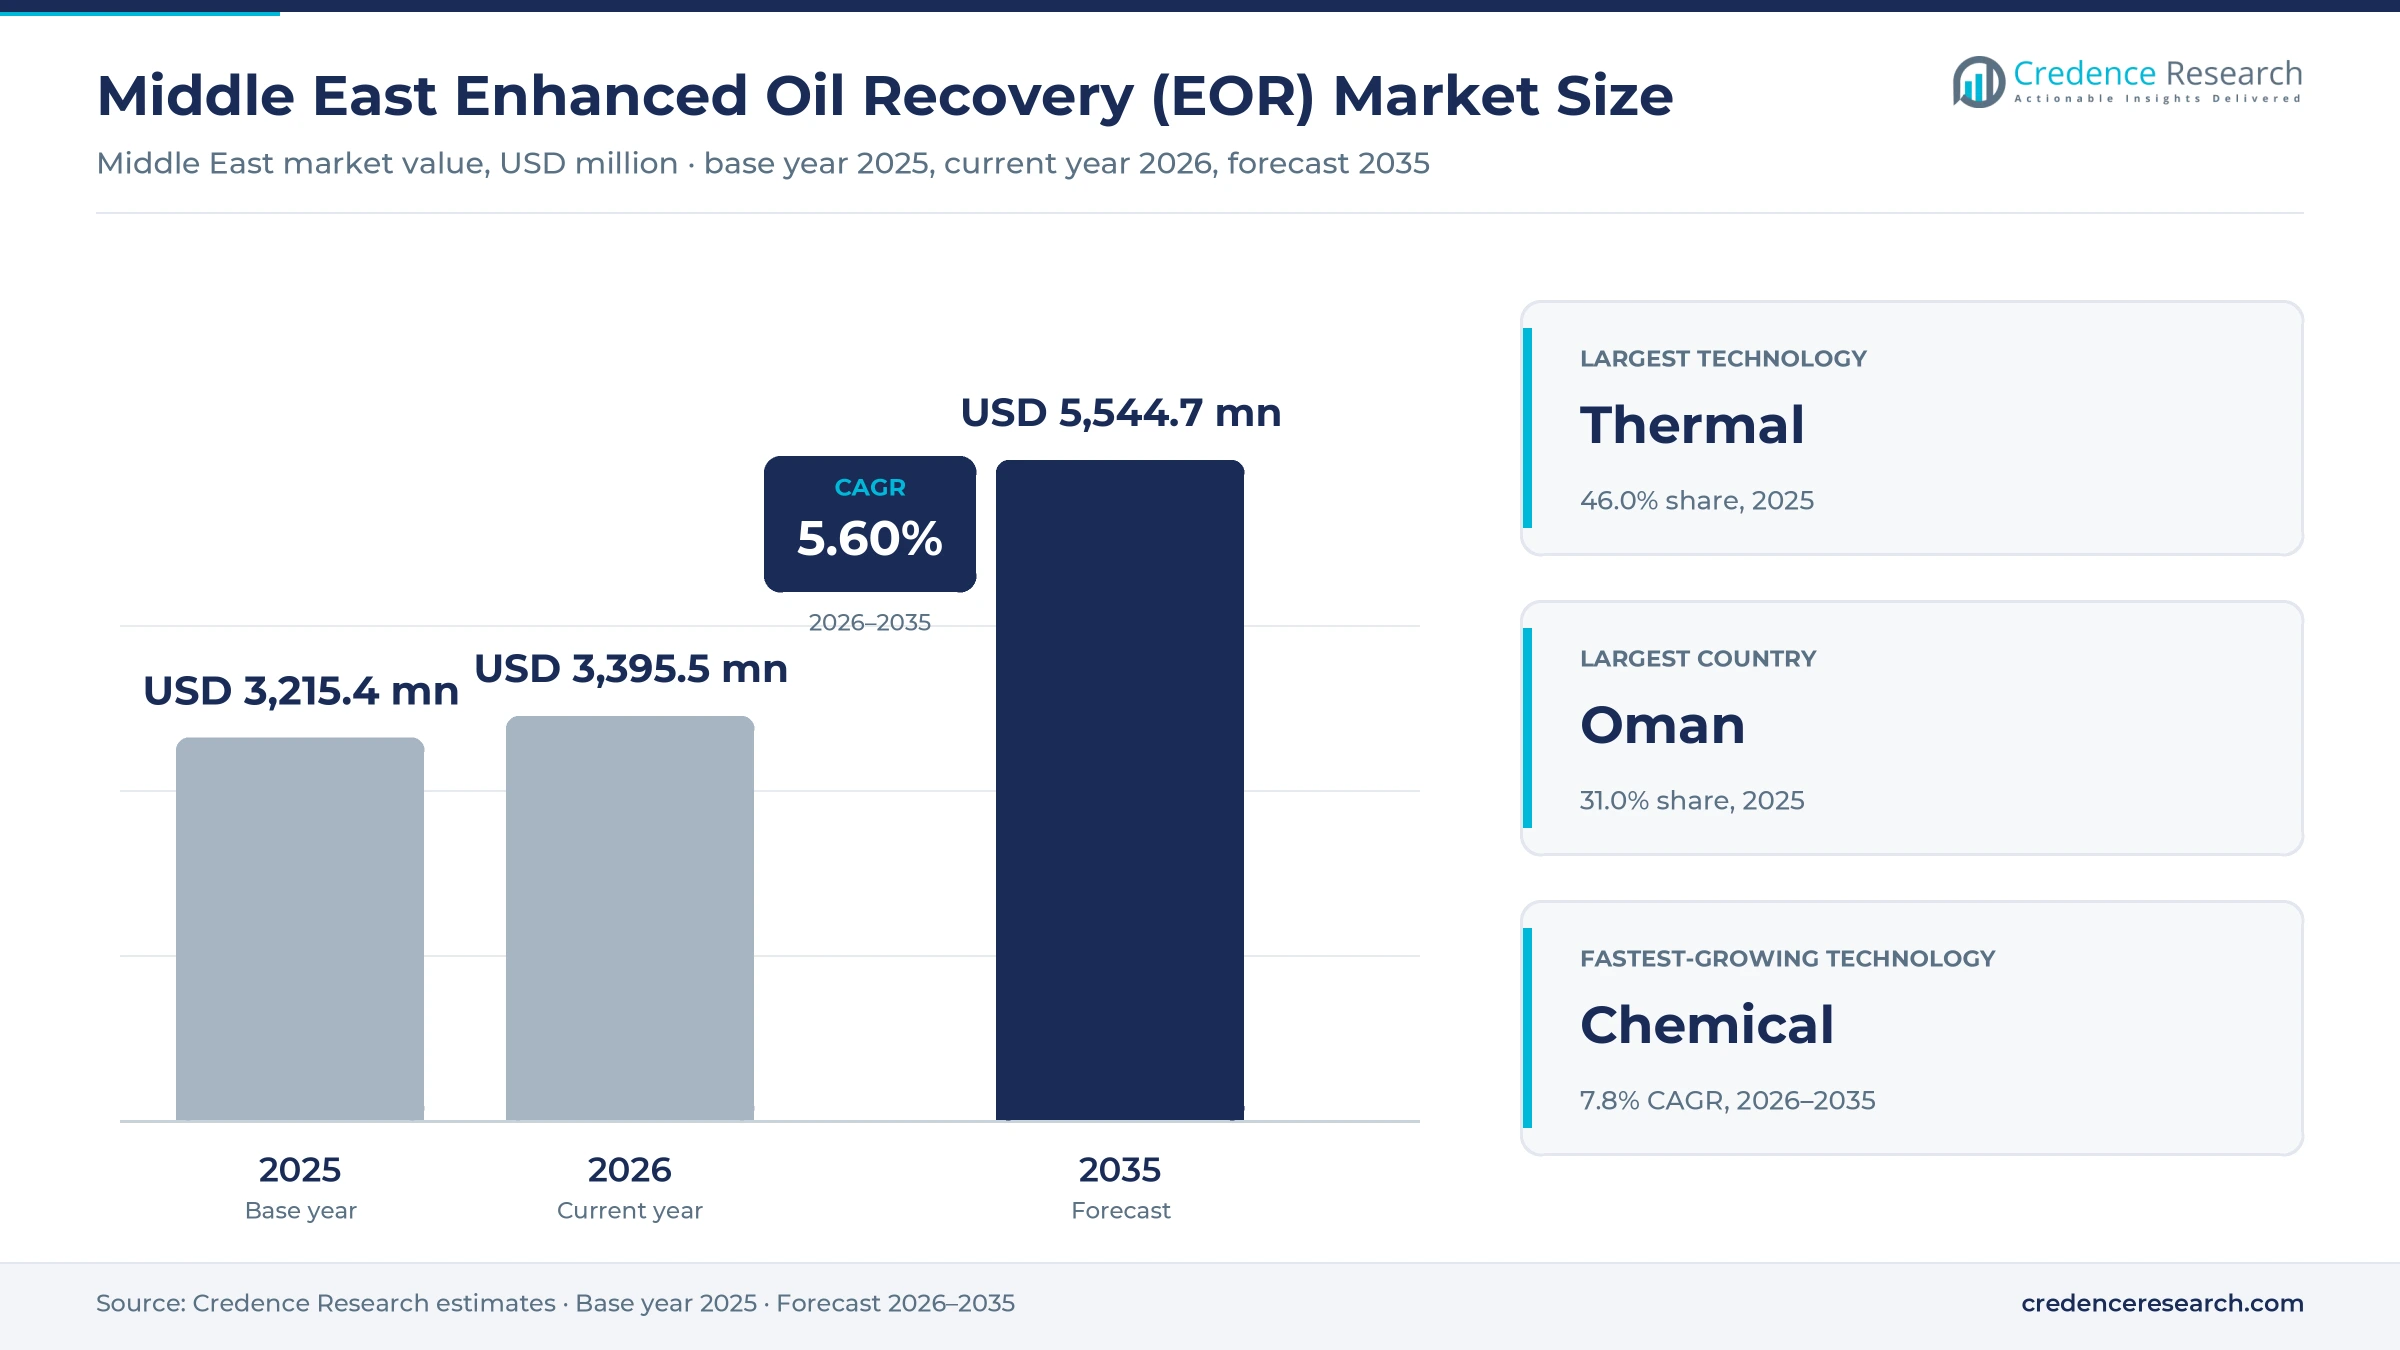
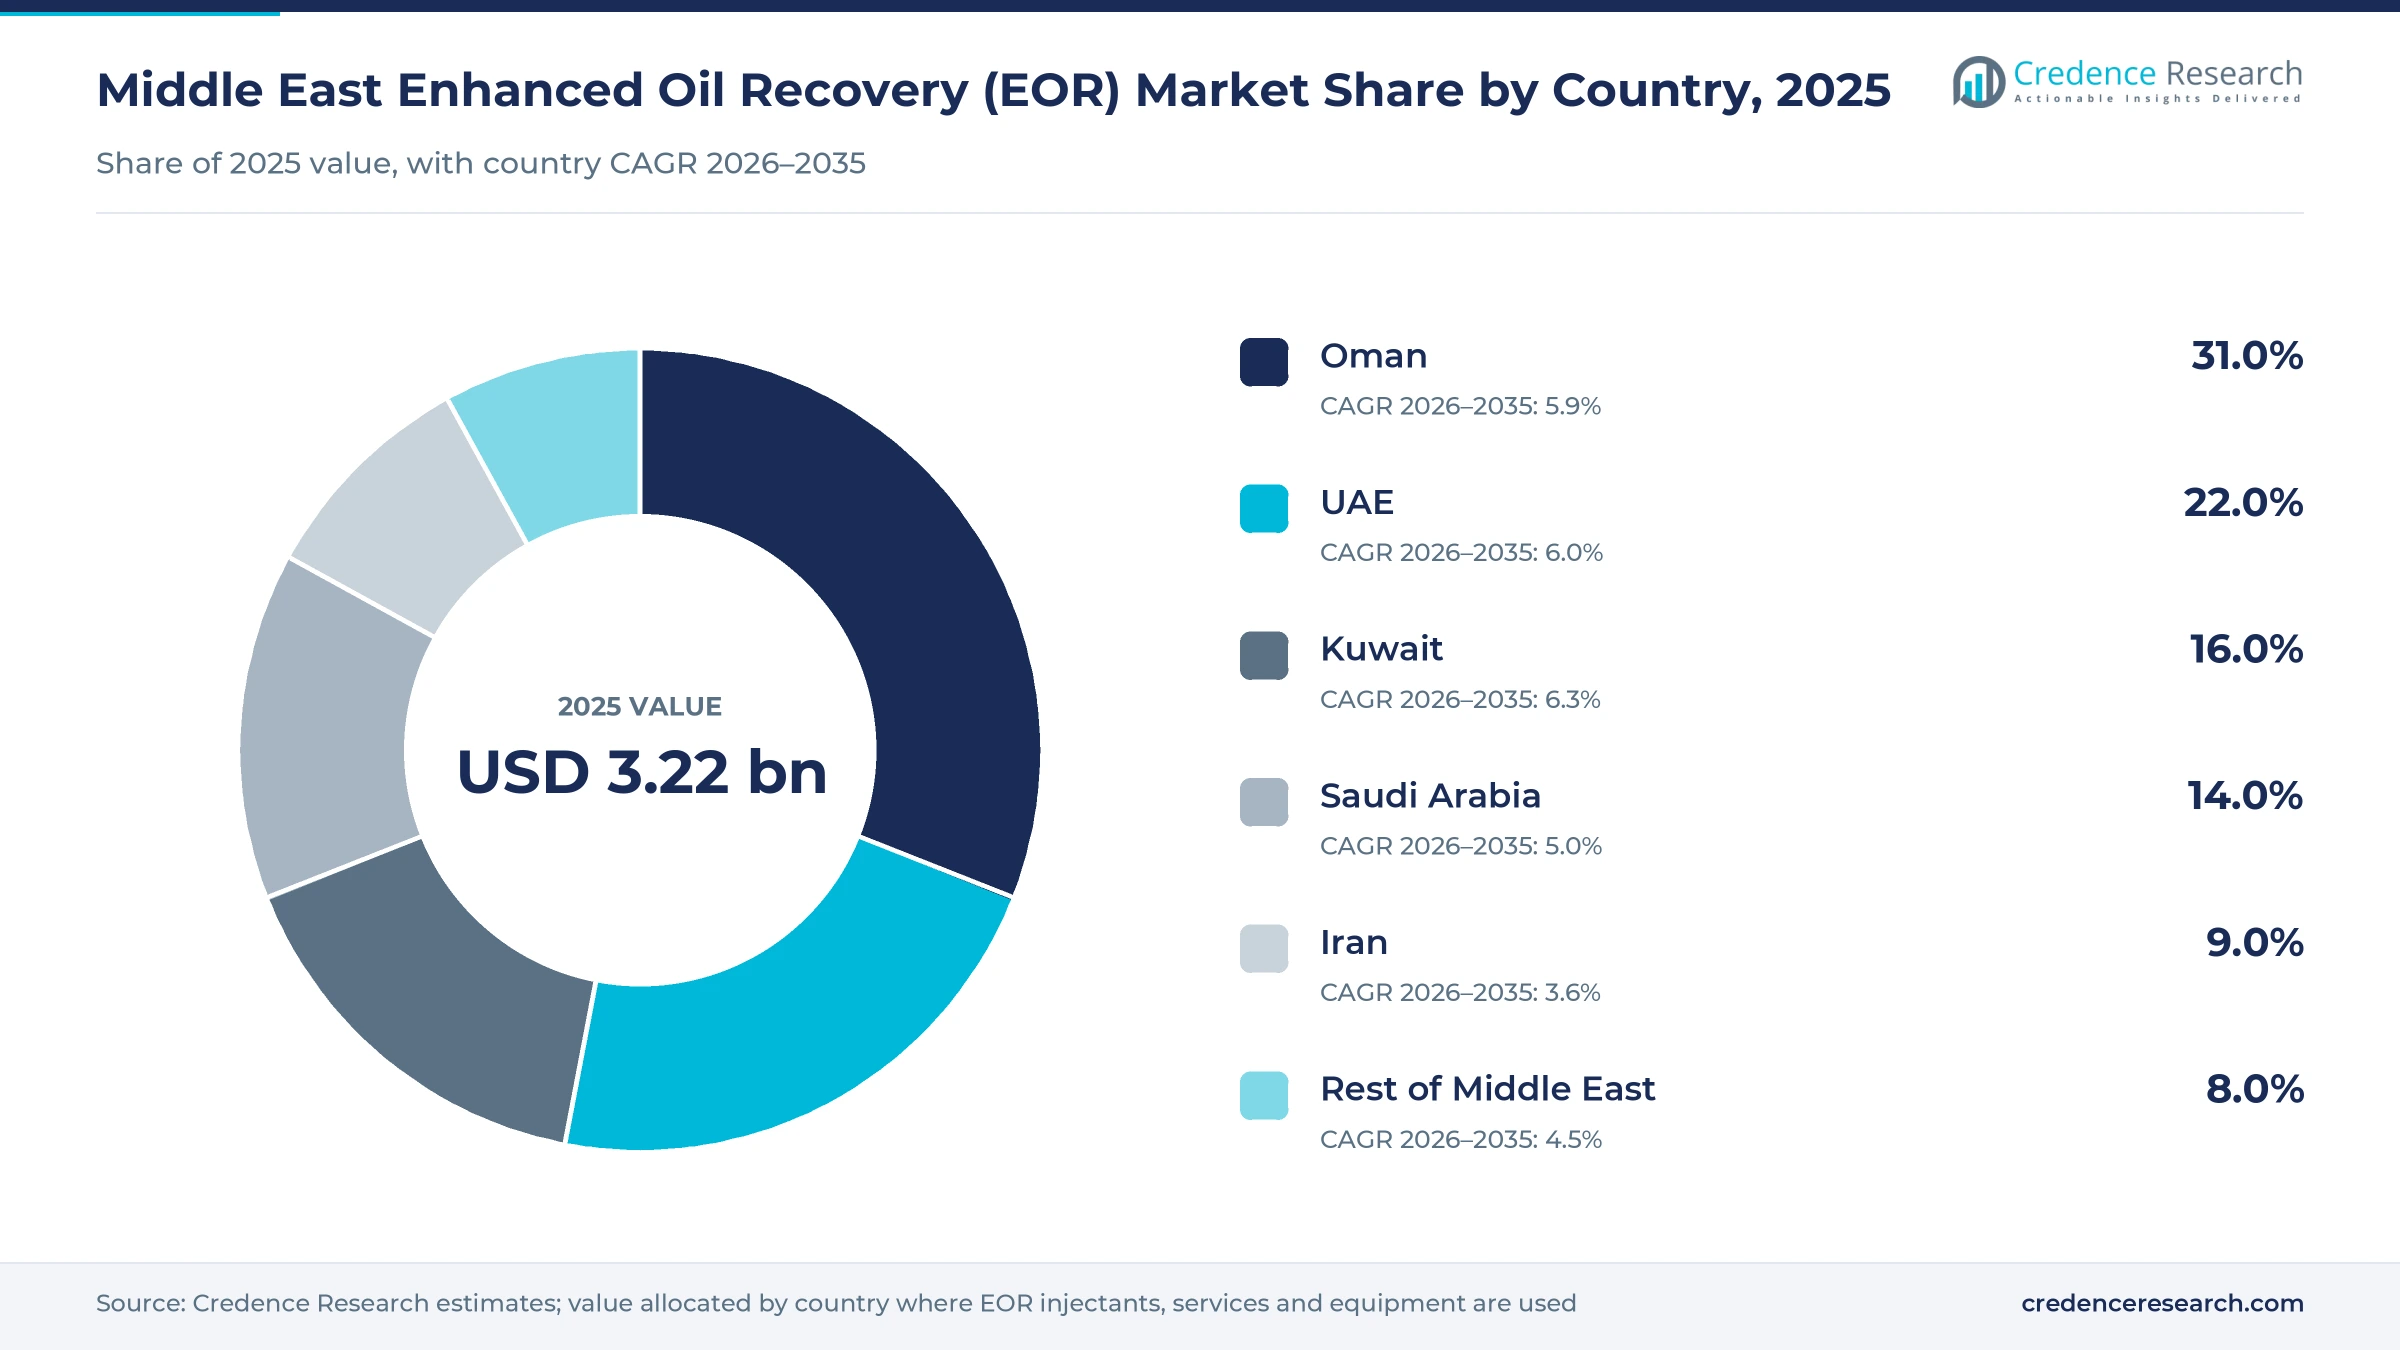
The Middle East enhanced oil recovery (EOR) market was valued at USD 3.22 billion in 2025 and is projected to increase from USD 3.40 billion in 2026 to USD 5.54 billion by 2035, registering a CAGR of 5.60% during 2026–2035. Spending comes from national oil companies and their partners that inject steam, hydrocarbon gas, carbon dioxide or polymer into mature carbonate and heavy oil reservoirs. Oman held the largest country share, 31.0% in 2025, because Petroleum Development Oman and Oxy run the region's largest steam and polymer floods. Kuwait is the fastest-growing country at 6.3% a year in Credence Research estimates, as Kuwait Oil Company prepares the next steam-fed phase of its northern heavy oil fields. The closure of the Strait of Hormuz on Feb. 28, 2026, shut in Gulf output for months, so restart work and delayed contracts shape near-term spending while Oman, outside the Gulf, kept producing.
Injectants, field services and EOR facilities carry the value
The market counts spending on enhanced oil recovery in Middle East fields, which covers steam generation, gas and carbon dioxide supply and compression, polymer and surfactant chemicals, EOR injection wells and the engineering and field services that design and run these floods. Operators buy most of it through long service contracts and project awards.
Primary production, ordinary waterflooding and routine artificial lift are excluded, and the value of the oil produced is not counted. Value moves from chemical makers, gas suppliers and service companies through engineering contractors to national oil companies and their concession partners.
Middle East Enhanced Oil Recovery (EOR) Market Insights
- The Middle East enhanced oil recovery (EOR) market rises from USD 3.22 billion in 2025 to USD 5.54 billion by 2035, a 5.60% CAGR during 2026–2035, as aging fields need injection.
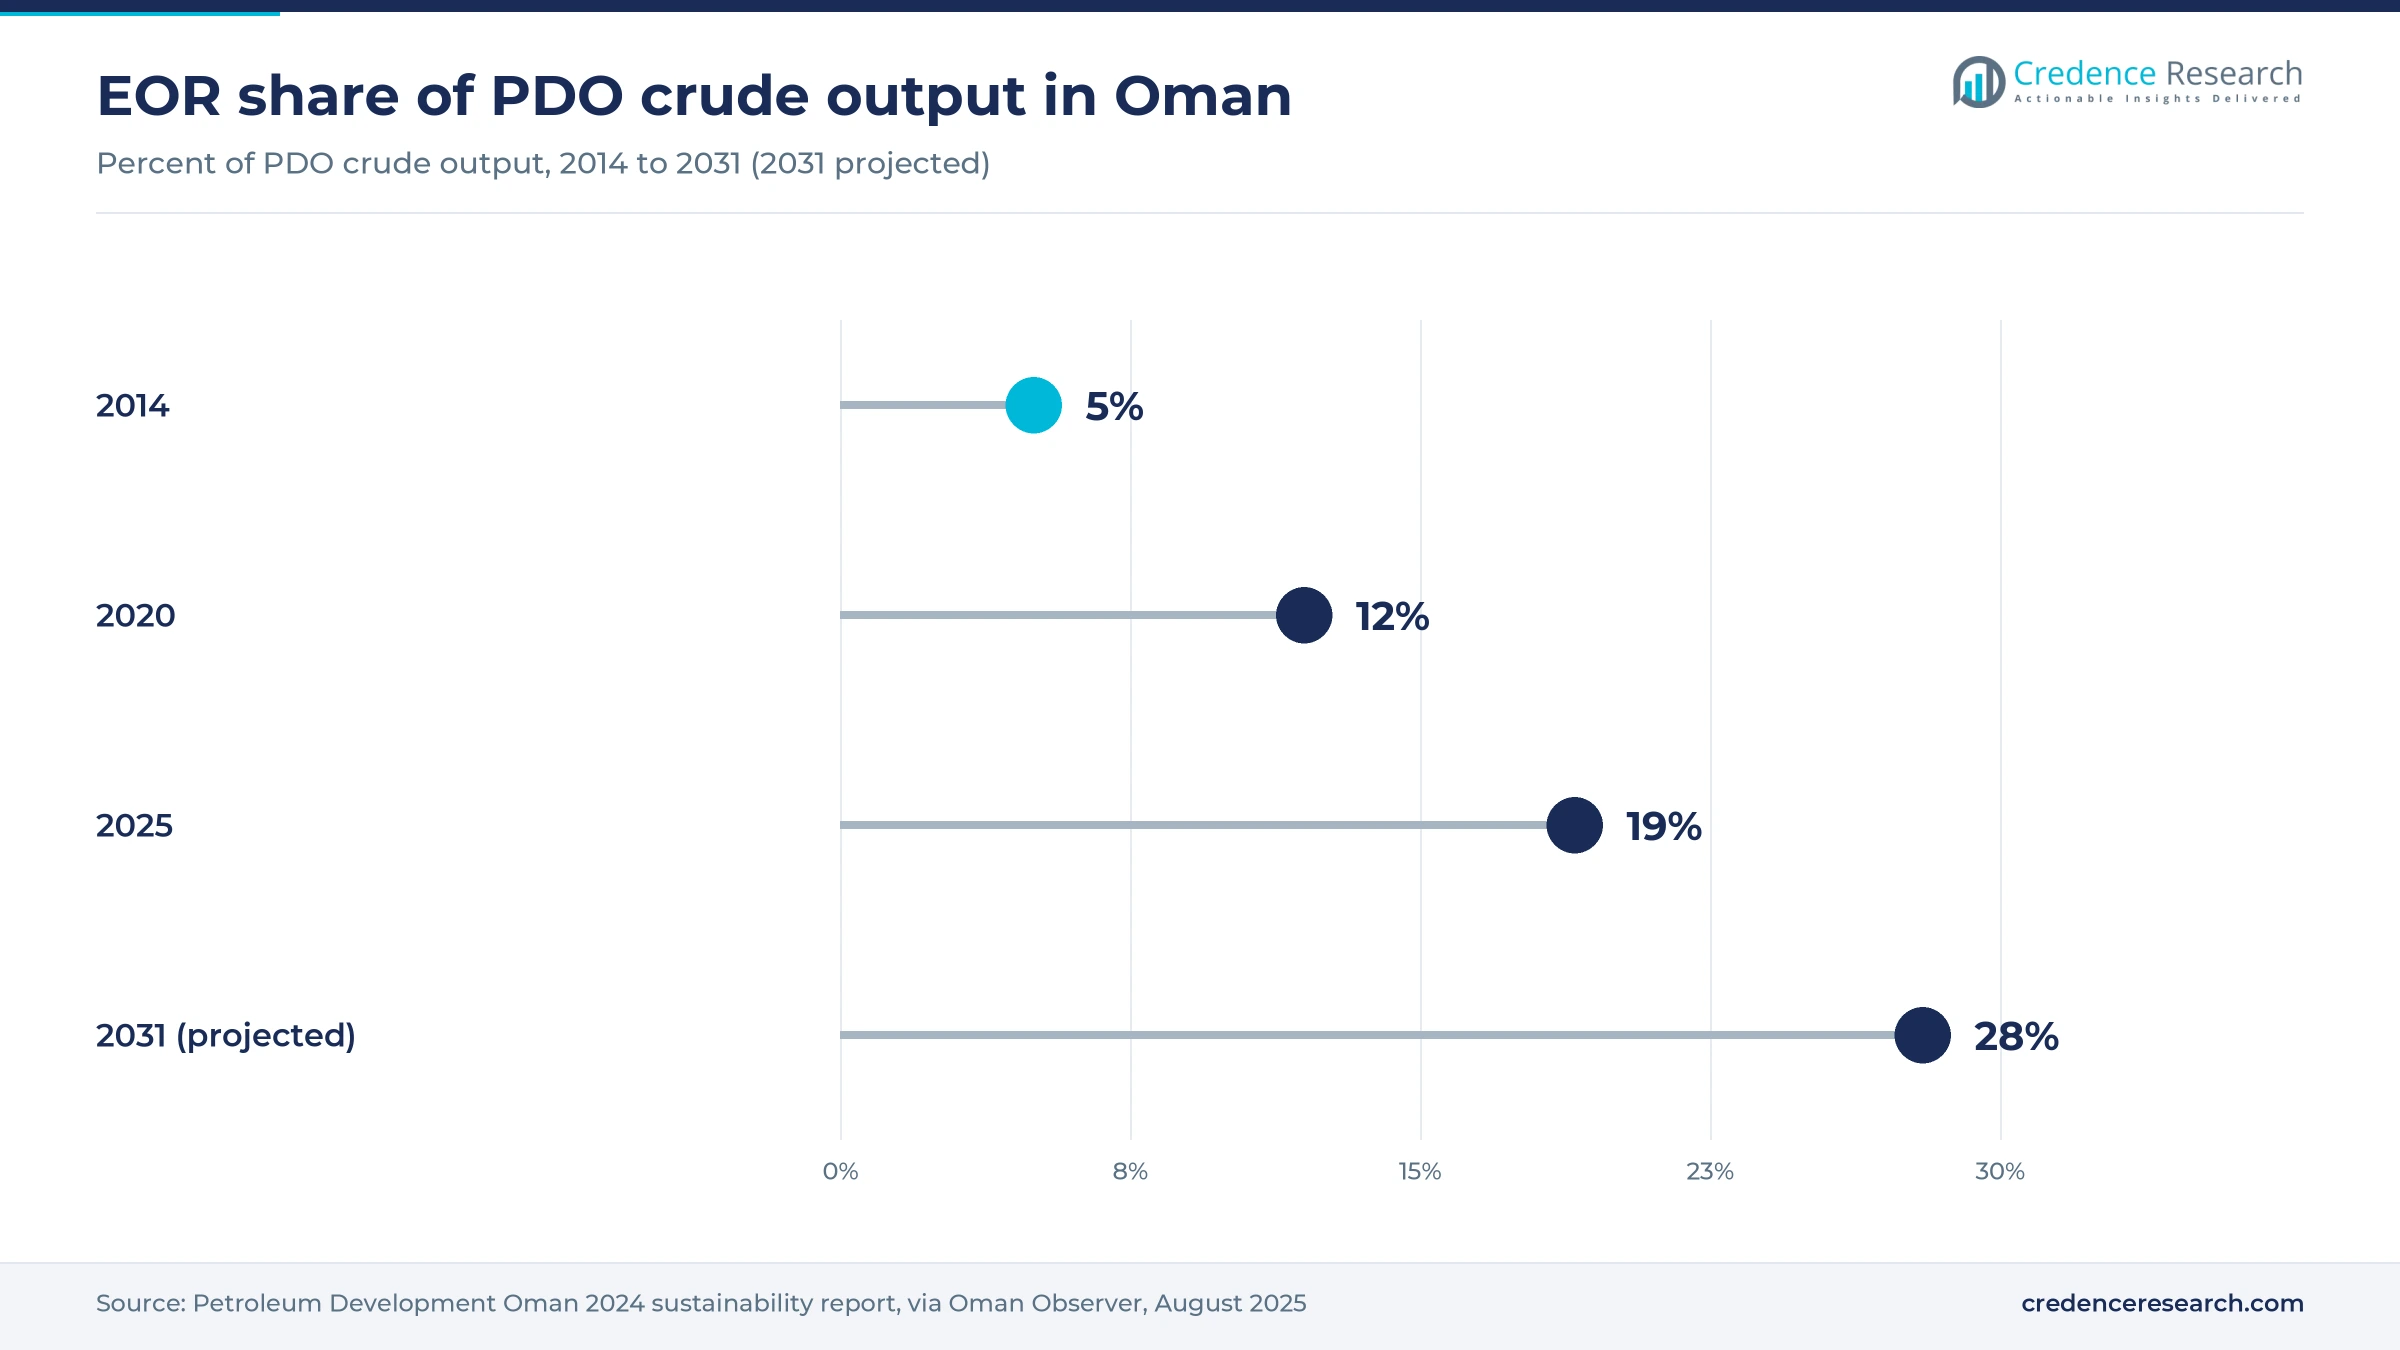
- Oman held 31.0% of 2025 value, because EOR supplied 19% of Petroleum Development Oman's crude output in 2025, with 28% projected by 2031.
- Thermal methods led with 46.0% of 2025 value, because steam floods at Mukhaizna, Qarn Alam and Amal and Kuwait's heavy oil fields consume the most energy per barrel.
- Gulf crude shut-ins peaked at 10.9 million barrels a day in May 2026, which delayed field work and contract awards across the region.
- ADNOC Onshore tendered the Bu Hasa-Shuaiba EOR Unit 1 project in September 2026, targeting a 70% rise in oil production from the reservoir.
Thermal methods hold value as chemical floods scale up
Steam floods lead while polymer flooding grows fastest
Based on technology, the market is categorized into thermal, gas injection, chemical and others. Thermal methods led with 46.0% of 2025 value because steam generation is the costliest injectant, and Oxy's Mukhaizna steamflood in Oman held about 80,000 barrels a day after producing some 600 million barrels by the end of 2023, the Oman Observer reported in June 2024. Chemical flooding grows fastest at 7.8% a year, as PDO took a final investment decision on the Haima West polymer project, worth 36 million extra barrels, while two more polymer floods are due on stream in 2026. Suppliers of surfactants also gain from the chemical EOR pilots that follow.
Onshore fields hold most EOR spending through 2035
Based on application, the market is categorized into onshore and offshore. Onshore fields led with 88.0% of 2025 value because every large steam and polymer flood in the region sits on land, and Kuwait's heavy oil output from the Lower Fars reservoir passed 90,000 barrels a day for the first time, MEES reported in January 2025. Offshore EOR stays smaller in Credence Research estimates, as offshore wells cost more to convert to injection, and ExxonMobil suspended activity at the Upper Zakum project during the 2026 conflict, World Oil reported in October 2026. Onshore operators therefore keep the larger budgets through the forecast.
| Segment Group | Leading Sub-segment | Share, 2025 | Fastest-growing Sub-segment | CAGR, 2026–2035 |
|---|---|---|---|---|
| By Technology | Thermal | 46.0% | Chemical | 7.8% |
| By Application | Onshore | 88.0% | Onshore | 5.7% |
Steam fuel, polymer and CO2 costs set EOR project prices
EOR pricing works through long service contracts and project awards, and the operator pays for injectants, facilities and wells per barrel recovered rather than per ton bought. Steam floods carry the highest unit cost because each barrel needs several barrels of steam, so fuel gas prices move thermal economics most. Polymer floods cost less per barrel, and local plants in Oman should narrow delivered chemical prices further. CO2 floods are capital heavy, because capture plants and pipelines must be built before the first injection. Suppliers earn the steadiest margins on recurring chemical and gas supply, while lump-sum EPC work carries more risk.
| Cost item or contract | Typical price or fee | Basis |
|---|---|---|
| Polymer dosage per incremental barrel | 1-2 kg of polyacrylamide | Credence Research estimate from flood design ratios |
| Block 53 concession program to 2050 | About USD 30 billion capital and operating spend | Oman Observer, May 2025 |
| Sohar acrylamide and polyacrylamide plant | USD 300 million for 350,000 tons a year | Oman Observer, May 2025 |
| Polymer flood chemicals | USD 2,000-3,500 per ton of polyacrylamide | Credence Research estimate from published chemical prices |
| Steam flood EOR operating cost | USD 10-20 per incremental barrel | Credence Research estimate from fuel gas cost and steam-oil ratios of 3 to 5 |
Request a Free Sample
Fill in your details and we'll send you a free sample report.
- Sample data tables & charts
- Research methodology
Mature fields, heavy oil and NOC budgets lift EOR spending
Maturing reservoirs push Oman toward EOR barrels
Aging reservoirs lose the natural pressure and easy oil that once kept costs low, so operators inject steam, gas or polymer to hold output from fields they already own. EOR supplied 5% of Petroleum Development Oman's crude in 2014, 12% in 2020 and 19% in 2025, and PDO projects about 28% by 2031, the Oman Observer reported from the company's 2024 sustainability report. The same report shows that PDO raised gas injection at Harweel 2AB from 3 million to 4 million cubic meters a day, with 54 million barrels of incremental oil to date. These figures matter for suppliers because each new EOR barrel brings recurring purchases of injectants and field services. Service companies holding long PDO contracts gain first from this shift.
Kuwait heavy oil needs steam for its next phase
Kuwait's northern heavy oil cannot flow without heat, which ties its growth directly to steam supply and thermal recovery spending. Kuwait Oil Company awarded KBR front-end engineering design for the next South Ratqa phase in July 2025, against an original plan of 120,000 barrels a day at South Ratqa and 80,000 at Umm Niqa, bne IntelliNews reported. Kuwait Petroleum Corporation and the electricity ministry then signed a cooperation agreement in January 2026 for a 1,200 to 1,500 megawatt cogeneration plant that would supply steam to South Ratqa, MEES reported. The project still awaits a final investment decision from the Kuwaiti side. Steam generator makers, well service companies and engineering contractors are the main beneficiaries once construction tenders follow.
National oil company budgets keep field work funded
State producers fund EOR from multiyear capital programs, which keeps project pipelines alive through price swings. ADNOC plans to accelerate awards of USD 55 billion in project contracts for 2026 to 2028 within a USD 150 billion capital program for 2026 to 2030, World Oil reported in October 2026. The UAE also left OPEC with effect from May 1, 2026, which removes quota limits on the capacity those projects create. ADNOC Onshore's Bu Hasa tender noted in the regional section shows where part of that money goes. Contractors with in-country value records and approved vendor status gain most, because national oil companies weight local content heavily in awards.
High 2026 crude prices improve incremental barrel economics
Higher crude prices raise the value of each extra barrel that steam, gas or polymer recovers, which lets operators approve projects with higher unit costs. The Brent spot price averaged USD 124 a barrel in October 2026, the highest since July 2022, the U.S. Energy Information Administration said in its November outlook, which also expects Brent below USD 90 in the second quarter of 2027. Oman raised crude output to close to 1 million barrels a day from about 800,000 before the war, a level that EOR-supported fields help to sustain. Operators outside the Gulf therefore capture the price gain first, while the price outlook favors projects with low steam or gas costs.
CO2 supply and lower-carbon floods change project choice
CO2 capture hubs shift toward storage rather than EOR
Gulf producers are building carbon capture hubs, but in a shift away from oil use most new capacity is planned for permanent storage, so CO2 for oil recovery still depends on dedicated links such as Al Reyadah. Aramco, Linde and SLB signed a shareholders agreement in December 2024 for a Jubail hub that would capture and store up to 9 million metric tons a year in phase one, with construction due by the end of 2027, Aramco said. ADNOC said in 2023 that Habshan would capture and permanently store 1.5 million tons a year, tripling its capture capacity to 2.3 million tons, with the new Habshan volume going to permanent storage rather than oil fields. Suppliers of compression, pipelines and carbon capture and sequestration equipment gain either way.
Polymer floods emerge as lower-carbon steam substitutes
Operators are testing polymer floods where steam would burn large volumes of gas, because polymers need less energy and water. Saudi Arabian Chevron and Kuwait Gulf Oil Company tested polymers in a Kuwaiti field in 2023 and targeted a multi-well test by the end of 2024, Chevron said in May 2024. Steam already carries Kuwait's heavy oil output of more than 90,000 barrels a day, so a polymer success would cut the fuel gas burned for steam. PDO's Nimr-A and Nimr-E polymer floods, worth 20 million and 22 million barrels, point the same way in Oman. Kuwaiti pilot results are not public, which is an evidence gap. Polymer makers gain if pilots move to full field programs.
Local polymer plants open a regional supply base
Oman's chemical EOR demand now supports local polymer manufacture, which cuts freight and lead times for floods that need steady supply. SNF began civil works in December 2024 on a polymer plant within a USD 250 million Oman expansion, and named majority state-owned PDO as its largest client, the Oman Observer reported. ZL EOR Chemicals plans a USD 300 million acrylamide and polyacrylamide plant at Sohar with 350,000 tons a year of nameplate capacity, targeting first production in the first quarter of 2026. Whether Sohar met that date is not confirmed, which is an evidence gap. Operators in Kuwait, Saudi Arabia and the UAE could buy from these plants as pilots scale.
Iran pilots open gas and chemical EOR work at home
Iran's low recovery factors create an opening for domestic EOR contractors, because NIOC is turning to domestic contractors and local equipment for the work. NIOC has completed EOR pilot designs in eight of 22 targeted fields, including Ahvaz, Mansouri, Azadegan and Gachsaran, and expects about 5% higher recovery once they are fully implemented, Shana reported on Feb. 6, 2026. The company has also signed 32 contracts with knowledge-based companies to revive shut-in and low-productivity wells. Iranian engineering firms, chemical makers and university spin-offs are the customer group that benefits. Constrained exports after the 2026 conflict limit how quickly NIOC can fund these pilots.
War shut-ins, falling steam output and cost slow projects
Wartime shut-ins delay field work and awards
The 2026 conflict shut in Gulf production on a scale that pushed EOR work behind restart work. Middle East shut-ins peaked at 10.9 million barrels a day in May and still averaged 2.5 million in October, the EIA said. Kuwait, Iraq and Bahrain face harder restarts involving mature fields and water injection, World Oil reported. Service contractors waiting on Kuwaiti and Iraqi awards are the most exposed, as budgets move first to restoring pressure.
Older steam floods lose output each year
Steam floods decline as heat spreads through the reservoir, so operators must spend more steam for each barrel. PDO's Amal steam project fell from 16,500 barrels a day in 2023 to 13,400 in 2024, and Qarn Alam fell from 23,291 to 20,768, according to PDO data cited by the Oman Observer. Thermal service providers tied to these fields face flat or lower volumes unless infill wells or new patterns are approved.
Heavy oil projects wait years for investment decisions
Large thermal projects need steam plants, power and many wells before the first extra barrel, which makes them slow to approve. Kuwait's South Ratqa program stalled after Kuwait Oil Company reportedly cancelled a USD 400 million drilling contract in September 2020, bne IntelliNews reported, and only reached a FEED award in 2025. Drilling contractors and steam equipment suppliers face long gaps between awards, so their order books stay uneven.
Carbon dioxide storage competes with EOR use
Captured carbon dioxide can be stored permanently instead of being injected for oil, which limits the volume available for EOR. Al Reyadah, described in the UAE section, and Aramco's 85 kilometer Hawiyah to Uthmaniyah line are the only capture links to oil fields that Credence Research verified in this review. Operators planning CO2 floods therefore need their own capture sources or pipeline access, which raises cost for smaller fields.
Oman leads on steam and polymer while Kuwait grows fastest
| Country | Value, 2025 (USD billion) | Share, 2025 | CAGR, 2026–2035 |
|---|---|---|---|
| Oman | 1.00 | 31.0% | 5.9% |
| UAE | 0.71 | 22.0% | 6.0% |
| Kuwait | 0.51 | 16.0% | 6.3% |
| Saudi Arabia | 0.45 | 14.0% | 5.0% |
| Iran | 0.29 | 9.0% | 3.6% |
| Rest of Middle East | 0.26 | 8.0% | 4.5% |
Oman leads with the region's widest EOR portfolio
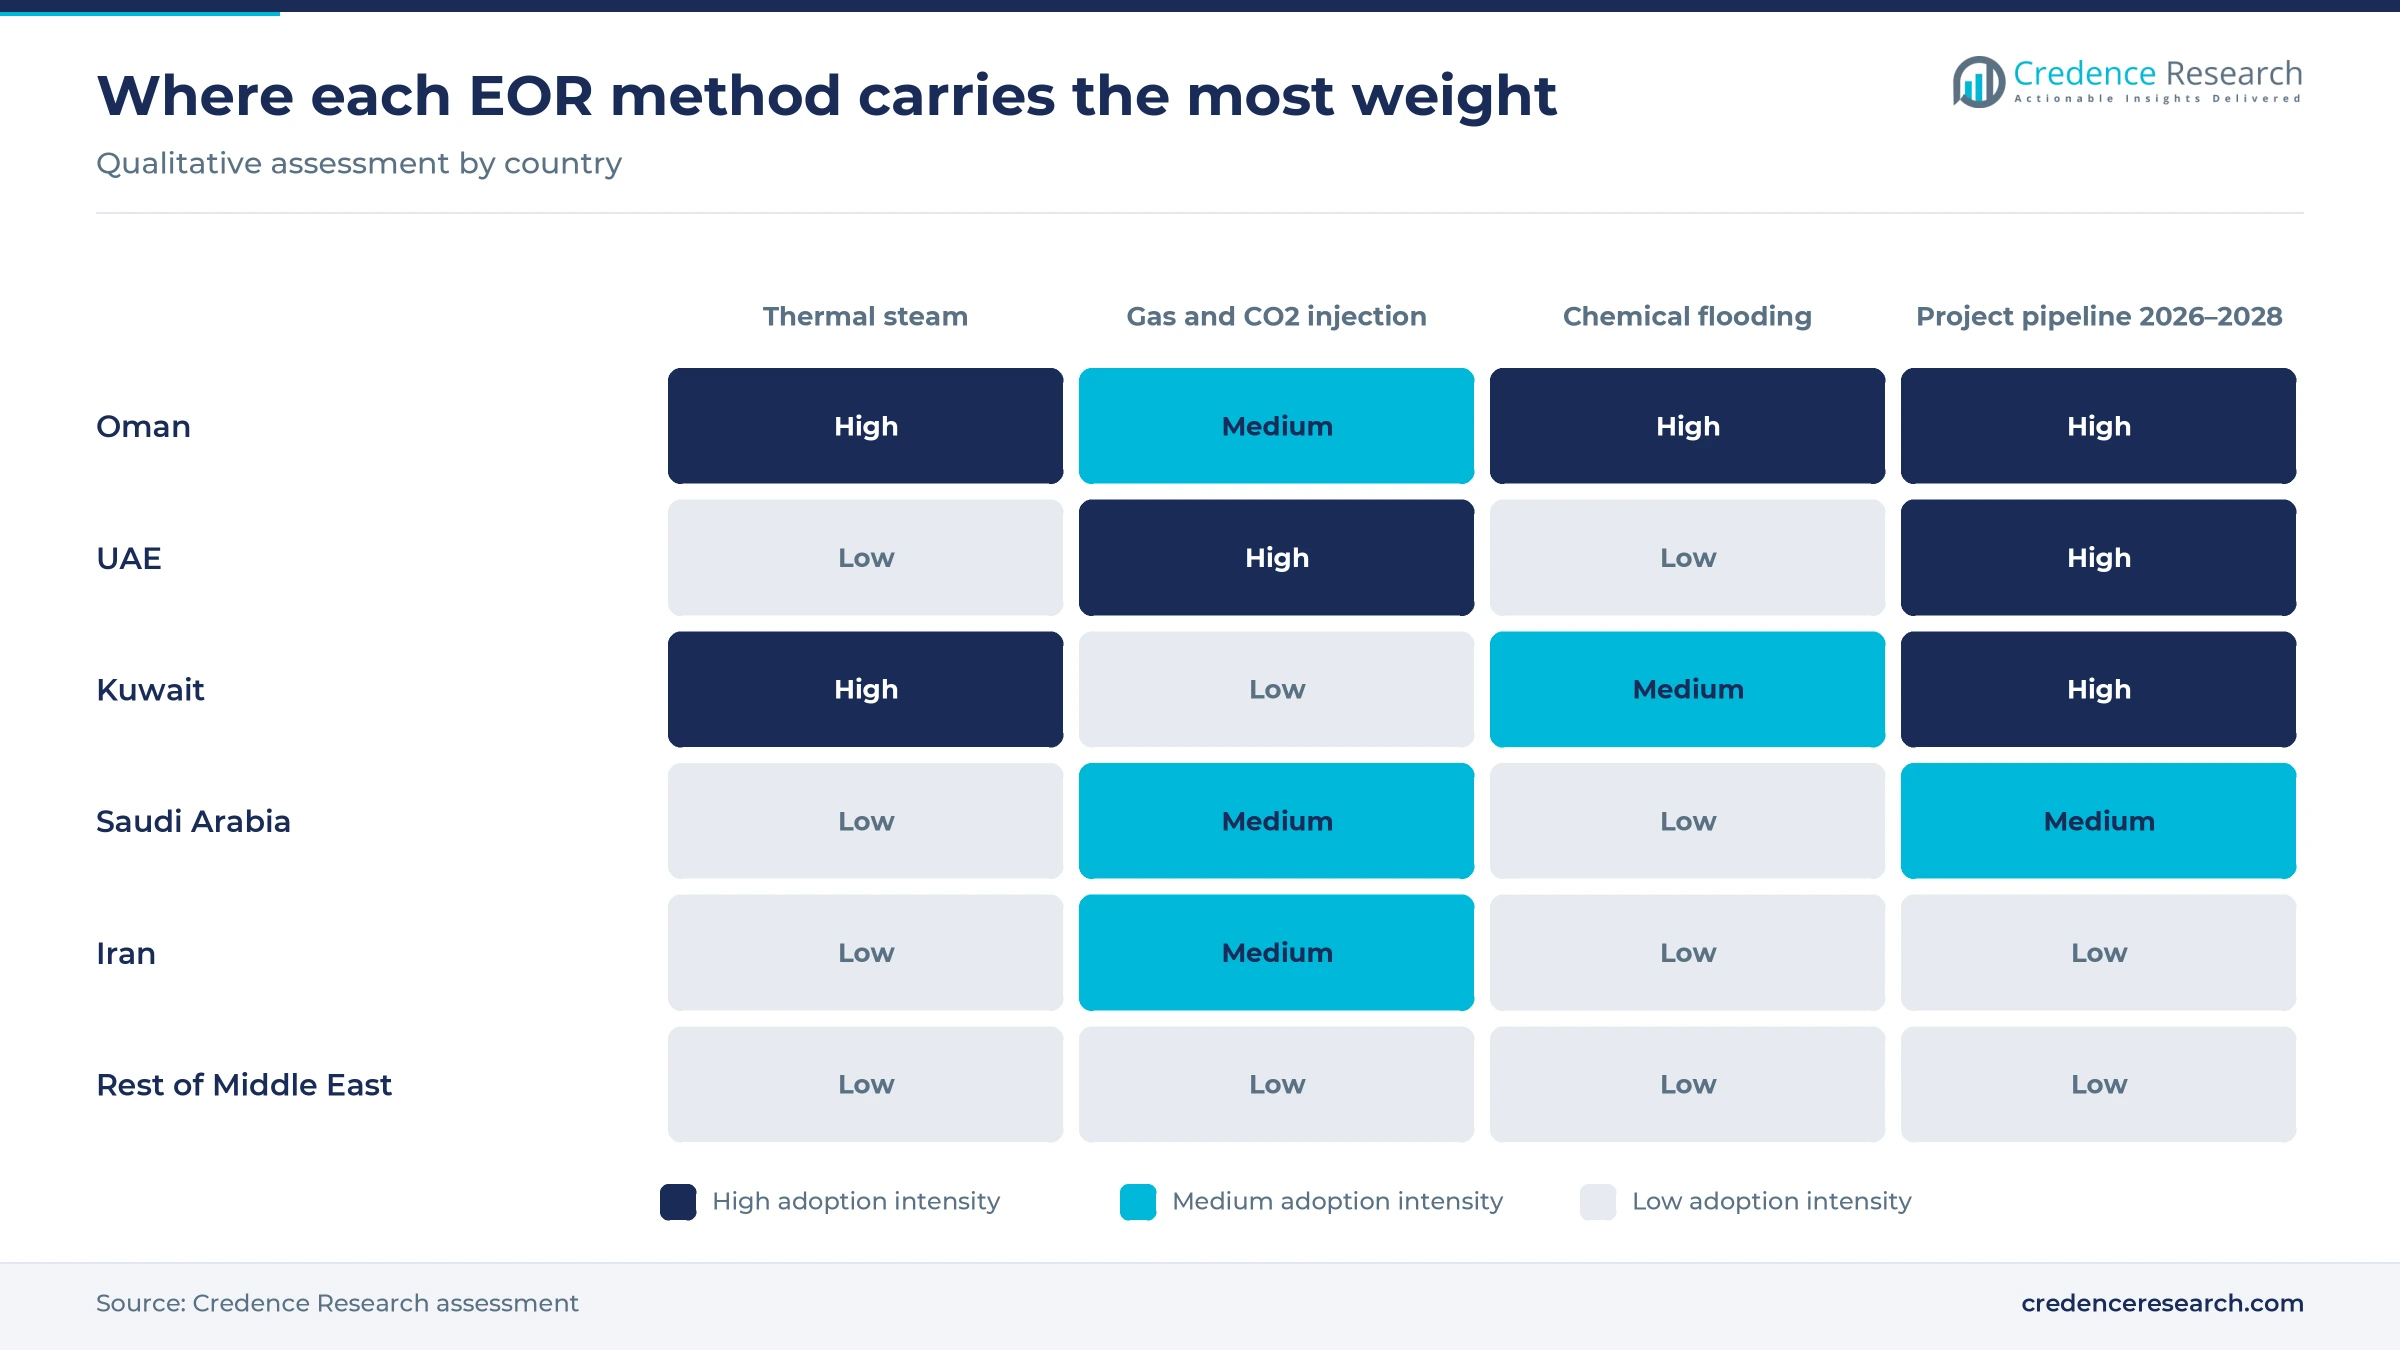
Oman held 31.0% of 2025 value and grows at 5.9% a year. It runs thermal, polymer, miscible gas and chemical projects together, led by PDO in Block 6 and Oxy in Block 53, where the 2050 concession extension listed in the developments section commits steam injection spending for decades. Only part of Block 53 spending is EOR-specific, because drilling and routine operations are excluded. Its fields sit outside the Gulf, so work continued through 2026. EOR already supplied 19% of PDO crude in 2025, and local polymer plants give Oman a supply advantage that no other country in the region has yet.
UAE relies on gas and CO2 injection in carbonates
The UAE held 22.0% of 2025 value and grows at 6.0% a year. ADNOC injects carbon dioxide from the Al Reyadah facility, which opened in 2016 with capacity to capture up to 800,000 tons a year, the company said. ADNOC and SNF agreed in May 2026 to evaluate wider polymer flooding in the UAE, World Oil reported. ADNOC Onshore issued the Bu Hasa-Shuaiba EOR Unit 1 tender on Sept. 20, 2026, with water-alternating-gas injector work in a field of 650,000 barrels a day capacity, MEED reported. CO2 and polymer specialists are best placed for these awards.
Kuwait grows fastest as northern heavy oil expands
Kuwait held 16.0% of 2025 value and is the fastest-growing country at 6.3% a year. Ratqa carried about 60,000 barrels a day of heavy oil capacity and Umm Niqa 22,000 in the 2023-24 operating year, MEES reported. Chevron's net output from the Partitioned Zone shared with Saudi Arabia, where it has used steam injection, rose to about 65,000 barrels a day in 2025, MEES reported in February 2026. Growth depends on the steam plant and FEED work described above reaching contracts.
Saudi Arabia holds spare capacity and a CO2 pilot
Saudi Arabia held 14.0% of 2025 value and grows at 5.0% a year. Aramco disclosed in its April 2019 bond prospectus that Ghawar, the world's largest conventional field, can sustain a maximum of 3.8 million barrels a day, well below the more than 5 million long assumed. Aramco pipes carbon dioxide captured at Hawiyah 85 kilometers to the Uthmaniyah reservoir for pressure support and extra oil, the company says. Credence Research attributes Saudi Arabia's modest EOR share to that spare capacity, which lets Aramco meet output targets without large tertiary floods.
Iran runs EOR pilots under export limits
Iran held 9.0% of 2025 value and grows at 3.6% a year, the slowest in the region. NIOC's pilot designs, set out in the trends section, target fields such as Ahvaz, Gachsaran and Azadegan, and domestic firms carry out most of the work. The EIA expects Iranian exports to remain constrained through its forecast period, which limits cash for new floods. Public data on EOR output in Iran are scarce, which is an evidence gap in this estimate.
Qatar, Bahrain and Iraq stay early-stage EOR users
The rest of the Middle East held 8.0% of 2025 value and grows at 4.5% a year. Bahrain and Iraq face the harder restarts noted in the challenges section, and Iraq's southern output fell more than 70% at the worst point of the 2026 conflict, World Oil reported. Qatar's upstream focus sits on North Field gas, and Credence Research found no current EOR project award in Qatar during this review, which is an evidence gap.
Concessions, FEED awards and tenders move projects ahead
| Development | Status and market relevance |
|---|---|
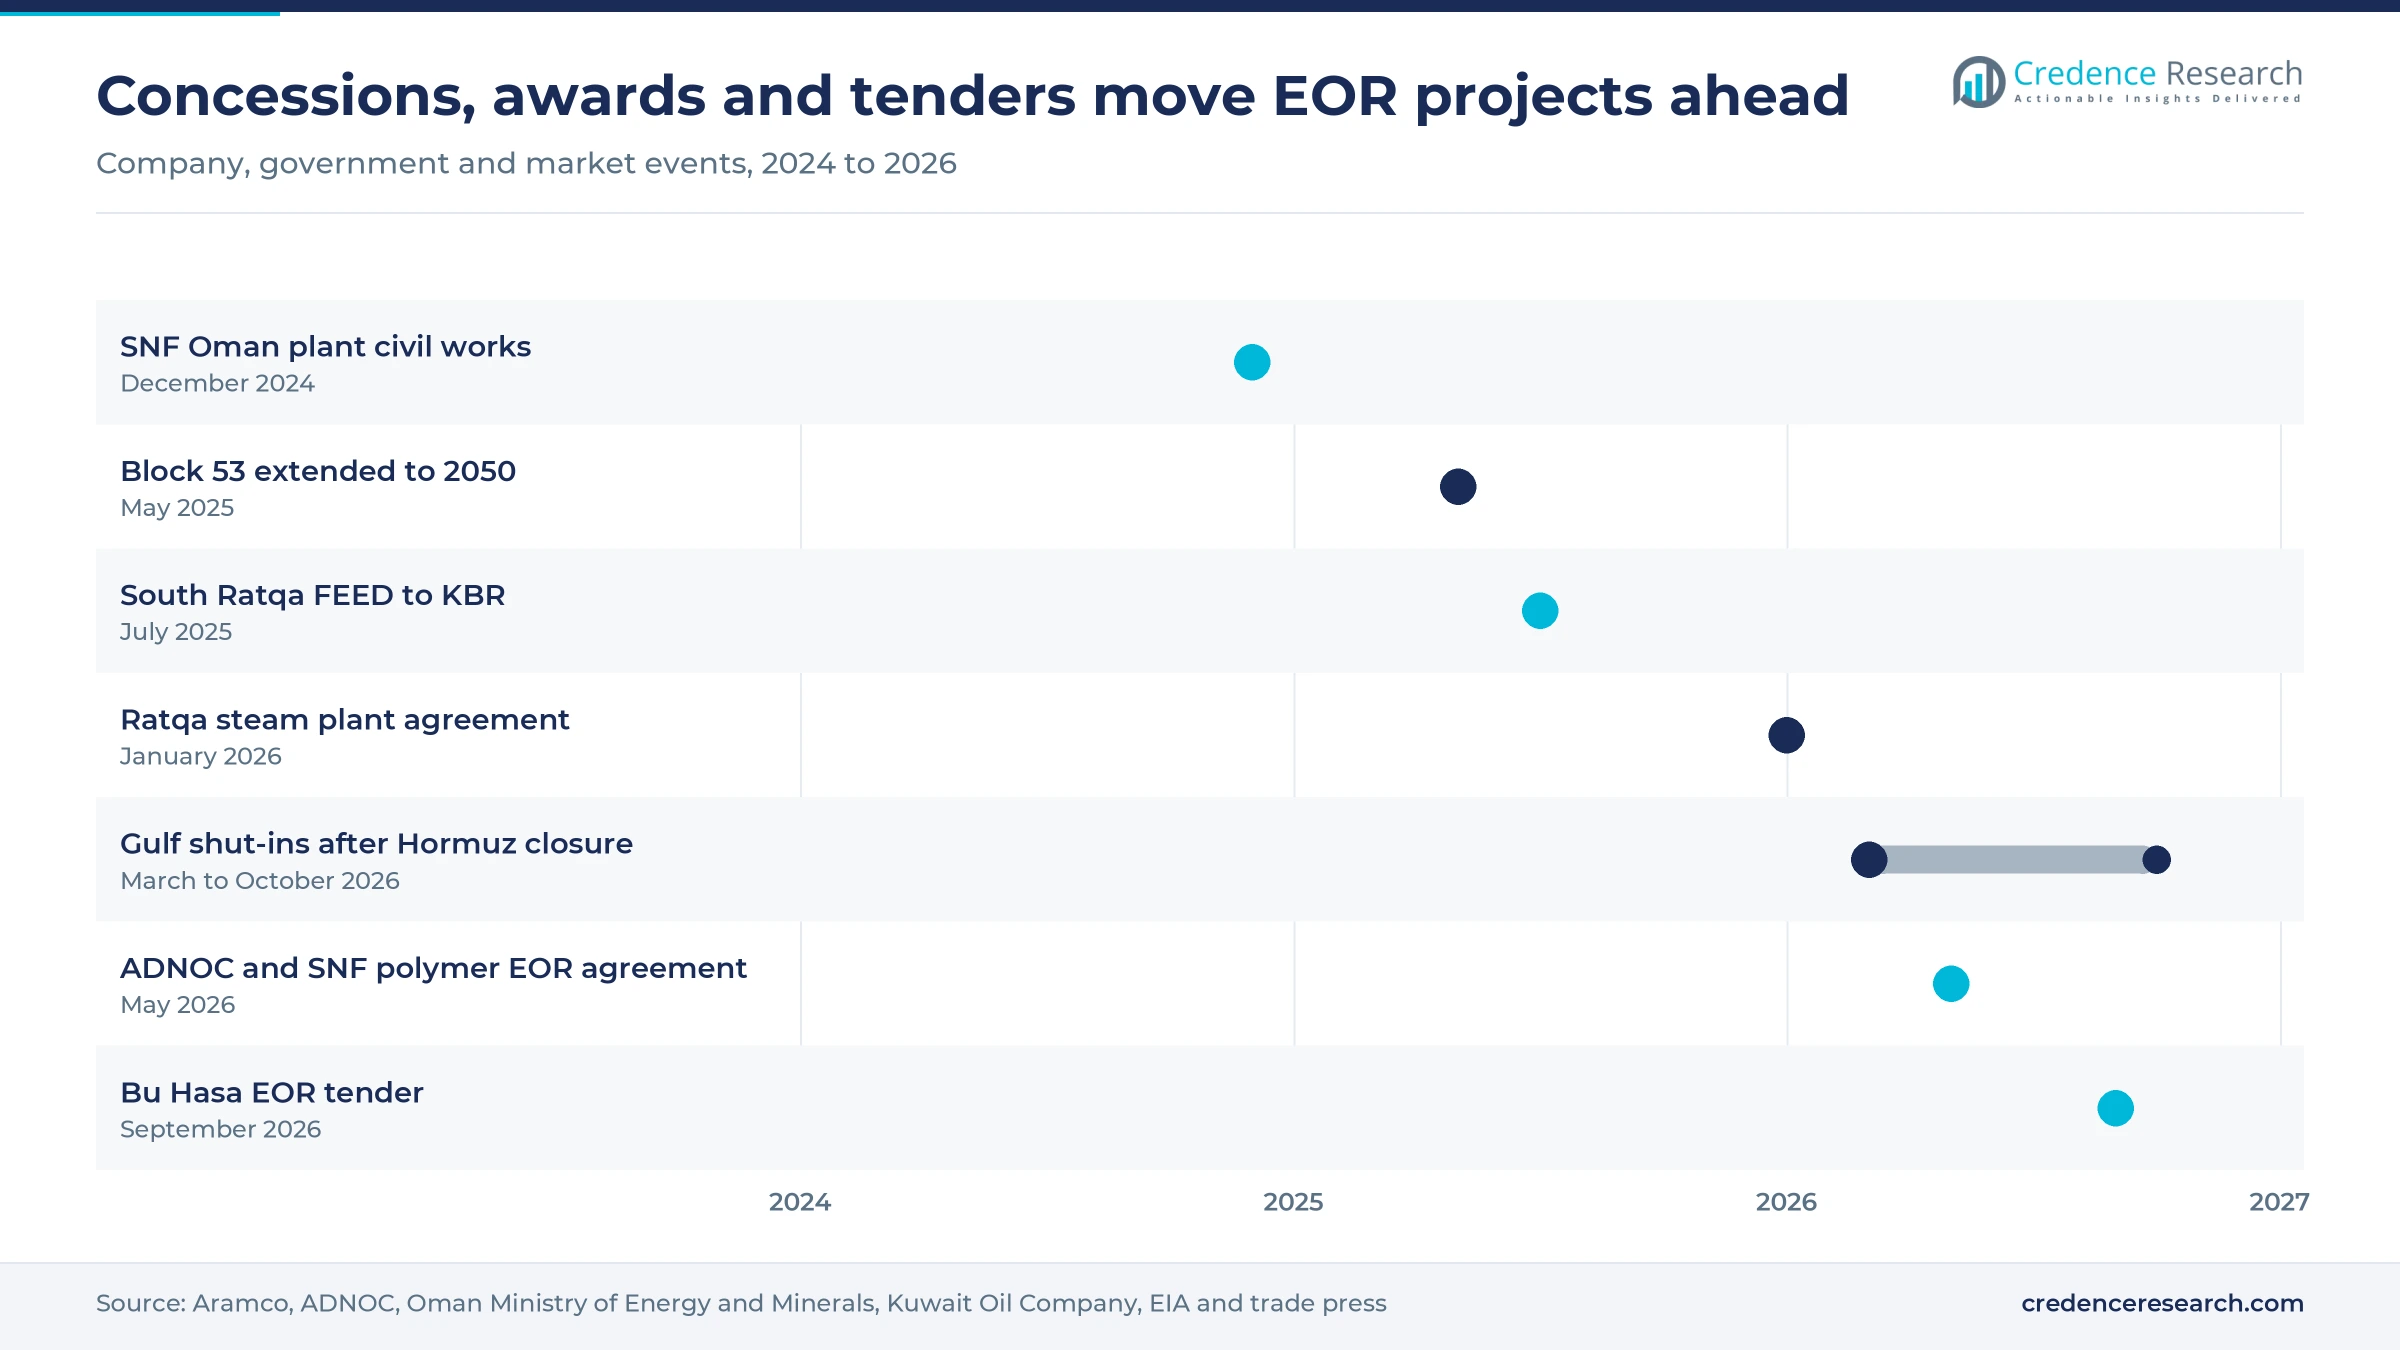
| In May 2026, ADNOC and SNF signed an agreement to evaluate expanded polymer flooding and local production of EOR chemicals in the UAE. | Evaluation agreement; studies come before any field program or plant decision. |
| In May 2025, Oman extended the Block 53 concession operated by Occidental Mukhaizna to 2050, with about USD 30 billion of spending planned. | Signed agreement; it funds continued steam injection at Mukhaizna and Thulaylat reservoir work. |
| In July 2025, Kuwait Oil Company awarded KBR the FEED contract for the next phase of the South Ratqa heavy oil development. | Engineering award; a final investment decision and construction tenders are still pending. |
| In January 2026, Kuwait Petroleum Corporation signed a cooperation agreement for a 1,200 to 1,500 megawatt power and steam plant at Ratqa. | Planned project; no construction contract has been reported. |
| In September 2026, ADNOC Onshore tendered the Bu Hasa-Shuaiba EOR Unit 1 pipeline and water-alternating-gas injector works. | Tender stage; technical bids were due in October 2026 and no award is reported. |
Steam compression, local polymers and CO2 alternating gas
- Pattern steamflooding with mechanical vapor compression lets Mukhaizna recycle produced water into steam, which lowers the fuel and water needed per barrel.
- Polymer flooding with locally made polyacrylamide thickens injected water so it sweeps more oil, and plants in Oman cut supply lead times.
- Water-alternating-gas injection with CO2 switches between water and carbon dioxide to improve sweep in carbonate reservoirs such as Bu Hasa.
- Cyclic steam stimulation heats viscous Lower Fars oil near each well in Kuwait before full steamflood patterns are installed.
Need a Custom Version of This Report?
Tailor the scope, geography, or segments to your exact requirements.
- Custom geography or segment scope
- Direct access to our analyst team
Polymer makers and EPC contractors compete for NOC work
Competition in the Middle East enhanced oil recovery (EOR) market runs through long contracts with a small number of national oil companies. SNF leads polymer supply, with PDO as its largest client, a regional technical center in Muscat and the May 2026 evaluation agreement with ADNOC noted above. ZL EOR Chemicals plans a rival acrylamide and polyacrylamide plant at Sohar, which would give operators a second local source. KBR holds the FEED work for Kuwait's next South Ratqa phase, which positions it for the heavy oil program, while Dodsal built the field facilities and Omani contractor Galfar the flowlines for PDO's Qarn Alam steam injection project. Operators award most EOR work project by project, so suppliers win on in-country value, reservoir experience and delivered cost of chemicals and steam.
Few state buyers and project contractors shape supply
Demand sits with a few buyers, because national oil companies and their concession partners control nearly every field in the region. On the supply side, polymer makers such as SNF and new Omani entrants supply flood chemicals alongside routine production chemicals, while engineering firms such as KBR and EPC contractors such as Dodsal design and build steam, polymer and gas injection facilities. Large integrated service companies also bid for EOR wells and studies, but Credence Research verified no current EOR-specific award to them in this review. Entry barriers are approved vendor status, in-country value scores and reservoir track records, and margins sit with recurring chemical and gas supply.
Service, chemical and engineering suppliers operators shortlist
| Company | Type | Role in the market |
|---|---|---|
| SNF | Chemical EOR specialist | Supplies polyacrylamide polymers for chemical EOR, with PDO as largest client |
| ZL EOR Chemicals | Chemical EOR specialist | Plans an acrylamide and polyacrylamide plant at Sohar for EOR demand |
| KBR, Inc. | Engineering contractor | Performs FEED for the next phase of Kuwait's South Ratqa heavy oil project |
| Dodsal Group | EPC contractor | Built field facilities for PDO's Qarn Alam steam injection EOR project |
| Galfar Engineering and Contracting SAOG | Local EPC contractor | Built oil and water flowlines for PDO's Qarn Alam steam injection EOR project |
Project awards after the 2026 shut-ins decide the pace
Credence Research's view is that contract awards after the 2026 shut-ins, rather than reservoir need, will set the pace of EOR spending in the region to 2035. Reservoir need is clear in Oman and Kuwait, where EOR already supplies a growing share of output. Oman should keep the lead because its floods continued through the conflict and polymer supply is moving in-country. Kuwait carries the most upside if South Ratqa reaches an investment decision. CO2 hubs in Saudi Arabia and the UAE widen gas injection options but will not all feed oil fields.
Estimates rest on EOR volumes, project costs and prices
The report uses 2025 as the base year and 2026 to 2035 as the forecast period. The earlier Credence Research estimate for this market was revised upward after a check of EOR-supported output volumes, injectant and steam costs and published project values showed that it understated regional spending. Market values come from the Credence Research model, and the country, technology and application splits are Credence Research estimates informed by public data. Sources include the U.S. Energy Information Administration, national oil company and ministry statements, company announcements and reputable trade press. No interviews or surveys were used to build these estimates.
Polymer and CO2 floods widen EOR use toward 2035
Credence Research expects EOR spending in the region to reach USD 5.54 billion by 2035, as more barrels from aging fields depend on injection. Kuwait should keep the fastest pace if its heavy oil program advances, while Oman remains the largest market through 2026–2035. Chemical methods gain share from a small base as polymer floods spread beyond Oman, and steam keeps the value lead. The main risks are prolonged Gulf disruption, slow investment decisions and CO2 being stored instead of injected for oil.
Restart pace and project awards set the range
The range to 2035 depends on how quickly Gulf fields return to normal operation and whether delayed EOR projects receive contracts. A fast return, a Bu Hasa award and a South Ratqa investment decision would lift spending above the base case. A long disruption through 2027 would push budgets toward restoring pressure and delay new floods, while Oman keeps growing in every case.
| Scenario | CAGR, 2026–2035 | Value, 2035 | What has to hold |
|---|---|---|---|
| Downside | 3.6% | USD 4.67 billion | Gulf flows stay constrained through 2027 and Kuwaiti and UAE awards slip |
| Base | 5.60% | USD 5.54 billion | Most Gulf output returns by mid-2027 and current EOR programs proceed |
| Upside | 7.1% | USD 6.30 billion | Bu Hasa and South Ratqa reach contracts and CO2 hubs supply EOR fields |
Frequently Asked Questions
How big is the Middle East enhanced oil recovery (EOR) market?
Which country leads EOR spending in the Middle East?
What is Ghawar's maximum sustainable capacity?
How is enhanced oil recovery used in Iran?
How much of Oman's oil comes from EOR?
How did the 2026 conflict affect EOR projects?
What are the main challenges?
Who are the main companies in this market?
Table of Content
Chapter 1 Market Segmentation
- 1.1 Segmentation Framework
- 1.1.1 Product and Service Classification
- 1.1.2 Application and End-Use Classification
- 1.1.3 Technology and Solution Classification
- 1.1.4 Customer and Distribution Channel Classification
- 1.1.5 Geographic Segmentation
- 1.1.6 Market Segment Definitions and Boundaries
- 1.2 By Technology
- 1.2.1 Thermal
- 1.2.2 Gas Injection
- 1.2.3 Chemical
- 1.2.4 Others
- 1.3 By Application
- 1.3.1 Onshore
- 1.3.2 Offshore
- 1.4 By Country
- 1.4.1 Oman
- 1.4.2 UAE
- 1.4.3 Kuwait
- 1.4.4 Saudi Arabia
- 1.4.5 Iran
- 1.4.6 Rest of Middle East
Chapter 2 Introduction
- 2.1 Report Objectives and Scope
- 2.2 Product Definition and Industry Terminology
- 2.3 Market Inclusions and Exclusions
- 2.4 Research Process
- 2.4.1 Primary Research and Expert Interviews
- 2.4.2 Secondary Research and Source Review
- 2.4.3 Top-Down and Bottom-Up Estimation
- 2.4.4 Data Triangulation and Verification
- 2.5 Market Size Measurement Basis
- 2.5.1 2025: USD 3.22 billion → 2035: USD 5.54 billion
- 2.6 Historical and Forecast Reference Periods
- 2.6.1 Historical Period: 2018-2025
- 2.6.2 Base Year: 2025
- 2.6.3 Forecast Period: 2025-2035
- 2.7 Research Assumptions and Limitations
Chapter 3 Executive Summary
- 3.1 Market Snapshot and Key Findings
- 3.2 Base-Year Market Size, 2025
- 3.3 Forecast Market Size, 2035
- 3.4 Revenue and Volume Growth Outlook
- 3.5 Key Demand and Supply Indicators
- 3.6 Leading Market Segments
- 3.7 Fastest-Growing Market Opportunities
- 3.8 Regional Performance Highlights
- 3.9 Technology and Industry Transformation
- 3.10 Competitive Landscape Summary
- 3.11 Analyst View and Strategic Implications
Chapter 4 Middle East Enhanced Oil Recovery (EOR) Market Trends and Developments
- 4.1 Historical Industry Development, 2018-2025
- 4.2 Recent Market Trends and Developments
- 4.3 Demand and Customer Behavior Trends
- 4.4 Technology and Product Innovation
- 4.5 Artificial Intelligence, Automation and Digitalization
- 4.6 Local Manufacturing and Supply Chain Realignment
- 4.7 Industry Partnerships, Mergers and Acquisitions
- 4.8 Sustainability and Circular Economy Developments
- 4.9 Government and Private Sector Investment Trends
- 4.10 Emerging Business Models and Commercialization
- 4.11 Industry Developments and Announcements
Chapter 5 Middle East Enhanced Oil Recovery (EOR) Market Production, Supply and Demand Analysis
- 5.1 Demand Trend and Consumption Analysis, 2018-2025
- 5.2 Demand Forecast, 2025-2035
- 5.3 Production and Output Trend, 2018-2025
- 5.4 Production and Output Forecast, 2025-2035
- 5.5 Installed Capacity and Capacity Utilization
- 5.6 Company-Wise Production Plants and Statistics
- 5.6.1 Installed Production Capacity
- 5.6.2 Actual Production
- 5.6.3 Planned Capacity and Expansion Targets
- 5.7 Supply Chain Structure and Procurement Trends
- 5.8 Supply-Demand Gap and Bottlenecks
- 5.9 Import Dependence and Sourcing Structure
- 5.10 Contract Manufacturing and Outsourcing
- 5.11 Regional Supply and Demand Concentration
Chapter 6 Middle East Enhanced Oil Recovery (EOR) Market Pricing Analysis
- 6.1 Pricing Structure and Measurement
- 6.2 Historical Pricing Trends, 2018-2025
- 6.3 Pricing Outlook, 2025-2035
- 6.4 Average Selling Price and Unit Economics
- 6.5 Pricing by Product and Market Segment
- 6.6 Geographic Pricing Differences
- 6.7 Key Input, Energy, Labor and Logistics Costs
- 6.8 Contract Pricing and Purchasing Models
- 6.9 Pricing Sensitivity and Competitive Positioning
- 6.10 Price, Margin and Profitability Implications
Chapter 7 Middle East Enhanced Oil Recovery (EOR) Market Dynamics
- 7.1 Market Growth Drivers
- 7.1.1 Demand-Side Drivers
- 7.1.2 Technology and Innovation Drivers
- 7.1.3 Infrastructure and Investment Drivers
- 7.1.4 Regulatory and Policy Drivers
- 7.2 Market Restraints
- 7.2.1 Cost and Affordability Constraints
- 7.2.2 Technology and Adoption Barriers
- 7.2.3 Supply Chain and Operational Constraints
- 7.3 Market Challenges
- 7.3.1 Competitive Pressure and Margin Erosion
- 7.3.2 Skills, Infrastructure and Implementation Gaps
- 7.4 Emerging Market Opportunities
- 7.5 Market Dynamics Impact and Time-Horizon Assessment
Chapter 8 Middle East Enhanced Oil Recovery (EOR) Value Chain Analysis
- 8.1 Industry Value Chain Overview
- 8.2 Upstream Suppliers and Critical Inputs
- 8.3 Technology and Component Providers
- 8.4 Manufacturing or Service Delivery
- 8.5 Distribution, Channel Partners and Integrators
- 8.6 Downstream Applications and End Users
- 8.7 Value Addition and Profit Pools
- 8.8 Vertical Integration and Outsourcing
- 8.9 Supplier Concentration and Risk
- 8.10 Supply Chain Localization and Resilience
Chapter 9 Middle East Enhanced Oil Recovery (EOR) Market Regulations and Policies
- 9.1 Relevant Laws, Standards and Compliance Frameworks
- 9.2 Product, Service, Safety and Quality Requirements
- 9.3 Government Policies, Incentives and Subsidies
- 9.4 Imports, Exports and Trade Barriers
- 9.5 Public Procurement and Local Content Requirements
- 9.6 Environmental and Sustainability Compliance
- 9.7 Upcoming Policy Changes and Market Implications
Chapter 10 Middle East Enhanced Oil Recovery (EOR) Market Hotspots and Opportunities
- 10.1 Market Opportunity Mapping and Growth Hotspots
- 10.2 High-Growth Applications and Customer Groups
- 10.3 Underserved Markets and White-Space Opportunities
- 10.4 Emerging Technology and Product Opportunities
- 10.5 New Capacity and Investment Hotspots
- 10.6 Market Entry and Expansion Opportunities
- 10.7 Distribution and Partnership Opportunities
- 10.8 Near-Term and Long-Term Commercial Potential
- 10.9 Opportunity Attractiveness and Execution Risks
Chapter 11 Middle East Enhanced Oil Recovery (EOR) Market Outlook, 2025-2035
- 11.1 Market Size and Analysis
- 11.1.1 Revenue (Market Measurement: 2025: USD 3.22 billion → 2035: USD 5.54 billion)
- 11.1.2 Market Volume and Quantity Sold
- 11.1.3 Historical Market Size, 2018-2025
- 11.1.4 Base-Year Market Size, 2025
- 11.2 Market Forecast, 2025-2035
- 11.2.1 Revenue Forecast to 2035
- 11.2.2 Volume Forecast to 2035
- 11.2.3 CAGR and Year-on-Year Growth
- 11.2.4 Incremental Revenue Opportunity
- 11.3 Forecast Assumptions and Scenario Analysis
- 11.3.1 Base-Case Forecast
- 11.3.2 Optimistic and Conservative Scenarios
- 11.3.3 Technology, Pricing and Policy Sensitivities
- 11.4 Market Attractiveness and Growth Outlook
Chapter 12 Middle East Enhanced Oil Recovery (EOR) Market Segmentation and Outlook
- 12.1 Segmentation Summary and Market Shares, 2025
- 12.2 Largest and Fastest-Growing Segments
- 12.3 By Technology - Market Size and Forecast, 2025-2035
- 12.3.1 Segment Definition and Scope
- 12.3.2 Historical Market Size, 2018-2025
- 12.3.3 Revenue Forecast, 2025-2035
- 12.3.4 Volume Forecast, 2025-2035
- 12.3.5 Base-Year Market Share, 2025
- 12.3.6 Segment CAGR and Growth Drivers
- 12.3.7 Subsegment Market Size and Forecast
- 12.3.7.1 Thermal
- 12.3.7.2 Gas Injection
- 12.3.7.3 Chemical
- 12.3.7.4 Others
- 12.3.8 Subsegment Pricing and Adoption Trends
- 12.3.9 Leading Suppliers and Competition
- 12.3.10 Regional Demand and Opportunities
- 12.4 By Application - Market Size and Forecast, 2025-2035
- 12.4.1 Segment Definition and Scope
- 12.4.2 Historical Market Size, 2018-2025
- 12.4.3 Revenue Forecast, 2025-2035
- 12.4.4 Volume Forecast, 2025-2035
- 12.4.5 Base-Year Market Share, 2025
- 12.4.6 Segment CAGR and Growth Drivers
- 12.4.7 Subsegment Market Size and Forecast
- 12.4.7.1 Onshore
- 12.4.7.2 Offshore
- 12.4.8 Subsegment Pricing and Adoption Trends
- 12.4.9 Leading Suppliers and Competition
- 12.4.10 Regional Demand and Opportunities
- 12.5 By Country - Market Size and Forecast, 2025-2035
- 12.5.1 Segment Definition and Scope
- 12.5.2 Historical Market Size, 2018-2025
- 12.5.3 Revenue Forecast, 2025-2035
- 12.5.4 Volume Forecast, 2025-2035
- 12.5.5 Base-Year Market Share, 2025
- 12.5.6 Segment CAGR and Growth Drivers
- 12.5.7 Subsegment Market Size and Forecast
- 12.5.7.1 Oman
- 12.5.7.2 UAE
- 12.5.7.3 Kuwait
- 12.5.7.4 Saudi Arabia
- 12.5.7.5 Iran
- 12.5.7.6 Rest of Middle East
- 12.5.8 Subsegment Pricing and Adoption Trends
- 12.5.9 Leading Suppliers and Competition
- 12.5.10 Regional Demand and Opportunities
- 12.6 Segment Growth Comparison
- 12.7 Segment Attractiveness and Priority Matrix
Chapter 13 Middle East Enhanced Oil Recovery (EOR) End-Use and Application Market Outlook
- 13.1 End-Use Industry and Customer Demand Structure
- 13.2 Leading Applications and Customer Groups
- 13.3 End-Use Market Size, Share and Forecast
- 13.4 Major End-Use Industry Deep Dives
- 13.4.1 Customer Requirements and Use Cases
- 13.4.2 Demand and Replacement Cycles
- 13.4.3 Technical and Regulatory Considerations
- 13.4.4 Purchasing and Procurement Models
- 13.4.5 Leading Vendors and Distribution Channels
- 13.4.6 Forecast and Commercial Opportunities
- 13.5 Emerging Applications and Cross-Segment Demand
- 13.6 End-Use Industry Investment Priorities
Chapter 14 Middle East Enhanced Oil Recovery (EOR) Geographic Market Outlook, 2025-2035
- 14.1 Regional Market Size and Country-Level Shares, 2025
- 14.2 Country Market Size Comparison, 2025
- 14.3 Country Market Forecasts, 2025-2035
- 14.4 Subregional Industrial and Demand Clusters
- 14.5 Intra-Regional Pricing and Cost Differences
- 14.6 Cross-Border Trade and Supply Networks
- 14.7 Regional Supply and Demand Balances
- 14.8 Country Opportunity Comparison and Prioritization
Note: Every listed country is covered on the structure shown under the first country.
Chapter 15 Middle East Enhanced Oil Recovery (EOR) Technology, Innovation and Sustainability Outlook
- 15.1 Technology Landscape and Maturity
- 15.2 Product, Process and Service Innovation
- 15.3 AI, Automation and Digital Tools in the Industry
- 15.4 Technology Adoption and Performance Benchmarking
- 15.5 Innovation Pipeline and R&D Investment
- 15.6 Patent and Intellectual Property Trends
- 15.7 Energy Efficiency and Resource Management
- 15.8 Sustainability, Recycling and Circularity
- 15.9 Technology Roadmap, 2025-2035
- 15.10 Risks of Obsolescence and Technology Substitution
Chapter 16 Middle East Enhanced Oil Recovery (EOR) Market Key Strategic Imperatives
- 16.1 Growth and Market Entry Priorities
- 16.2 High-Return Products and Segments
- 16.3 Pricing, Profitability and Cost Optimization
- 16.4 Technology Investment and Product Differentiation
- 16.5 Supply Chain Localization and Resilience
- 16.6 Distribution and Customer Acquisition
- 16.7 Partnership, Acquisition and Capacity Strategy
- 16.8 Regional Expansion Priorities
- 16.9 Short-, Medium- and Long-Term Actions
Chapter 17 Competition Outlook
- 17.1 Industry Competition Characteristics
- 17.2 Market Structure and Concentration
- 17.3 Market Share and Competitive Positioning, 2025
- 17.4 Company-Wise Revenue and Product Benchmarking
- 17.5 Production and Service Capacity Benchmarking
- 17.6 Technology, Pricing and Differentiation
- 17.7 Regional Footprint and Distribution Strength
- 17.8 Mergers, Acquisitions and Strategic Alliances
- 17.9 New Entrants and Competitive Threats
- 17.10 Porter's Five Forces and Industry Attractiveness
- 17.11 Competitive Outlook, 2025-2035
Chapter 18 Company Profiles
- 18.1 Company Coverage and Selection Criteria
- 18.2 SNF
- 18.2.1 Business Description
- 18.2.2 Company Ownership and Geographic Presence
- 18.2.3 Product and Service Portfolio
- 18.2.4 Manufacturing and Operating Footprint
- 18.2.5 Production Capacity and Expansion Plans
- 18.2.6 Financial Performance and Investment
- 18.2.7 Market Share and Competitive Position
- 18.2.8 Technology and Innovation Capabilities
- 18.2.9 Strategic Alliances or Partnerships
- 18.2.10 Recent Developments
- 18.2.11 Growth Strategy and Outlook
- 18.3 ZL EOR Chemicals
- 18.4 KBR, Inc.
- 18.5 Dodsal Group
- 18.6 Galfar Engineering and Contracting SAOG
- 18.7 Other Relevant Market Participants
Note: Every listed company is profiled on the structure shown under the first company. The company list is preliminary and may change based on research findings, market developments, data availability and client requirements.
Chapter 19 Disclaimer
- 19.1 Research and Forecast Disclaimer
- 19.2 Data Source and Estimation Limitations
Note: The depth of individual sections depends on data availability for this market. Volume, capacity, trade and other unit-based metrics are included where applicable.