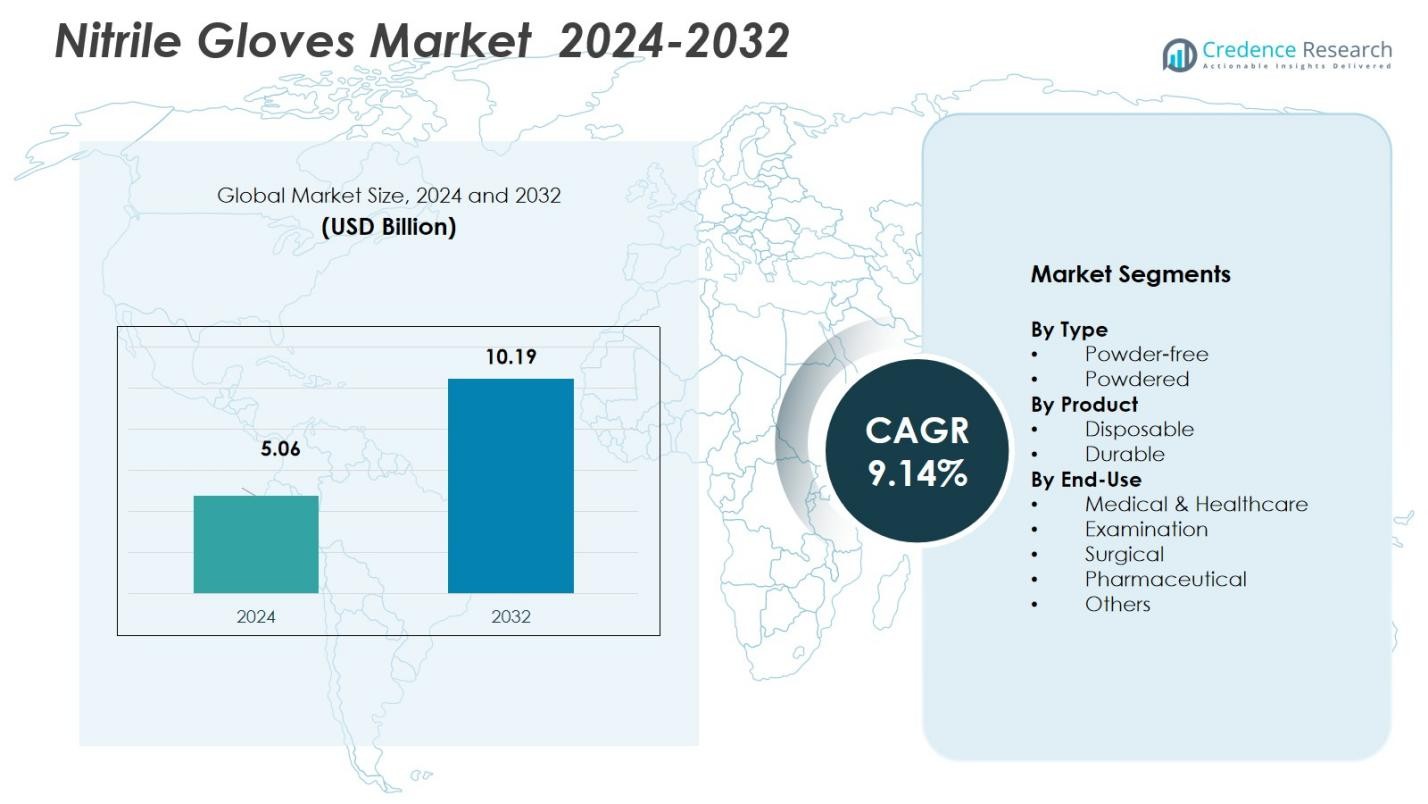
Home » Medical Devices » Nitrile Gloves Market

Nitrile Gloves Market By Grade (Medical Grade, Industrial Grade, Food Grade) By Products (Disposable, Durable) By Type (Powder-Free Nitrile Gloves, Powder-Coated Nitrile Gloves) By End-Use (Healthcare, Food & Beverage, Automotive) By Texture (Refrigerated Plant-based Meat, Frozen Plant-based Meat) – Growth, Future Prospects & Competitive Analysis, 2016 – 2028

Price: $4999

Published: | Report ID: 14398 | Report Format : PDF

About this report

The global nitrile gloves market report examines the industry critically using key parameters. The report includes investment strategies, the need for investments in the nitrile glove industry, and the numerous advantages for investors. Importantly, this report outlines significant changes in global technical regulations for the nitrile glove industry and how economic and non-economic barriers assist the market’s growth. In addition, the report analyzes historical and projected market sizes at the global, regional, and national levels. The report also thoroughly examines key investment propositions, demand and supply gaps, SRC analysis, STAR analysis, competitor positioning, and Tornado analysis. Other analyses and key technological developments include PESTEL analysis, Porter’s five forces analysis, value chain analysis, etc.

REPORT ATTRIBUTE DETAILS
Nitrile Gloves Market by Volume Yes
Market by Value Yes
Market, Tornado Analysis Yes
Market, STAR Analysis Yes
Market, SRC Analysis Yes
Market, Import-Export Data Yes (On Demand)
Market Pricing Analysis Yes (On Demand)
Market Segment Analysis By Grade (Medical Grade, Industrial Grade, and Food Grade)

By Products (Disposable and Durable)

By Type (Powder-Free Nitrile Gloves and Powder-Coated Nitrile Gloves)

By End-Use (Healthcare, Food & Beverage, Automotive, Construction, Oil & Gas, Pharmaceutical, Chemical, Metal & Machinery, Cleanrooms, and Others)

By Texture (Smooth, Micro Roughened, and Aggressively Textured)

Market, Regional Analysis North America (the US and Canada)

Europe (Germany, UK, France, Italy, Spain, and the Rest of Europe)

Asia Pacific (China, India, Japan, South Korea, South East Asia, and the Rest of Asia Pacific)

Latin America (Brazil, Mexico, and the Rest of Latin America)

Middle East and Africa (GCC Countries, South Africa, and the Rest of the Middle East and Africa)

Market Key Companies Hartalega Holdings Berhad, Ansell Limited, Dynarex Corporation, United Glove Inc, Kossan Rubber Industries Bhd, Rubberex Corporation (M) Berhad, Top Glove Corporation Berhad, Unigloves (UK) Limited, YTY Group, and Riverstone Resources Sdn Bhd
Market Competitive Landscape Market Share Analysis

Competitive Benchmarking

Key Players Market Positioning

Geographical Presence Analysis

Major Strategies Adopted

Key Highlights of the Report

Major segments performing in the Nitrile Gloves market

  • The powder-free nitrile gloves segment led the global market in terms of type in 2021 and is expected to continue throughout the forecast period owing to increased awareness about the product’s benefits, such as being more skin-friendly than powder-coated gloves. Various medical, chemical, and food processing applications and advantageous governmental regulations are also anticipated to drive powder-free nitrile glove market demand.
  • In 2021, the disposable products segment accounted for the largest global nitrile glove market share. Disposable nitrile gloves are intended for one-time use only and should be discarded after each use. Disposable gloves are typically thinner than long-lasting gloves, which provide greater sensitivity. Some benefits of disposable nitrile gloves include cost-effectiveness and safety assurance. These factors will drive disposable product growth over the coming years.
  • The medical-grade segment dominated the global market in 2021 and is expected to continue during the projected period. Growing disease prevalence drives demand for medical-grade nitrile gloves in hospitals and other healthcare settings. Furthermore, growing public awareness of health and safety precautions to prevent disease spread propels the medical-grade segment forward.
  • In 2021, the aggressively textured segment dominated the global nitrile glove market owing to the increasing use of aggressively textured gloves in the metal & machinery, construction, and automotive sectors for their ability to provide extreme grip to grab and fit even small objects, such as nuts and bolts. Aggressively textured gloves are thicker and more textured, offering the wearer a firm grip and protection against slippery objects and tools.
  • In 2021, the healthcare end-use segment held the largest revenue share due to the growing demand for nitrile gloves in the healthcare sector, which are used to prevent the spread of germs, blood-borne pathogens, and other chemical contaminants.
Design Element 2

Access crucial information at unmatched prices!

Request your free sample report today & start making informed decisions powered by Credence Research!

Download Free Sample
CTA Design Element 3

In 2021, North America dominated the global Nitrile Gloves market.

North America dominated the global nitrile gloves market in 2021 and is expected to maintain its dominance over the projected period. The region’s growth is driven by a growing elderly population, increased healthcare spending, and increased awareness of hospital-acquired infections. The prevalence of chronic diseases like diabetes, obesity, cancer, and many others is also expected to increase in the coming years, which will likely spur market expansion. Increased demand for extremely effective protective gloves in most key industries, such as food & beverage, metal processing, oil & gas, automotive, and chemical, is expected to drive market penetration in North America during the projected period.

Favorable legislation emphasizing worker safety will drive market growth over the forecast period.

The United States is a major market for nitrile gloves, owing to the growing awareness of the importance of hand hygiene and the increasing number of accidents and injuries in the country. Moreover, favorable legislation emphasizing the importance of protecting individuals working in hazardous conditions is expected to drive market growth throughout the forecast period. This reflects the high level of hygiene and regulatory compliance required by healthcare regulatory authorities in the United States. Aside from the healthcare sector, the growing demand for protective gloves in automobiles, food, beverage, chemicals, and building projects drives the nitrile gloves market in the United States.

Competitive environment: the market is highly fragmented, with several market participants.

The global nitrile glove market is highly fragmented, with several market participants. These market participants heavily implement inorganic growth techniques like mergers and acquisitions, product enhancement, distribution network advancement, partnerships, and collaboration to outperform rivals. For instance, Showa Group, a significant glove manufacturer in Japan, announced plans to triple nitrile glove production by 2022 in January 2021. This capacity expansion will make nitrile gloves more widely available in North America and assist the company in assuming the top spot in the sector. Similarly, Hartalega Holdings announced in March 2020 that it had purchased land to expand its glove manufacturing facility in Sepang, Malaysia. The demand for hand protection has increased due to the COVID-19 outbreak.

Executive Summary

Technical developments in the global Nitrile Gloves market

Scientific and technological improvements in surgical procedures for various health conditions in developed and developing economies are projected to increase allergy-free and sterile nitrile use. Nitrile glove producers use cutting-edge technologies to produce, design, and supply their product to various end-use industries. These producers either own their own independent proprietary technology or use technology that other market participants, under license, provide. These market players have fully committed manufacturing sites in one location and distribute their products in different regions to keep costs low. The industry also prioritizes R&D initiatives to create new technology for fabricating nitrile gloves. For example, in November 2019, Ansell Limited signed a partnership with ProGlove, a major supplier of nitrile gloves, to create hand protection solutions utilizing technology to guarantee proper personal protective equipment (PPE) compliance at medical facilities. The company’s competitive position in the global nitrile glove market is anticipated to be strengthened by this partnership.

Key investments by the Nitrile Gloves market players

The market for nitrile gloves witnessed a sizable new investment due to pricing incentives and escalating demand. The key market players are investing in product development and implementing capacity expansion strategies to meet the strong demand and strengthen their position in the global market. For instance, Relevium Technologies Inc. revealed in December 2021 that it had acquired two PPE agreements for CAD$11 million and CAD$5 million to deliver a total of 180 million healthcare standard nitrile gloves. Likewise, Hartalega Holdings Bhd, Malaysia’s second-largest nitrile glove manufacturer, planned to invest USD 1.70 billion in 16 new production plants over the next 20 years in March 2021. Hartalega intends to increase annual glove manufacturing capacity to 95 billion gloves by 2027 from the current 12 facilities.

Some major players in the nitrile gloves market are Hartalega Holdings Berhad, Ansell Limited, Dynarex Corporation, United Glove Inc., Kossan Rubber Industries Bhd., Rubberex Corporation (M) Berhad, Top Glove Corporation Berhad, Unigloves (UK) Limited, YTY Group, and Riverstone Resources Sdn Bhd.

Major Driving Factors for the Nitrile Gloves market

Nitrile gloves are puncture-resistant rubber gloves with a longer shelf life than latex gloves. Nitrile gloves are primarily used in medical and non-medical settings to prevent contamination. Nitrile gloves, which provide better virus defense than other types of gloves like vinyl and latex, have seen an increase in demand due to the COVID-19 outbreak. Nitrile gloves are recommended by the World Health Organization (WHO) as a means of virus protection. Some factors driving market growth are the rise in the prevalence of chronic diseases and the rising demand for surgical interventions. Moreover, the increasing number of diagnostic laboratories propels the nitrile glove market forward. Furthermore, increasing hygiene and safety awareness among patients and healthcare professionals is expected to drive market expansion.

Major Risks for the Nitrile Gloves market

The primary material used to make nitrile gloves is nitrile butadiene rubber, with acrylonitrile as a copolymer. The prices of these raw materials are volatile and are expected to rise further during the forecast period, limiting the market’s revenue growth. Moreover, the price of nitrile gloves has increased due to a shortage of butadiene brought on by the sudden closure of most manufacturing facilities. This may also limit global market growth throughout the projected period.


Key type in the Nitrile Gloves market

Powder-free nitrile gloves will dominate the global market during the forecast period due to their rising popularity across various industries. Healthcare facilities are switching from latex gloves to powder-free nitrile gloves since powder-free gloves are less form-fitting after being chlorinated or coated with polymers like silicones, acrylics, and hydrogels. Powder-free gloves leave no residue and are therefore appropriate for use in the automotive sector. Powder-free gloves also cause fewer allergies because they are made with less protein and chemical content, allowing them to be used for longer periods. Moreover, strict regulations on powdered gloves imposed by many governments worldwide will positively impact the powder-free nitrile gloves market throughout the projected period.

Regional performance analysis of the Nitrile Gloves market

North America is expected to dominate the global market due to government regulations that restrict the use of latex and powered gloves and encourage the use of synthetic materials, primarily nitrile-based gloves. The expansion of the regional market for nitrile gloves is also aided by the rising number of people who are allergic to latex and the dangers that this poses to children and medical professionals. In addition, expansion in the regional personal care, hygiene, and food processing industries is anticipated to open up lucrative market opportunities.

Furthermore, the Asia Pacific market is expected to grow fastest during the forecast period due to the rapid spread of coronavirus in countries such as India, China, Japan, and Indonesia. In addition, it is anticipated that quick industrialization and increasing safety and hygiene standards in various healthcare settings in developing countries will positively impact the industry’s growth. China’s medical and healthcare sector is expected to grow rapidly due to several factors, including an aging population, urbanization, rising living standards, and expanding healthcare systems. Increasing medical costs are expected to fuel the expansion of the country’s healthcare industry, which will support industrial production.

Regulatory landscape for the Nitrile Gloves market

The increased demand for medical gloves during the pandemic has resulted in the global production of counterfeit and non-licensed medical gloves. As a result, the FDA has been actively investigating, inspecting, and reviewing medical gloves and other PPE products at ports of entry and in domestic commerce to reduce and prohibit the sale and use of unlicensed and unsafe medical gloves. Moreover, the FDA is offering regulatory flexibility in certain situations that are listed under the enforcement policy for gloves during the COVID-19 public health emergency act to meet the demand for medical gloves on a global scale. Despite the pandemic, these factors have produced new growth opportunities for key players in the nitrile glove market.

Market size of Nitrile Gloves with regard to value

The global nitrile gloves market is anticipated to grow at a substantial CAGR of 5.5% in the upcoming years. The global nitrile glove industry is estimated to be worth USD 8.5 billion in 2021 and is expected to be worth USD 11.72 billion by 2028.

Shape Your Report to Specific Countries or Regions & Enjoy 30% Off!

Major players’ plans for the future of the Nitrile Gloves market

Leading companies concentrate on developing new products and innovative material use in nitrile glove manufacturing as core strategies for expanding their product portfolio in the global nitrile glove market. The use of novel processes to produce allergy-free raw rubber and the inclusion of an anti-microbial substance in nitrile gloves are anticipated to provide value-added benefits in clinical applications. Players in the market also focus on collaborations and acquisitions to gain early market entry and a large revenue share for nitrile gloves. For instance, Yanimed announced the formation of a joint venture in April 2021 with Guangdong Guyun Medical Technology Co. Ltd., a Chinese manufacturing company specializing in R&D, fabrication, and manufacturing of disposable medical items such as nitrile gloves.

Segmentation of Global Nitrile Gloves Market –

Global Nitrile Gloves Market – By Grade

  • Medical Grade
  • Industrial Grade
  • Food Grade

Global Nitrile Gloves Market – By Products

  • Disposable
  • Durable

Global Nitrile Gloves Market – By Type

  • Powder-Free Nitrile Gloves
  • Powder-Coated Nitrile Gloves

Global Nitrile Gloves Market – By End-Use

  • Healthcare
  • Food & Beverage
  • Automotive
  • Construction
  • Oil & Gas
  • Pharmaceutical
  • Chemical
  • Metal & Machinery
  • Cleanrooms
  • Others

Global Nitrile Gloves Market – By Texture

  • Refrigerated Plant-based Meat
  • Frozen Plant-based Meat
  • Shelf-stable Plant-based Meat

Global Nitrile Gloves Market – By Region

  • North America
    • US
    • Canada
  • Europe
    • Germany
    • France
    • UK.
    • Italy
    • Spain
    • Rest of Europe
  • Asia Pacific
    • China
    • Japan
    • India
    • South Korea
    • South-east Asia
    • Rest of Asia Pacific
  • Latin America
    • Brazil
    • Mexico
    • Rest of Latin America
  • Middle East & Africa
    • GCC Countries
    • South Africa
    • Rest of the Middle East and Africa

1. Preface
1.1. Report Description
1.1.1. Purpose of the Report
1.1.2. Target Audience
1.1.3. USP and Key Offerings
1.2. Research Scope
1.3. Research Methodology
1.3.1. Phase I – Secondary Research
1.3.2. Phase II – Primary Research
1.3.3. Phase III – Expert Panel Review
1.3.4. Approach Adopted
1.3.4.1. Top-Down Approach
1.3.4.2. Bottom-Up Approach
1.3.5. Assumptions
1.4. Market Segmentation

2. Executive Summary
2.1. Market Snapshot: Global Nitrile Gloves Market
2.2. Global Nitrile Gloves Market, By Grade
2.3. Global Nitrile Gloves Market, By Product
2.4. Global Nitrile Gloves Market, By Type
2.5. Global Nitrile Gloves Market, By End-Use
2.6. Global Nitrile Gloves Market, By Texture
2.7. Global Nitrile Gloves Market, By Region

3. Market Dynamics & Factors Analysis
3.1. Introduction
3.1.1. Global Nitrile Gloves Market Value, 2016-2028, (US$ Bn)
3.2. Market Dynamics
3.2.1. Key Growth Trends
3.2.2. Market Drivers
3.2.3. Market Restraints
3.2.4. Market Opportunities
3.2.5. Major Industry Challenges
3.3. Attractive Investment Proposition,2021
3.3.1. Grade
3.3.2. Product
3.3.3. Type
3.3.4. End-Use
3.3.5. Texture
3.3.6. Geography

4. Premium Insights
4.1. STAR (Situation, Task, Action, Results) Analysis
4.2. Porter’s Five Forces Analysis
4.2.1. Threat of New Entrants
4.2.2. Bargaining Power of Buyers/Consumers
4.2.3. Bargaining Power of Suppliers
4.2.4. Threat of Substitute Types
4.2.5. Intensity of Competitive Rivalry
4.3. Value Chain Analysis
4.4. Technology Analysis
4.5. Marketing Strategy Analysis
4.5.1. Direct Marketing
4.5.2. Indirect Marketing
4.5.3. Marketing Channel Development Trend

5. Market Positioning of Key Players, 2021
5.1. Company Market Share of Key Players, 2021
5.2. Competitive Benchmarking
5.3. Market Positioning of Key Vendors
5.4. Geographical Presence Analysis
5.5. Major Strategies Adopted by Key Players
5.5.1. Key Strategies Analysis
5.5.2. Mergers and Acquisitions
5.5.3. Partnerships
5.5.4. Product Launch
5.5.5. Geographical Expansion
5.5.6. Others

6. COVID-19 Impact Analysis
6.1. Global Nitrile Gloves Market Pre Vs Post COVID 19, 2019 – 2028
6.2. Impact on Import & Export
6.3. Impact on Demand & Supply

7. Global Nitrile Gloves Market
7.1. Global Nitrile Gloves Market, by Grade, 2016-2028(US$ Bn)
7.1.1. Overview
7.1.2. Global Nitrile Gloves Market, By Grade, 2021 vs 2028 (in%)
7.1.3. Global Nitrile Gloves Market, By Medical Grade, 2016-2028 (US$ Bn)
7.1.4. Global Nitrile Gloves Market, By Industrial Grade, 2016-2028 (US$ Bn)
7.1.5. Global Nitrile Gloves Market, By Food Grade, 2016-2028 (US$ Bn)
7.2. Global Nitrile Gloves Market, by Product, 2016-2028(US$ Bn)
7.2.1. Overview
7.2.2. Global Nitrile Gloves Market, By Product, 2021 vs 2028 (in%)
7.2.3. Global Nitrile Gloves Market, By Disposable, 2016-2028 (US$ Bn)
7.2.4. Global Nitrile Gloves Market, By Durable, 2016-2028 (US$ Bn)
7.3. Global Nitrile Gloves Market, by Type, 2016-2028(US$ Bn)
7.3.1. Overview
7.3.2. Global Nitrile Gloves Market, By Type, 2021 vs 2028 (in%)
7.3.3. Global Nitrile Gloves Market, By Powder-Free Nitrile Gloves, 2016-2028 (US$ Bn)
7.3.4. Global Nitrile Gloves Market, By Powder-Coated Nitrile Gloves, 2016-2028 (US$ Bn)
7.4. Global Nitrile Gloves Market, by End-Use, 2016-2028(US$ Bn)
7.4.1. Overview
7.4.2. Global Nitrile Gloves Market, By End-Use, 2021 vs 2028 (in%)
7.4.3. Global Nitrile Gloves Market, By Healthcare, 2016-2028 (US$ Bn)
7.4.4. Global Nitrile Gloves Market, By Food & Beverage, 2016-2028 (US$ Bn)
7.4.5. Global Nitrile Gloves Market, By Automotive, 2016-2028 (US$ Bn)
7.4.6. Global Nitrile Gloves Market, By Construction, 2016-2028 (US$ Bn)
7.4.7. Global Nitrile Gloves Market, By Oil & Gas, 2016-2028 (US$ Bn)
7.4.8. Global Nitrile Gloves Market, By Pharmaceutical, 2016-2028 (US$ Bn)
7.4.9. Global Nitrile Gloves Market, By Chemical, 2016-2028 (US$ Bn)
7.4.10. Global Nitrile Gloves Market, By Metal & Machinery, 2016-2028 (US$ Bn)
7.4.11. Global Nitrile Gloves Market, By Cleanrooms, 2016-2028 (US$ Bn)
7.4.12. Global Nitrile Gloves Market, By Others, 2016-2028 (US$ Bn)
7.5. Global Nitrile Gloves Market, by Texture, 2016-2028(US$ Bn)
7.5.1. Overview
7.5.2. Global Nitrile Gloves Market, By Texture, 2021 vs 2028 (in%)
7.5.3. Global Nitrile Gloves Market, By Smooth, 2016-2028 (US$ Bn)
7.5.4. Global Nitrile Gloves Market, By Micro Roughened, 2016-2028 (US$ Bn)
7.5.5. Global Nitrile Gloves Market, By Aggressively Textured, 2016-2028 (US$ Bn)

8. North America Nitrile Gloves Market Analysis
8.1. North America Nitrile Gloves Market, by Grade, 2016-2028(US$ Bn)
8.1.1. Overview
8.1.2. SRC Analysis
8.2. North America Nitrile Gloves Market, by Product, 2016-2028(US$ Bn)
8.2.1. Overview
8.2.2. SRC Analysis
8.3. North America Nitrile Gloves Market, by Type, 2016-2028(US$ Bn)
8.3.1. Overview
8.3.2. SRC Analysis
8.4. North America Nitrile Gloves Market, by End-Use, 2016-2028(US$ Bn)
8.4.1. Overview
8.4.2. SRC Analysis
8.5. North America Nitrile Gloves Market, by Texture, 2016-2028(US$ Bn)
8.5.1. Overview
8.5.2. SRC Analysis
8.6. North America Nitrile Gloves Market, by Country, 2016-2028 (US$ Bn)
8.6.1. U.S.
8.6.1.1. U.S. Nitrile Gloves Market Estimates and Forecast, 2016-2028 (US$ Bn)
8.6.1.2. U.S. Nitrile Gloves Market, By Grade, 2016-2028 (US$ Bn)
8.6.1.3. U.S. Nitrile Gloves Market, By Product, 2016-2028 (US$ Bn)
8.6.1.4. U.S. Nitrile Gloves Market, By Type, 2016-2028 (US$ Bn)
8.6.1.5. U.S. Nitrile Gloves Market, By End-Use, 2016-2028 (US$ Bn)
8.6.1.6. U.S. Nitrile Gloves Market, By Texture, 2016-2028 (US$ Bn)
8.6.2. Canada
8.6.2.1. Canada Nitrile Gloves Market Estimates and Forecast, 2016-2028 (US$ Bn)
8.6.2.2. Canada Nitrile Gloves Markets, By Grade, 2016-2028 (US$ Bn)
8.6.2.3. Canada Nitrile Gloves Market, By Product, 2016-2028 (US$ Bn)
8.6.2.4. Canada Nitrile Gloves Market, By Type, 2016-2028 (US$ Bn)
8.6.2.5. Canada Nitrile Gloves Market, By End-Use, 2016-2028 (US$ Bn)
8.6.2.6. Canada Nitrile Gloves Market, By Texture, 2016-2028 (US$ Bn)

9. Europe Nitrile Gloves Market Analysis
9.1. Europe Nitrile Gloves Market, by Grade, 2016-2028(US$ Bn)
9.1.1. Overview
9.1.2. SRC Analysis
9.2. Europe Nitrile Gloves Market, by Product, 2016-2028(US$ Bn)
9.2.1. Overview
9.2.2. SRC Analysis
9.3. Europe Nitrile Gloves Market, by Type, 2016-2028(US$ Bn)
9.3.1. Overview
9.3.2. SRC Analysis
9.4. Europe Nitrile Gloves Market, by End-Use, 2016-2028(US$ Bn)
9.4.1. Overview
9.4.2. SRC Analysis
9.5. Europe Nitrile Gloves Market, by Texture, 2016-2028(US$ Bn)
9.5.1. Overview
9.5.2. SRC Analysis
9.6. Europe Nitrile Gloves Market, by Country, 2016-2028 (US$ Bn)
9.6.1. Germany
9.6.1.1. Germany Nitrile Gloves Market Estimates and Forecast, 2016-2028 (US$ Bn)
9.6.1.2. Germany Nitrile Gloves Market, By Grade, 2016-2028 (US$ Bn)
9.6.1.3. Germany Nitrile Gloves Market, By Product, 2016-2028 (US$ Bn)
9.6.1.4. Germany Nitrile Gloves Market, By Type, 2016-2028 (US$ Bn)
9.6.1.5. Germany Nitrile Gloves Market, By End-Use, 2016-2028 (US$ Bn)
9.6.1.6. Germany Nitrile Gloves Market, By Texture, 2016-2028 (US$ Bn)
9.6.2. France
9.6.2.1. France Nitrile Gloves Market Estimates and Forecast, 2016-2028 (US$ Bn)
9.6.2.2. France Nitrile Gloves Market, By Grade, 2016-2028 (US$ Bn)
9.6.2.3. France Nitrile Gloves Market, By Product, 2016-2028 (US$ Bn)
9.6.2.4. France Nitrile Gloves Market, By Type, 2016-2028 (US$ Bn)
9.6.2.5. France Nitrile Gloves Market, By End-Use, 2016-2028 (US$ Bn)
9.6.2.6. France Nitrile Gloves Market, By Texture, 2016-2028 (US$ Bn)
9.6.3. UK
9.6.3.1. UK Nitrile Gloves Market Estimates and Forecast, 2016-2028 (US$ Bn)
9.6.3.2. UK Nitrile Gloves Market, By Grade, 2016-2028 (US$ Bn)
9.6.3.3. UK Nitrile Gloves Market, By Product, 2016-2028 (US$ Bn)
9.6.3.4. UK Nitrile Gloves Market, By Type, 2016-2028 (US$ Bn)
9.6.3.5. UK Nitrile Gloves Market, By End-Use, 2016-2028 (US$ Bn)
9.6.3.6. UK Nitrile Gloves Market, By Texture, 2016-2028 (US$ Bn)
9.6.4. Italy
9.6.4.1. Italy Nitrile Gloves Market Estimates and Forecast, 2016-2028 (US$ Bn)
9.6.4.2. Italy Nitrile Gloves Market, By Grade, 2016-2028 (US$ Bn)
9.6.4.3. Italy Nitrile Gloves Market, By Product, 2016-2028 (US$ Bn)
9.6.4.4. Italy Nitrile Gloves Market, By Type, 2016-2028 (US$ Bn)
9.6.4.5. Italy Nitrile Gloves Market, By End-Use, 2016-2028 (US$ Bn)
9.6.4.6. Italy Nitrile Gloves Market, By Texture, 2016-2028 (US$ Bn)
9.6.5. Spain
9.6.5.1. Spain Nitrile Gloves Market Estimates and Forecast, 2016-2028 (US$ Bn)
9.6.5.2. Spain Nitrile Gloves Market, By Grade, 2016-2028 (US$ Bn)
9.6.5.3. Spain Nitrile Gloves Market, By Product, 2016-2028 (US$ Bn)
9.6.5.4. Spain Nitrile Gloves Market, By Type, 2016-2028 (US$ Bn)
9.6.5.5. Spain Nitrile Gloves Market, By End-Use, 2016-2028 (US$ Bn)
9.6.5.6. Spain Nitrile Gloves Market, By Texture, 2016-2028 (US$ Bn)
9.6.6. Rest of Europe
9.6.6.1. Rest of Europe Nitrile Gloves Market Estimates and Forecast, 2016-2028 (US$ Bn)
9.6.6.2. Rest of Europe Nitrile Gloves Market, By Grade, 2016-2028 (US$ Bn)
9.6.6.3. Rest of Europe Nitrile Gloves Market, By Product, 2016-2028 (US$ Bn)
9.6.6.4. Rest of Europe Nitrile Gloves Market, By Type, 2016-2028 (US$ Bn)
9.6.6.5. Rest of Europe Nitrile Gloves Market, By End-Use, 2016-2028 (US$ Bn)
9.6.6.6. Rest of Europe Nitrile Gloves Market, By Texture, 2016-2028 (US$ Bn)

10. Asia Pacific Nitrile Gloves Market Analysis
10.1. Asia Pacific Nitrile Gloves Market, by Grade, 2016-2028(US$ Bn)
10.1.1. Overview
10.1.2. SRC Analysis
10.2. Asia Pacific Nitrile Gloves Market, by Product, 2016-2028(US$ Bn)
10.2.1. Overview
10.2.2. SRC Analysis
10.3. Asia Pacific Nitrile Gloves Market, by Type, 2016-2028(US$ Bn)
10.3.1. Overview
10.3.2. SRC Analysis
10.4. Asia Pacific Nitrile Gloves Market, by End-Use, 2016-2028(US$ Bn)
10.4.1. Overview
10.4.2. SRC Analysis
10.5. Asia Pacific Nitrile Gloves Market, by Texture, 2016-2028(US$ Bn)
10.5.1. Overview
10.5.2. SRC Analysis
10.6. Asia Pacific Nitrile Gloves Market, by Country, 2016-2028 (US$ Bn)
10.6.1. China
10.6.1.1. China Nitrile Gloves Market Estimates and Forecast, 2016-2028 (US$ Bn)
10.6.1.2. China Nitrile Gloves Market, By Grade, 2016-2028 (US$ Bn)
10.6.1.3. China Nitrile Gloves Market, By Product, 2016-2028 (US$ Bn)
10.6.1.4. China Nitrile Gloves Market, By Type, 2016-2028 (US$ Bn)
10.6.1.5. China Nitrile Gloves Market, By End-Use, 2016-2028 (US$ Bn)
10.6.1.6. China Nitrile Gloves Market, By Texture, 2016-2028 (US$ Bn)
10.6.2. Japan
10.6.2.1. Japan Nitrile Gloves Market Estimates and Forecast, 2016-2028 (US$ Bn)
10.6.2.2. Japan Nitrile Gloves Market, By Grade, 2016-2028 (US$ Bn)
10.6.2.3. Japan Nitrile Gloves Market, By Product, 2016-2028 (US$ Bn)
10.6.2.4. Japan Nitrile Gloves Market, By Type, 2016-2028 (US$ Bn)
10.6.2.5. Japan Nitrile Gloves Market, By End-Use, 2016-2028 (US$ Bn)
10.6.2.6. Japan Nitrile Gloves Market, By Texture, 2016-2028 (US$ Bn)
10.6.3. India
10.6.3.1. India Nitrile Gloves Market Estimates and Forecast, 2016-2028 (US$ Bn)
10.6.3.2. India Nitrile Gloves Market, By Grade, 2016-2028 (US$ Bn)
10.6.3.3. India Nitrile Gloves Market, By Product, 2016-2028 (US$ Bn)
10.6.3.4. India Nitrile Gloves Market, By Type, 2016-2028 (US$ Bn)
10.6.3.5. India Nitrile Gloves Market, By End-Use, 2016-2028 (US$ Bn)
10.6.3.6. India Nitrile Gloves Market, By Texture, 2016-2028 (US$ Bn)
10.6.4. South Korea
10.6.4.1. South Korea Nitrile Gloves Market Estimates and Forecast, 2016-2028 (US$ Bn)
10.6.4.2. South Korea Nitrile Gloves Market, By Grade, 2016-2028 (US$ Bn)
10.6.4.3. South Korea Nitrile Gloves Market, By Product, 2016-2028 (US$ Bn)
10.6.4.4. South Korea Nitrile Gloves Market, By Type, 2016-2028 (US$ Bn)
10.6.4.5. South Korea Nitrile Gloves Market, By End-Use, 2016-2028 (US$ Bn)
10.6.4.6. South Korea Nitrile Gloves Market, By Texture, 2016-2028 (US$ Bn)
10.6.5. South-East Asia
10.6.5.1. South-East Asia Nitrile Gloves Market Estimates and Forecast, 2016-2028 (US$ Bn)
10.6.5.2. South-East Asia Nitrile Gloves Market, By Grade, 2016-2028 (US$ Bn)
10.6.5.3. South-East Asia Nitrile Gloves Market, By Product, 2016-2028 (US$ Bn)
10.6.5.4. South-East Asia Nitrile Gloves Market, By Type, 2016-2028 (US$ Bn)
10.6.5.5. South-East Asia Nitrile Gloves Market, By End-Use, 2016-2028 (US$ Bn)
10.6.5.6. South-East Asia Nitrile Gloves Market, By Texture, 2016-2028 (US$ Bn)
10.6.6. Rest of Asia Pacific
10.6.6.1. Rest of Asia Pacific Nitrile Gloves Market Estimates and Forecast, 2016-2028 (US$ Bn)
10.6.6.2. Rest of Asia Pacific Nitrile Gloves Market, By Grade, 2016-2028 (US$ Bn)
10.6.6.3. Rest of Asia Pacific Nitrile Gloves Market, By Product, 2016-2028 (US$ Bn)
10.6.6.4. Rest of Asia Pacific Nitrile Gloves Market, By Type, 2016-2028 (US$ Bn)
10.6.6.5. Rest of Asia Pacific Nitrile Gloves Market, By End-Use, 2016-2028 (US$ Bn)
10.6.6.6. Rest of Asia Pacific Nitrile Gloves Market, By Texture, 2016-2028 (US$ Bn)

11. Latin America Nitrile Gloves Market Analysis
11.1. Latin America Nitrile Gloves Market, by Grade, 2016-2028(US$ Bn)
11.1.1. Overview
11.1.2. SRC Analysis
11.2. Latin America Nitrile Gloves Market, by Product, 2016-2028(US$ Bn)
11.2.1. Overview
11.2.2. SRC Analysis
11.3. Latin America Nitrile Gloves Market, by Type, 2016-2028(US$ Bn)
11.3.1. Overview
11.3.2. SRC Analysis
11.4. Latin America Nitrile Gloves Market, by End-Use, 2016-2028(US$ Bn)
11.4.1. Overview
11.4.2. SRC Analysis
11.5. Latin America Nitrile Gloves Market, by Texture, 2016-2028(US$ Bn)
11.5.1. Overview
11.5.2. SRC Analysis
11.6. Latin America Nitrile Gloves Market, by Country, 2016-2028 (US$ Bn)
11.6.1. Brazil
11.6.1.1. Brazil Nitrile Gloves Market Estimates and Forecast, 2016-2028 (US$ Bn)
11.6.1.2. Brazil Nitrile Gloves Market, By Grade, 2016-2028 (US$ Bn)
11.6.1.3. Brazil Nitrile Gloves Market, By Product, 2016-2028 (US$ Bn)
11.6.1.4. Brazil Nitrile Gloves Market, By Type, 2016-2028 (US$ Bn)
11.6.1.5. Brazil Nitrile Gloves Market, By End-Use, 2016-2028 (US$ Bn)
11.6.1.6. Brazil Nitrile Gloves Market, By Texture, 2016-2028 (US$ Bn)
11.6.2. Mexico
11.6.2.1. Mexico Nitrile Gloves Market Estimates and Forecast, 2016-2028 (US$ Bn)
11.6.2.2. Mexico Nitrile Gloves Market, By Grade, 2016-2028 (US$ Bn)
11.6.2.3. Mexico Nitrile Gloves Market, By Product, 2016-2028 (US$ Bn)
11.6.2.4. Mexico Nitrile Gloves Market, By Type, 2016-2028 (US$ Bn)
11.6.2.5. Mexico Nitrile Gloves Market, By End-Use, 2016-2028 (US$ Bn)
11.6.2.6. Mexico Nitrile Gloves Market, By Texture, 2016-2028 (US$ Bn)
11.6.3. Rest of Latin America
11.6.3.1. Rest of Latin America Nitrile Gloves Market Estimates and Forecast, 2016-2028 (US$ Bn)
11.6.3.2. Rest of Latin America Nitrile Gloves Market, By Grade, 2016-2028 (US$ Bn)
11.6.3.3. Rest of Latin America Nitrile Gloves Market, By Product, 2016-2028 (US$ Bn)
11.6.3.4. Rest of Latin America Nitrile Gloves Market, By Type, 2016-2028 (US$ Bn)
11.6.3.5. Rest of Latin America Nitrile Gloves Market, By End-Use, 2016-2028 (US$ Bn)
11.6.3.6. Rest of Latin America Nitrile Gloves Market, By Texture, 2016-2028 (US$ Bn)

12. Middle East and Africa Nitrile Gloves Market Analysis
12.1. Middle East and Africa Nitrile Gloves Market, by Grade, 2016-2028(US$ Bn)
12.1.1. Overview
12.1.2. SRC Analysis
12.2. Middle East and Africa Nitrile Gloves Market, by Product, 2016-2028(US$ Bn)
12.2.1. Overview
12.2.2. SRC Analysis
12.3. Middle East and Africa Nitrile Gloves Market, by Type, 2016-2028(US$ Bn)
12.3.1. Overview
12.3.2. SRC Analysis
12.4. Middle East and Africa Nitrile Gloves Market, by End-Use, 2016-2028(US$ Bn)
12.4.1. Overview
12.4.2. SRC Analysis
12.5. Middle East and Africa Nitrile Gloves Market, by Texture, 2016-2028(US$ Bn)
12.5.1. Overview
12.5.2. SRC Analysis
12.6. Middle East and Africa Nitrile Gloves Market, by Country, 2016-2028 (US$ Bn)
12.6.1. GCC Countries
12.6.1.1. GCC Countries Nitrile Gloves Market Estimates and Forecast, 2016-2028 (US$ Bn)
12.6.1.2. GCC Countries Nitrile Gloves Market, By Grade, 2016-2028 (US$ Bn)
12.6.1.3. GCC Countries Nitrile Gloves Market, By Product, 2016-2028 (US$ Bn)
12.6.1.4. GCC Countries Nitrile Gloves Market, By Type, 2016-2028 (US$ Bn)
12.6.1.5. GCC Countries Nitrile Gloves Market, By End-Use, 2016-2028 (US$ Bn)
12.6.1.6. GCC Countries Nitrile Gloves Market, By Texture, 2016-2028 (US$ Bn)
12.6.2. South Africa
12.6.2.1. South Africa Nitrile Gloves Market Estimates and Forecast, 2016-2028 (US$ Bn)
12.6.2.2. South Africa Nitrile Gloves Market, By Grade, 2016-2028 (US$ Bn)
12.6.2.3. South Africa Nitrile Gloves Market, By Product, 2016-2028 (US$ Bn)
12.6.2.4. South Africa Nitrile Gloves Market, By Type, 2016-2028 (US$ Bn)
12.6.2.5. South Africa Nitrile Gloves Market, By End-Use, 2016-2028 (US$ Bn)
12.6.2.6. South Africa Nitrile Gloves Market, By Texture, 2016-2028 (US$ Bn)
12.6.3. Rest of Middle East and Africa
12.6.3.1. Rest of Middle East and Africa Nitrile Gloves Market Estimates and Forecast, 2016-2028 (US$ Bn)
12.6.3.2. Rest of Middle East and Africa Nitrile Gloves Market, By Grade, 2016-2028 (US$ Bn)
12.6.3.3. Rest of Middle East and Africa Nitrile Gloves Market, By Product, 2016-2028 (US$ Bn)
12.6.3.4. Rest of Middle East and Africa Nitrile Gloves Market, By Type, 2016-2028 (US$ Bn)
12.6.3.5. Rest of Middle East and Africa Nitrile Gloves Market, By End-Use, 2016-2028 (US$ Bn)
12.6.3.6. Rest of Middle East and Africa Nitrile Gloves Market, By Texture, 2016-2028 (US$ Bn)

13. Company Profiles
13.1. Hartalega Holdings Berhad
13.1.1. Company Overview
13.1.2. Products/Services Portfolio
13.1.3. Geographical Presence
13.1.4. Financial Summary
13.1.4.1. Market Revenue and Net Profit (2019-2021)
13.1.4.2. Business Segment Revenue Analysis
13.1.4.3. Geographical Revenue Analysis
13.2. Ansell Limited
13.3. Dynarex Corporation
13.4. United Glove Inc
13.5. Kossan Rubber Industries Bhd
13.6. Rubberex Corporation (M) Berhad
13.7. Top Glove Corporation Berhad
13.8. Unigloves (UK) Limited
13.9. YTY Group
13.10. Riverstone Resources Sdn Bhd

List of Figures

FIG. 1 Global Nitrile Gloves Market: Research Methodology
FIG. 2 Market Size Estimation – Top Down & Bottom up Approach
FIG. 3 Global Nitrile Gloves Market Segmentation
FIG. 4 Global Nitrile Gloves Market, by Grade, 2021 (US$ Bn)
FIG. 5 Global Nitrile Gloves Market, by Product, 2021 (US$ Bn)
FIG. 6 Global Nitrile Gloves Market, by Type, 2021 (US$ Bn)
FIG. 7 Global Nitrile Gloves Market, by End-Use, 2021 (US$ Bn)
FIG. 8 Global Nitrile Gloves Market, by Texture, 2021 (US$ Bn)
FIG. 9 Global Nitrile Gloves Market, by Geography, 2021 (US$ Bn)
FIG. 10 Attractive Investment Proposition, by Grade, 2021
FIG. 11 Attractive Investment Proposition, by Product, 2021
FIG. 12 Attractive Investment Proposition, by Type, 2021
FIG. 13 Attractive Investment Proposition, by End-Use, 2021
FIG. 14 Attractive Investment Proposition, by Texture, 2021
FIG. 15 Attractive Investment Proposition, by Geography, 2021
FIG. 16 Global Market Share Analysis of Key Nitrile Gloves Market Manufacturers, 2021
FIG. 17 Global Market Positioning of Key Nitrile Gloves Market Manufacturers, 2021
FIG. 18 Global Nitrile Gloves Market Value Contribution, By Grade, 2021 & 2028 (Value %)
FIG. 19 Global Nitrile Gloves Market, by Medical Grade, Value, 2016-2028 (US$ Bn)
FIG. 20 Global Nitrile Gloves Market, by Industrial Grade, Value, 2016-2028 (US$ Bn)
FIG. 21 Global Nitrile Gloves Market, by Food Grade, Value, 2016-2028 (US$ Bn)
FIG. 22 Global Nitrile Gloves Market Value Contribution, By Product, 2021 & 2028 (Value %)
FIG. 23 Global Nitrile Gloves Market, by Disposable, Value, 2016-2028 (US$ Bn)
FIG. 24 Global Nitrile Gloves Market, by Durable, Value, 2016-2028 (US$ Bn)
FIG. 25 Global Nitrile Gloves Market Value Contribution, By Type, 2021 & 2028 (Value %)
FIG. 26 Global Nitrile Gloves Market, by Powder-Free Nitrile Gloves, Value, 2016-2028 (US$ Bn)
FIG. 27 Global Nitrile Gloves Market, by Powder-Coated Nitrile Gloves, Value, 2016-2028 (US$ Bn)
FIG. 28 Global Nitrile Gloves Market Value Contribution, By End-Use, 2021 & 2028 (Value %)
FIG. 29 Global Nitrile Gloves Market, by Healthcare, Value, 2016-2028 (US$ Bn)
FIG. 30 Global Nitrile Gloves Market, by Food & Beverage, Value, 2016-2028 (US$ Bn)
FIG. 31 Global Nitrile Gloves Market, by Automotive, Value, 2016-2028 (US$ Bn)
FIG. 32 Global Nitrile Gloves Market, by Construction, Value, 2016-2028 (US$ Bn)
FIG. 33 Global Nitrile Gloves Market, by Oil & Gas, Value, 2016-2028 (US$ Bn)
FIG. 34 Global Nitrile Gloves Market, by Pharmaceutical, Value, 2016-2028 (US$ Bn)
FIG. 35 Global Nitrile Gloves Market, by Chemical, Value, 2016-2028 (US$ Bn)
FIG. 36 Global Nitrile Gloves Market, by Metal & Machinery, Value, 2016-2028 (US$ Bn)
FIG. 37 Global Nitrile Gloves Market, by Cleanrooms, Value, 2016-2028 (US$ Bn)
FIG. 38 Global Nitrile Gloves Market, by Others, Value, 2016-2028 (US$ Bn)
FIG. 39 Global Nitrile Gloves Market Value Contribution, By Texture, 2021 & 2028 (Value %)
FIG. 40 Global Nitrile Gloves Market, by Smooth, Value, 2016-2028 (US$ Bn)
FIG. 41 Global Nitrile Gloves Market, by Micro Roughened, Value, 2016-2028 (US$ Bn)
FIG. 42 Global Nitrile Gloves Market, by Aggressively Textured, Value, 2016-2028 (US$ Bn)
FIG. 43 U.S. Nitrile Gloves Market, 2016-2028 (US$ Bn)
FIG. 44 Canada Nitrile Gloves Market, 2016-2028 (US$ Bn)
FIG. 45 Germany Nitrile Gloves Market, 2016-2028 (US$ Bn)
FIG. 46 France Nitrile Gloves Market, 2016-2028 (US$ Bn)
FIG. 47 U.K. Nitrile Gloves Market, 2016-2028 (US$ Bn)
FIG. 48 Italy Nitrile Gloves Market, 2016-2028 (US$ Bn)
FIG. 49 Spain Nitrile Gloves Market, 2016-2028 (US$ Bn)
FIG. 50 Rest of Europe Nitrile Gloves Market, 2016-2028 (US$ Bn)
FIG. 51 China Nitrile Gloves Market, 2016-2028 (US$ Bn)
FIG. 52 Japan Nitrile Gloves Market, 2016-2028 (US$ Bn)
FIG. 53 India Nitrile Gloves Market, 2016-2028 (US$ Bn)
FIG. 54 South Korea Nitrile Gloves Market, 2016-2028 (US$ Bn)
FIG. 55 Southeast Asia Nitrile Gloves Market, 2016-2028 (US$ Bn)
FIG. 56 Rest of Asia Pacific Nitrile Gloves Market, 2016-2028 (US$ Bn)
FIG. 57 Latin America Nitrile Gloves Market, 2016-2028 (US$ Bn)
FIG. 58 Brazil Nitrile Gloves Market, 2016-2028 (US$ Bn)
FIG. 59 Mexico Nitrile Gloves Market, 2016-2028 (US$ Bn)
FIG. 60 Rest of Latin America Nitrile Gloves Market, 2016-2028 (US$ Bn)
FIG. 61 Middle East & Africa Nitrile Gloves Market, 2016-2028 (US$ Bn)
FIG. 62 GCC Countries Nitrile Gloves Market, 2016-2028 (US$ Bn)
FIG. 63 South Africa Nitrile Gloves Market, 2016-2028 (US$ Bn)
FIG. 64 Rest of Middle East and Africa Nitrile Gloves Market, 2016-2028 (US$ Bn)

List of Tables

TABLE 1 Market Snapshot: Global Nitrile Gloves Market
TABLE 2 Global Nitrile Gloves Market, by Competitive Benchmarking, 2021
TABLE 3 Global Nitrile Gloves Market, by Geographical Presence Analysis, 2021
TABLE 4 Global Nitrile Gloves Market, by Key Strategies Analysis, 2021
TABLE 5 Global Nitrile Gloves Market, by Grade, 2016-2028 (US$ Bn)
TABLE 6 Global Nitrile Gloves Market, by Product, 2016-2028 (US$ Bn)
TABLE 7 Global Nitrile Gloves Market, by Type, 2016-2028 (US$ Bn)
TABLE 8 Global Nitrile Gloves Market, by End-Use, 2016-2028 (US$ Bn)
TABLE 9 Global Nitrile Gloves Market, by Texture, 2016-2028 (US$ Bn)
TABLE 10 Global Nitrile Gloves Market, by Geography, 2016-2028 (US$ Bn)
TABLE 11 North America Nitrile Gloves Market, by Grade, 2016-2028 (US$ Bn)
TABLE 12 North America Nitrile Gloves Market, by Product, 2016-2028 (US$ Bn)
TABLE 13 North America Nitrile Gloves Market, by Type, 2016-2028 (US$ Bn)
TABLE 14 North America Nitrile Gloves Market, by End-Use, 2016-2028 (US$ Bn)
TABLE 15 North America Nitrile Gloves Market, by Texture, 2016-2028 (US$ Bn)
TABLE 16 North America Nitrile Gloves Market, by Country, 2016-2028 (US$ Bn)
TABLE 17 US Nitrile Gloves Market, by Grade, 2016-2028 (US$ Bn)
TABLE 18 US Nitrile Gloves Market, by Product, 2016-2028 (US$ Bn)
TABLE 19 US Nitrile Gloves Market, by Type, 2016-2028 (US$ Bn)
TABLE 20 US Nitrile Gloves Market, by End-Use, 2016-2028 (US$ Bn)
TABLE 21 US Nitrile Gloves Market, by Texture, 2016-2028 (US$ Bn)
TABLE 22 Canada Nitrile Gloves Market, by Grade, 2016-2028 (US$ Bn)
TABLE 23 Canada Nitrile Gloves Market, by Product, 2016-2028 (US$ Bn)
TABLE 24 Canada Nitrile Gloves Market, by Type, 2016-2028 (US$ Bn)
TABLE 25 Canada Nitrile Gloves Market, by End-Use, 2016-2028 (US$ Bn)
TABLE 26 Canada Nitrile Gloves Market, by Texture, 2016-2028 (US$ Bn)
TABLE 27 Europe Nitrile Gloves Market, by Grade, 2016-2028 (US$ Bn)
TABLE 28 Europe Nitrile Gloves Market, by Product, 2016-2028 (US$ Bn)
TABLE 29 Europe Nitrile Gloves Market, by Type, 2016-2028 (US$ Bn)
TABLE 30 Europe Nitrile Gloves Market, by End-Use, 2016-2028 (US$ Bn)
TABLE 31 Europe Nitrile Gloves Market, by Texture, 2016-2028 (US$ Bn)
TABLE 32 Europe Nitrile Gloves Market, by Country, 2016-2028 (US$ Bn)
TABLE 33 Germany Nitrile Gloves Market, by Grade, 2016-2028 (US$ Bn)
TABLE 34 Germany Nitrile Gloves Market, by Product, 2016-2028 (US$ Bn)
TABLE 35 Germany Nitrile Gloves Market, by Type, 2016-2028 (US$ Bn)
TABLE 36 Germany Nitrile Gloves Market, by End-Use, 2016-2028 (US$ Bn)
TABLE 37 Germany Nitrile Gloves Market, by Texture, 2016-2028 (US$ Bn)
TABLE 38 France Nitrile Gloves Market, by Grade, 2016-2028 (US$ Bn)
TABLE 39 France Nitrile Gloves Market, by Product, 2016-2028 (US$ Bn)
TABLE 40 France Nitrile Gloves Market, by Type, 2016-2028 (US$ Bn)
TABLE 41 France Nitrile Gloves Market, by End-Use, 2016-2028 (US$ Bn)
TABLE 42 France Nitrile Gloves Market, by Texture, 2016-2028 (US$ Bn)
TABLE 43 UK Nitrile Gloves Market, by Grade, 2016-2028 (US$ Bn)
TABLE 44 UK Nitrile Gloves Market, by Product, 2016-2028 (US$ Bn)
TABLE 45 UK Nitrile Gloves Market, by Type, 2016-2028 (US$ Bn)
TABLE 46 UK Nitrile Gloves Market, by End-Use, 2016-2028 (US$ Bn)
TABLE 47 UK Nitrile Gloves Market, by Texture, 2016-2028 (US$ Bn)
TABLE 48 Italy Nitrile Gloves Market, by Grade, 2016-2028 (US$ Bn)
TABLE 49 Italy Nitrile Gloves Market, by Product, 2016-2028 (US$ Bn)
TABLE 50 Italy Nitrile Gloves Market, by Type, 2016-2028 (US$ Bn)
TABLE 51 Italy Nitrile Gloves Market, by End-Use, 2016-2028 (US$ Bn)
TABLE 52 Italy Nitrile Gloves Market, by Texture, 2016-2028 (US$ Bn)
TABLE 53 Spain Nitrile Gloves Market, by Grade, 2016-2028 (US$ Bn)
TABLE 54 Spain Nitrile Gloves Market, by Product, 2016-2028 (US$ Bn)
TABLE 55 Spain Nitrile Gloves Market, by Type, 2016-2028 (US$ Bn)
TABLE 56 Spain Nitrile Gloves Market, by End-Use, 2016-2028 (US$ Bn)
TABLE 57 Spain Nitrile Gloves Market, by Texture, 2016-2028 (US$ Bn)
TABLE 58 Rest of Europe Nitrile Gloves Market, by Grade, 2016-2028 (US$ Bn)
TABLE 59 Rest of Europe Nitrile Gloves Market, by Product, 2016-2028 (US$ Bn)
TABLE 60 Rest of Europe Nitrile Gloves Market, by Type, 2016-2028 (US$ Bn)
TABLE 61 Rest of Europe Nitrile Gloves Market, by End-Use, 2016-2028 (US$ Bn)
TABLE 62 Rest of Europe Nitrile Gloves Market, by Texture, 2016-2028 (US$ Bn)
TABLE 63 Asia Pacific Nitrile Gloves Market, by Grade, 2016-2028 (US$ Bn)
TABLE 64 Asia Pacific Nitrile Gloves Market, by Product, 2016-2028 (US$ Bn)
TABLE 65 Asia Pacific Nitrile Gloves Market, by Type, 2016-2028 (US$ Bn)
TABLE 66 Asia Pacific Nitrile Gloves Market, by End-Use, 2016-2028 (US$ Bn)
TABLE 67 Asia Pacific Nitrile Gloves Market, by Texture, 2016-2028 (US$ Bn)
TABLE 68 Asia Pacific Nitrile Gloves Market, by Country, 2016-2028 (US$ Bn)
TABLE 69 China Nitrile Gloves Market, by Grade, 2016-2028 (US$ Bn)
TABLE 70 China Nitrile Gloves Market, by Product, 2016-2028 (US$ Bn)
TABLE 71 China Nitrile Gloves Market, by Type, 2016-2028 (US$ Bn)
TABLE 72 China Nitrile Gloves Market, by End-Use, 2016-2028 (US$ Bn)
TABLE 73 China Nitrile Gloves Market, by Texture, 2016-2028 (US$ Bn)
TABLE 74 Japan Nitrile Gloves Market, by Grade, 2016-2028 (US$ Bn)
TABLE 75 Japan Nitrile Gloves Market, by Product, 2016-2028 (US$ Bn)
TABLE 76 Japan Nitrile Gloves Market, by Type, 2016-2028 (US$ Bn)
TABLE 77 Japan Nitrile Gloves Market, by End-Use, 2016-2028 (US$ Bn)
TABLE 78 Japan Nitrile Gloves Market, by Texture, 2016-2028 (US$ Bn)
TABLE 79 India Nitrile Gloves Market, by Grade, 2016-2028 (US$ Bn)
TABLE 80 India Nitrile Gloves Market, by Product, 2016-2028 (US$ Bn)
TABLE 81 India Nitrile Gloves Market, by Type, 2016-2028 (US$ Bn)
TABLE 82 India Nitrile Gloves Market, by End-Use, 2016-2028 (US$ Bn)
TABLE 83 India Nitrile Gloves Market, by Texture, 2016-2028 (US$ Bn)
TABLE 84 South Korea Nitrile Gloves Market, by Grade, 2016-2028 (US$ Bn)
TABLE 85 South Korea Nitrile Gloves Market, by Product, 2016-2028 (US$ Bn)
TABLE 86 South Korea Nitrile Gloves Market, by Type, 2016-2028 (US$ Bn)
TABLE 87 South Korea Nitrile Gloves Market, by End-Use, 2016-2028 (US$ Bn)
TABLE 88 South Korea Nitrile Gloves Market, by Texture, 2016-2028 (US$ Bn)
TABLE 89 South East Asia Nitrile Gloves Market, by Grade, 2016-2028 (US$ Bn)
TABLE 90 South East Asia Nitrile Gloves Market, by Product, 2016-2028 (US$ Bn)
TABLE 91 South East Asia Nitrile Gloves Market, by Type, 2016-2028 (US$ Bn)
TABLE 92 South East Asia Nitrile Gloves Market, by End-Use, 2016-2028 (US$ Bn)
TABLE 93 South East Asia Nitrile Gloves Market, by Texture, 2016-2028 (US$ Bn)
TABLE 94 Rest of Asia Pacific Nitrile Gloves Market, by Grade, 2016-2028 (US$ Bn)
TABLE 95 Rest of Asia Pacific Nitrile Gloves Market, by Product, 2016-2028 (US$ Bn)
TABLE 96 Rest of Asia Pacific Nitrile Gloves Market, by Type, 2016-2028 (US$ Bn)
TABLE 97 Rest of Asia Pacific Nitrile Gloves Market, by End-Use, 2016-2028 (US$ Bn)
TABLE 98 Rest of Asia Pacific Nitrile Gloves Market, by Texture, 2016-2028 (US$ Bn)
TABLE 99 Latin America Nitrile Gloves Market, by Grade, 2016-2028 (US$ Bn)
TABLE 100 Latin America Nitrile Gloves Market, by Product, 2016-2028 (US$ Bn)
TABLE 101 Latin America Nitrile Gloves Market, by Type, 2016-2028 (US$ Bn)
TABLE 102 Latin America Nitrile Gloves Market, by End-Use, 2016-2028 (US$ Bn)
TABLE 103 Latin America Nitrile Gloves Market, by Texture, 2016-2028 (US$ Bn)
TABLE 104 Latin America Nitrile Gloves Market, by Country, 2016-2028 (US$ Bn)
TABLE 105 Brazil Nitrile Gloves Market, by Grade, 2016-2028 (US$ Bn)
TABLE 106 Brazil Nitrile Gloves Market, by Product, 2016-2028 (US$ Bn)
TABLE 107 Brazil Nitrile Gloves Market, by Type, 2016-2028 (US$ Bn)
TABLE 108 Brazil Nitrile Gloves Market, by End-Use, 2016-2028 (US$ Bn)
TABLE 109 Brazil Nitrile Gloves Market, by Texture, 2016-2028 (US$ Bn)
TABLE 110 Mexico Nitrile Gloves Market, by Grade, 2016-2028 (US$ Bn)
TABLE 111 Mexico Nitrile Gloves Market, by Product, 2016-2028 (US$ Bn)
TABLE 112 Mexico Nitrile Gloves Market, by Type, 2016-2028 (US$ Bn)
TABLE 113 Mexico Nitrile Gloves Market, by End-Use, 2016-2028 (US$ Bn)
TABLE 114 Mexico Nitrile Gloves Market, by Texture, 2016-2028 (US$ Bn)
TABLE 115 Rest of Latin America Nitrile Gloves Market, by Grade, 2016-2028 (US$ Bn)
TABLE 116 Rest of Latin America Nitrile Gloves Market, by Product, 2016-2028 (US$ Bn)
TABLE 117 Rest of Latin America Nitrile Gloves Market, by Type, 2016-2028 (US$ Bn)
TABLE 118 Rest of Latin America Nitrile Gloves Market, by End-Use, 2016-2028 (US$ Bn)
TABLE 119 Rest of Latin America Nitrile Gloves Market, by Texture, 2016-2028 (US$ Bn)
TABLE 120 Middle East and Africa Nitrile Gloves Market, by Grade, 2016-2028 (US$ Bn)
TABLE 121 Middle East and Africa Nitrile Gloves Market, by Product, 2016-2028 (US$ Bn)
TABLE 122 Middle East and Africa Nitrile Gloves Market, by Type, 2016-2028 (US$ Bn)
TABLE 123 Middle East and Africa Nitrile Gloves Market, by End-Use, 2016-2028 (US$ Bn)
TABLE 124 Middle East and Africa Nitrile Gloves Market, by Texture, 2016-2028 (US$ Bn)
TABLE 125 Middle East and Africa Nitrile Gloves Market, by Country, 2016-2028 (US$ Bn)
TABLE 126 GCC Countries Nitrile Gloves Market, by Grade, 2016-2028 (US$ Bn)
TABLE 127 GCC Countries Nitrile Gloves Market, by Product, 2016-2028 (US$ Bn)
TABLE 128 GCC Countries Nitrile Gloves Market, by Type, 2016-2028 (US$ Bn)
TABLE 129 GCC Countries Nitrile Gloves Market, by End-Use, 2016-2028 (US$ Bn)
TABLE 130 GCC Countries Nitrile Gloves Market, by Texture, 2016-2028 (US$ Bn)
TABLE 131 South Africa Nitrile Gloves Market, by Grade, 2016-2028 (US$ Bn)
TABLE 132 South Africa Nitrile Gloves Market, by Product, 2016-2028 (US$ Bn)
TABLE 133 South Africa Nitrile Gloves Market, by Type, 2016-2028 (US$ Bn)
TABLE 134 South Africa Nitrile Gloves Market, by End-Use, 2016-2028 (US$ Bn)
TABLE 135 South Africa Nitrile Gloves Market, by Texture, 2016-2028 (US$ Bn)
TABLE 136 Rest of Middle East and Africa Nitrile Gloves Market, by Grade, 2016-2028 (US$ Bn)
TABLE 137 Rest of Middle East and Africa Nitrile Gloves Market, by Product, 2016-2028 (US$ Bn)
TABLE 138 Rest of Middle East and Africa Nitrile Gloves Market, by Type, 2016-2028 (US$ Bn)
TABLE 139 Rest of Middle East and Africa Nitrile Gloves Market, by End-Use, 2016-2028 (US$ Bn)
TABLE 140 Rest of Middle East and Africa Nitrile Gloves Market, by Texture, 2016-2028 (US$ Bn)

Frequently Asked Questions

How does COVID-19 impact the global nitrile glove market?

The global nitrile glove market benefited from the COVID-19 pandemic. The pandemic increased demand for nitrile gloves, as experts believe that single-use nitrile gloves are essential for preventing disease spread and keeping medical and laboratory practices sanitary.

Which is the leading region of the market for nitrile gloves?

North America accounted for the largest share in the global nitrile glove market.

What are the key drivers for the growth of the nitrile glove market?

Increasing use by healthcare professionals, rising incidences of chronic diseases and the need for surgical interventions, and expanding use in cosmetic and plastic surgeries are anticipated to drive revenue growth in the global nitrile gloves market.

Which is the major nitrile glove market segment by type?

The powder-free nitrile gloves segment had a major global market share in 2021.

Which is the major nitrile glove market segment by grade?

The medical-grade segment had a major global market share in 2021.

Dental Fiberglass Posts Market

Published:
Report ID: 34534

Asia-Pacific Flow Cytometry Market

Published:
Report ID: 34524

ECG Equipment Market

Published:
Report ID: 4586

Surgical Helmet System Market

Published:
Report ID: 34383

Proton Therapy System Market

Published:
Report ID: 34380

Neonatal Infant Care Market

Published:
Report ID: 34369

Anesthesia And Respiratory Devices Market

Published:
Report ID: 12786

Actinic Keratosis Market

Published:
Report ID: 1278

Balloon Infusers Market

Published:
Report ID: 34116

3D Printing in Healthcare Market

Published:
Report ID: 1005

Compartment Syndrome Monitoring Market

Published:
Report ID: 34054

Wireless Portable Medical Devices Market

Published:
Report ID: 33989

Purchase Options

$2999
Delivery Format: Excel.
$4999
Designed for the individual purchaser.
$6999
Users located at a single corporate site or regional office.
$7999
Allowed for unlimited sharing globally within one company.
Smallform of Sample request

Have a question?

User Profile

Don’t settle for less – trust Mitul to help you find the best solution.

Report delivery within 24 to 48 hours

– Other Info –

What people say?-

User Review

I am very impressed with the information in this report. The author clearly did their research when they came up with this product and it has already given me a lot of ideas.

Jana Schmidt
CEDAR CX Technologies

– Connect with us –

Phone

+91 6232 49 3207


support

24/7 Research Support


sales@credenceresearch.com

– Research Methodology –

Going beyond the basics: advanced techniques in research methodology

– Trusted By –

Pepshi, LG, Nestle
Motorola, Honeywell, Johnson and johnson
LG Chem, SIEMENS, Pfizer
Unilever, Samsonite, QIAGEN