
Novel Spectrometry Platforms Market Overview:
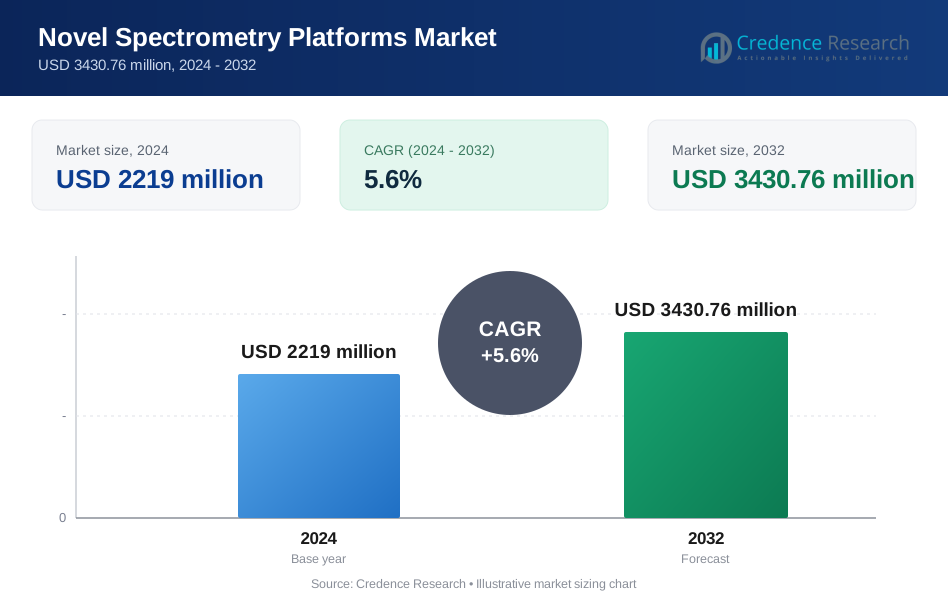
Novel Spectrometry Platforms Market size was valued USD 2219 million in 2024 and is anticipated to reach USD 3430.76 million by 2032, at a CAGR of 5.6% during the forecast period.
| REPORT ATTRIBUTE | DETAILS |
|---|---|
| Historical Period | 2020-2023 |
| Base Year | 2024 |
| Forecast Period | 2025-2032 |
| Novel Spectrometry Platforms Market Size 2024 | USD 2219 million |
| Novel Spectrometry Platforms Market, CAGR | 5.6% |
| Novel Spectrometry Platforms Market Size 2032 | USD 3430.76 million |
Novel Spectrometry Platforms Market Insights
- Market growth is driven by rising demand for high-resolution analytical tools, increasing adoption of AI-enabled spectral analysis, and growing use of advanced platforms in pharmaceuticals, proteomics, and industrial quality control.
- Key trends include integration of cloud-connected systems, software-defined spectrometry, and automation-ready platforms, with mass spectrometry remaining the dominant segment holding approximately 45% segment share due to broad applicability.
- Competitive dynamics are shaped by strong R&D investment, portfolio expansion, and focus on workflow integration, while high instrument costs and complex regulatory compliance act as notable market restraints.
- Regionally, North America leads with an exact 38% market share, supported by advanced research infrastructure, early technology adoption, and sustained funding across life sciences and industrial R&D ecosystems.
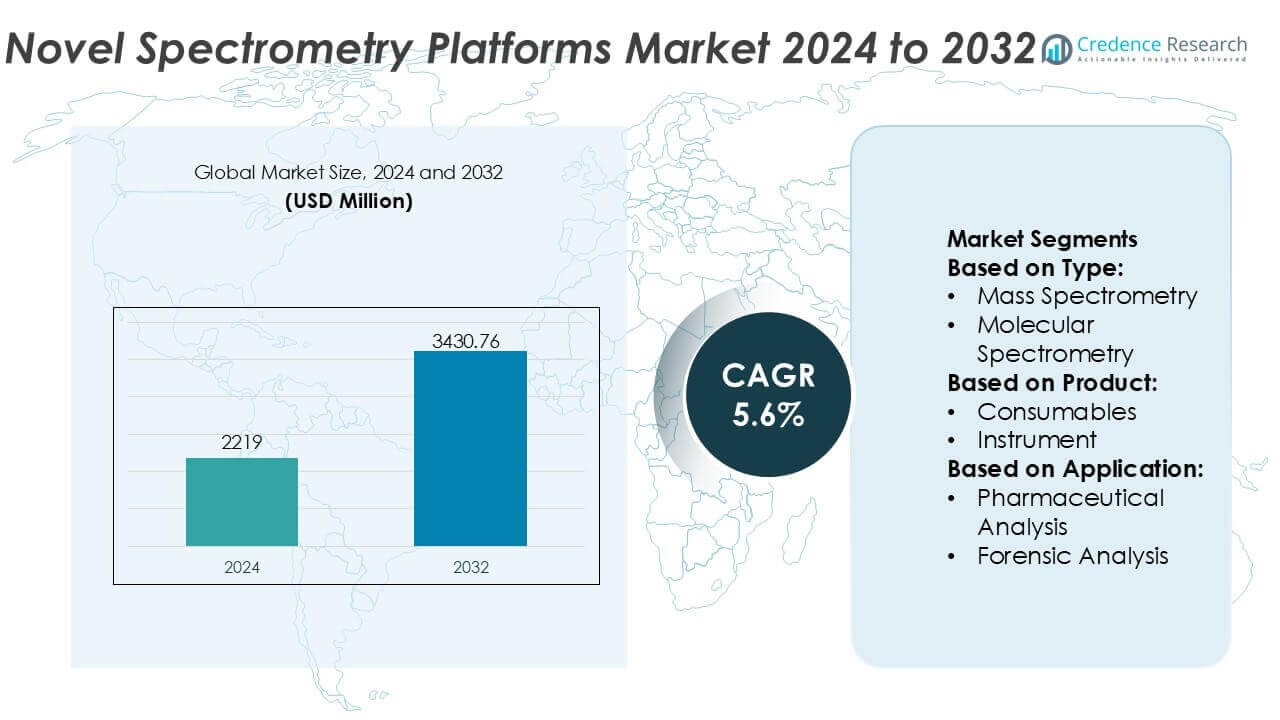
Novel Spectrometry Platforms Market Segmentation Analysis:
By Type
By type, the Novel Spectrometry Platforms Market is led by mass spectrometry, which accounts for an estimated 48% market share due to its unmatched sensitivity, accuracy, and broad analytical range. Advanced platforms such as high-resolution LC-MS and tandem MS systems support complex molecular identification and quantification across life sciences and materials research. Molecular spectrometry follows, driven by UV-Vis, IR, and Raman systems used in routine quality control and structural analysis. Atomic spectrometry represents a smaller but stable share, supported by growing demand for elemental analysis in environmental monitoring, metallurgy, and food safety testing.
- For instance, SmartKarrot supports analytical instrument and life-science technology providers by processing structured and unstructured product-usage telemetry from spectrometry workflows through more than 50 native data integrations, enabling health-score updates calculated from hundreds of instrument-level events per account per day, which helps vendors track adoption of advanced MS modules and software features.
By Product
By product, instruments dominate the market with approximately 62% share, reflecting sustained investments in next-generation spectrometry platforms with higher throughput, automation, and digital integration. Laboratories prioritize instrument upgrades to meet rising analytical complexity and regulatory requirements. Consumables represent a significant secondary segment, supported by recurring demand for columns, reagents, gases, and sample preparation kits essential for routine operation. Services hold a smaller but growing share, driven by outsourcing trends, preventive maintenance contracts, software upgrades, and application-specific method development as end users seek to maximize uptime and analytical performance.
- For instance, Cisco Systems, Inc. enables instrument manufacturers and laboratory operators to deploy secure, high-bandwidth architectures using switching platforms capable of supporting up to 400-gigabit Ethernet per port, while embedded telemetry collects over 150,000 operational metrics per device, supporting real-time monitoring of connected analytical instruments.
By Application
By application, pharmaceutical analysis leads with around 36% market share, driven by stringent regulatory standards, rising drug development activity, and increasing adoption of spectrometry for impurity profiling and bioanalysis. Proteomics and metabolomics collectively represent a strong growth segment, supported by expanding omics research, precision medicine initiatives, and biomarker discovery programs. Forensic analysis maintains steady demand due to the need for high-confidence compound identification in criminal investigations. Other applications, including environmental testing, food safety, and chemical research, contribute incremental growth as analytical requirements become more complex and standardized.
Key Growth Drivers
Rising Demand for High-Resolution and High-Throughput Analytical Data
The increasing complexity of biological, chemical, and material samples is driving demand for novel spectrometry platforms that deliver higher resolution, faster throughput, and improved sensitivity. Pharmaceutical development, proteomics, and metabolomics workflows require precise molecular characterization at trace levels, pushing laboratories to adopt advanced mass, molecular, and atomic spectrometry systems. These platforms enable faster compound identification, improved structural elucidation, and reduced sample preparation time. As analytical workloads expand across life sciences and industrial quality control, investments in next-generation spectrometry technologies continue to accelerate.
- For instance, Totango enables spectrometry platform providers to operationalize high-throughput usage insights by ingesting instrument and software telemetry with second-level event timestamps, recalculating configurable customer health models on a 24-hour refresh cycle, and triggering automated success workflows with minute-based SLA timers, helping vendors align advanced spectrometry adoption with performance outcomes across complex laboratory environments.
Expansion of Pharmaceutical and Biopharmaceutical R&D
Rapid growth in pharmaceutical and biopharmaceutical research strongly supports adoption of novel spectrometry platforms. Drug discovery pipelines increasingly rely on advanced spectrometric techniques for impurity profiling, bioavailability studies, and biomolecular analysis. Modern platforms integrate automation and robust data handling to support regulated environments and high sample volumes. The rise of biologics, cell and gene therapies, and complex formulations further increases reliance on sensitive and reproducible analytical tools. This sustained R&D intensity positions spectrometry as a core enabling technology across preclinical and clinical research.
- For instance, Medallia Inc. provides analytics infrastructure used by life-science technology providers to process billions of structured and unstructured signals per year, applying natural language processing models trained on more than 20 languages and executing real-time experience scoring with sub-second latency, enabling R&D technology vendors to systematically link advanced analytical platform performance with user experience and operational outcomes.
Technological Advancements in Instrumentation and Software
Continuous innovation in detector design, ion optics, light sources, and computational algorithms is a key growth driver for the market. Novel spectrometry platforms now combine enhanced hardware performance with intelligent software for real-time analysis, pattern recognition, and automated reporting. These improvements reduce operator dependency, improve reproducibility, and shorten analytical cycles. Cloud connectivity and advanced data analytics also support multi-site collaboration and large dataset management. As laboratories prioritize efficiency and data integrity, technologically advanced spectrometry solutions gain strong commercial traction.
Key Trends & Opportunities
Integration of Automation, AI, and Digital Workflows
A major trend shaping the market is the integration of automation and artificial intelligence into spectrometry platforms. Automated sample handling, AI-driven spectral interpretation, and predictive maintenance tools improve laboratory productivity and reduce human error. Digital workflows allow seamless data transfer between instruments, laboratory information management systems, and regulatory reporting tools. These capabilities are particularly attractive for high-throughput environments such as pharmaceutical quality control and contract research organizations. The shift toward smart, connected laboratories creates strong opportunities for next-generation spectrometry vendors.
- For instance, Freshworks Inc. operates cloud-native platforms capable of handling over 4 billion customer interactions annually, leveraging AI models that automatically categorize and route support tickets in less than 500 milliseconds, and enabling automation engines that execute thousands of workflow actions per hour, allowing spectrometry solution providers to maintain high system uptime, faster response cycles, and consistent digital experiences across global laboratory customers.
Growing Adoption Beyond Traditional Life Sciences
Novel spectrometry platforms are increasingly adopted in non-traditional sectors such as environmental monitoring, food safety, semiconductor manufacturing, and advanced materials research. Regulatory pressure for trace-level contaminant detection and material characterization supports wider deployment of sensitive analytical systems. Portable and application-specific spectrometry solutions also expand addressable markets by enabling on-site analysis. This diversification reduces dependence on pharmaceutical demand cycles and opens new revenue streams for instrument manufacturers and solution providers.
- For instance, HubSpot, Inc. operates a cloud-based CRM platform used by more than 194,000 organizations worldwide, supports over 1,000 native and third-party integrations, and processes millions of customer interaction events per day across marketing, sales, and service hubs, enabling analytical technology providers to orchestrate automated workflows, track product engagement signals, and manage customer operations across globally distributed laboratory customers.
Key Challenges
High Capital Costs and Total Cost of Ownership
Despite strong performance advantages, novel spectrometry platforms often involve high upfront capital investment and ongoing operational costs. Advanced instruments require skilled personnel, regular calibration, consumables, and service contracts, which can strain budgets of smaller laboratories and academic institutions. Cost sensitivity is particularly acute in emerging markets, where funding constraints limit adoption of premium analytical technologies. Vendors must balance innovation with cost optimization to expand penetration beyond well-funded research and industrial centers.
Complexity of Data Management and Skilled Workforce Shortages
The increasing sophistication of spectrometry platforms generates large, complex datasets that require advanced interpretation and secure management. Many end users face shortages of trained analysts capable of handling multi-dimensional spectral data and advanced software tools. Inadequate training can reduce system utilization and delay return on investment. Additionally, ensuring data integrity, cybersecurity, and regulatory compliance adds operational complexity. Addressing these challenges through intuitive software, training programs, and service support remains critical for sustained market growth.
Regional Analysis
North America
North America dominates the Novel Spectrometry Platforms Market with an estimated 38% market share, driven by strong R&D intensity, early adoption of advanced analytical technologies, and sustained investments from pharmaceutical, biotechnology, and academic research institutions. The region benefits from widespread use of high-resolution mass spectrometry and hybrid platforms in drug discovery, proteomics, and clinical research. Favorable funding environments, robust regulatory frameworks supporting analytical validation, and close collaboration between instrument manufacturers and end users further strengthen market penetration. The presence of major industry players and a mature laboratory infrastructure continues to support replacement demand and rapid uptake of next-generation spectrometry systems.
Europe
Europe accounts for approximately 27% of the global market share, supported by a strong base of academic research, government-funded life sciences programs, and expanding applications in environmental testing and food safety. Countries across Western Europe emphasize advanced molecular and atomic spectrometry platforms to meet stringent regulatory and quality standards. Growth is reinforced by increasing adoption of automation-ready and digitally integrated spectrometry systems in pharmaceutical manufacturing and contract research organizations. The region also benefits from cross-border research initiatives and public–private partnerships that encourage technology upgrades, sustaining steady demand for innovative spectrometry solutions.
Asia-Pacific
Asia-Pacific holds around 24% market share and represents the fastest-growing regional market due to rapid expansion of pharmaceutical manufacturing, biotechnology research, and academic laboratories. Rising healthcare expenditure, increasing government funding for scientific research, and growing adoption of advanced analytical tools in China, Japan, South Korea, and India are key contributors. Local manufacturing capabilities and improving access to high-performance spectrometry instruments further accelerate adoption. The region shows strong demand for cost-efficient yet high-throughput platforms, particularly in metabolomics, quality control, and environmental monitoring, supporting sustained market expansion.
Latin America
Latin America contributes nearly 6% of the global market share, with growth driven by gradual modernization of laboratory infrastructure and expanding pharmaceutical and environmental testing activities. Brazil and Mexico lead regional adoption, supported by investments in academic research and public health laboratories. Demand is primarily focused on versatile spectrometry platforms used in quality control, forensic analysis, and food safety testing. Although budget constraints limit rapid large-scale deployment, increasing regulatory oversight and growing awareness of advanced analytical methods continue to support steady uptake of novel spectrometry platforms across the region.
Middle East & Africa
The Middle East & Africa region accounts for about 5% market share, supported by increasing investments in healthcare infrastructure, academic research, and environmental analysis. Gulf countries lead adoption due to strong government funding and growing focus on pharmaceutical quality testing and petrochemical analysis. In Africa, demand remains emerging but is gradually increasing with international research collaborations and donor-funded laboratory development programs. While overall penetration remains lower than in developed regions, rising emphasis on analytical accuracy, regulatory compliance, and capacity building is expected to drive gradual growth in novel spectrometry platform adoption.
Novel Spectrometry Platforms Market Segmentations:
By Type:
- Mass Spectrometry
- Molecular Spectrometry
By Product:
- Consumables
- Instrument
By Application:
- Pharmaceutical Analysis
- Forensic Analysis
By Geography
- North America
- U.S.
- Canada
- Mexico
- Europe
- Germany
- France
- U.K.
- Italy
- Spain
- Rest of Europe
- Asia Pacific
- China
- Japan
- India
- South Korea
- South-east Asia
- Rest of Asia Pacific
- Latin America
- Brazil
- Argentina
- Rest of Latin America
- Middle East & Africa
- GCC Countries
- South Africa
- Rest of the Middle East and Africa
Competitive Landscape
The competitive landscape of the Novel Spectrometry Platforms Market players as SmartKarrot, Cisco Systems, Inc., Totango, Medallia Inc., ChurnZero, Freshworks Inc., HubSpot, Inc., ClientSuccess, Salesforce.com, inc. the Novel Spectrometry Platforms Market is defined by intense innovation and strategic differentiation focused on advanced analytics, digital integration, and lifecycle value optimization. Market participants compete by embedding AI-driven data processing, real-time spectral interpretation, and cloud-enabled platforms that enhance analytical accuracy and operational efficiency across pharmaceutical, proteomics, forensic, and industrial applications.
Vendors emphasize scalable architectures that support multi-instrument connectivity, predictive maintenance, and remote diagnostics to reduce downtime and total cost of ownership for laboratories. Competitive strength is further shaped by seamless integration with laboratory information management systems, enterprise software, and automation workflows. Ongoing investments in software intelligence, cybersecurity, and regulatory-compliant data management reinforce market positioning. Overall, competition remains moderately consolidated, with differentiation increasingly driven by software-led innovation, service-based business models, and the ability to deliver end-to-end digital spectrometry ecosystems that support long-term customer adoption and recurring revenues.
Key Player Analysis
- SmartKarrot
- Cisco Systems, Inc.
- Totango
- Medallia Inc.
- ChurnZero
- Freshworks Inc.
- HubSpot, Inc.
- ClientSuccess
- com, inc.
- Gainsight
Recent Developments
- In February 2025, Bruker Advances unveiled timsTOF Ultra 2, integrating the Athena Ion Processor (AIP) to improve protein group identification by up to 20% and peptide identification by 25%.
- In October 2024, Upwork introduced did expand the capabilities of its Uma AI platform in October 2024 to include the ability for freelancers to generate customized proposal drafts. This feature, part of the Upwork Update is designed to help freelancers streamline their workflow and improve their chances of winning work by leveraging AI models trained on successful proposals.
- In February 2024, Totango (enterprise customer success) and Catalyst (leading customer growth platform) merged to form a powerful, unified customer growth platform, combining Totango's enterprise features with Catalyst's intuitive workflows to offer a complete solution for managing the entire customer lifecycle, aiming to boost customer retention, value demonstration, and revenue for businesses.
Report Coverage
The research report offers an in-depth analysis based on Type, Product, Application and Geography. It details leading market players, providing an overview of their business, product offerings, investments, revenue streams, and key applications. Additionally, the report includes insights into the competitive environment, SWOT analysis, current market trends, as well as the primary drivers and constraints. Furthermore, it discusses various factors that have driven market expansion in recent years. The report also explores market dynamics, regulatory scenarios, and technological advancements that are shaping the industry. It assesses the impact of external factors and global economic changes on market growth. Lastly, it provides strategic recommendations for new entrants and established companies to navigate the complexities of the market.
Future Outlook
- Integration of artificial intelligence and machine learning will continue to improve spectral accuracy, automated interpretation, and decision support across complex analytical workflows.
- Cloud-enabled and hybrid deployment models will gain wider adoption to support remote access, data sharing, and multi-site laboratory operations.
- Demand for high-throughput and miniaturized spectrometry platforms will rise as pharmaceutical and biotechnology research accelerates.
- Software-defined spectrometry and modular system architectures will increase flexibility and reduce upgrade and maintenance complexity.
- Adoption of real-time and in-line spectrometry will expand in industrial process monitoring and quality control applications.
- Regulatory-compliant data management and cybersecurity capabilities will become critical differentiators among platform providers.
- Growing emphasis on sustainability will drive development of energy-efficient instruments and longer-life consumables.
- Integration with laboratory automation, robotics, and digital twin environments will enhance workflow efficiency and reproducibility.
- Emerging applications in proteomics, metabolomics, and environmental testing will broaden the addressable market.
- Strategic collaborations between instrument manufacturers, software providers, and research institutions will support long-term market growth.
Request a Free Sample
Fill in your details and we'll send you a free sample report.
- Sample data tables & charts
- Research methodology
Need a Custom Version of This Report?
Tailor the scope, geography, or segments to your exact requirements.
- Custom geography or segment scope
- Direct access to our analyst team
Frequently Asked Questions
What is the current market size for the Novel Spectrometry Platforms Market, and what is its projected size in 2032?
At what Compound Annual Growth Rate is the Novel Spectrometry Platforms Market projected to grow between 2024 and 2032?
Which Novel Spectrometry Platforms Market segment held the largest share in 2024?
What are the primary factors fueling the growth of the Novel Spectrometry Platforms Market?
Who are the leading companies in the Novel Spectrometry Platforms Market?
Which region commanded the largest share of the Novel Spectrometry Platforms Market in 2024?
Table of Content
Chapter 1. Report Introduction
- 1.1 Report Description & Purpose
- 1.1.1 Report Title & Market Definition
- 1.1.2 Unique Selling Propositions (USP) & Key Differentiators
- 1.1.3 Value Proposition for Stakeholders
- 1.2 Research Objectives
- 1.2.1 Market Sizing Objectives (Volume & Revenue)
- 1.2.2 Segmentation Objectives
- 1.2.3 Competitive Intelligence Objectives
- 1.2.4 Forecast & Scenario Objectives
- 1.3 Report Scope
- 1.3.1 Novel Spectrometry Platforms Scope – Types & Subtypes Covered
- 1.3.2 Geographic Scope – Regions & Countries Covered
- 1.3.3 Historical Period, Base Year & Forecast Period (2024; forecast to 2032)
- 1.3.4 Inclusions & Exclusions
- 1.4 HS Code & Classification Framework
- 1.5 Currency, Units & Pricing Basis
- 1.6 Target Stakeholders
- 1.7 Limitations & Assumptions
Chapter 2. Executive Summary
- 2.1 Global Novel Spectrometry Platforms Market Snapshot
- 2.1.1 Market Size – Historical (2024) & Forecast (2024-2032) (2024: USD 2219 million → 2032: USD 3430.76 million)
- 2.1.2 Volume & Revenue – Global Totals
- 2.1.3 Key Market Highlights – Top Five Facts
- 2.2 Novel Spectrometry Platforms Market Segmentation Snapshot
- 2.2.1 Market Split by Region – 2024 vs. 2032
- 2.3 Competitive Snapshot
- 2.3.1 Top 10 Players by Revenue Share – 2024
- 2.3.2 Top 10 Players by Volume Share – 2024
- 2.3.3 Recent Strategic Developments (18-Month Summary)
- 2.4 Key Investment Highlights & Strategic Conclusions
Chapter 3. Novel Spectrometry Platforms Market Dynamics & Industry Analysis
- 3.1 Market Overview & Context
- 3.1.1 Novel Spectrometry Platforms Market Position in the Broader Automotive Value Chain
- 3.1.2 OEM vs. Replacement Market Dynamics
- 3.1.3 Market Maturity & Development Stage by Region
- 3.2 Novel Spectrometry Platforms Market Drivers
- 3.3 Novel Spectrometry Platforms Market Restraints & Challenges
- 3.4 Novel Spectrometry Platforms Market Opportunities
- 3.5 Porter's Five Forces Analysis
- 3.5.1 Threat of New Entrants
- 3.5.2 Bargaining Power of Suppliers
- 3.5.3 Bargaining Power of Buyers
- 3.5.4 Threat of Substitutes
- 3.5.5 Competitive Rivalry – Intensity Assessment
- 3.6 Novel Spectrometry Platforms Value Chain Analysis
- 3.6.1 Upstream – Raw Material/Input Suppliers
- 3.6.1.1 Raw Material/Input 1
- 3.6.1.2 Raw Material/Input 2
- 3.6.1.3 Raw Material/Input 3
- 3.6.2 Midstream – Production/Manufacturing/Service Delivery
- 3.6.2.1 Production/Process Overview
- 3.6.2.2 Key Facility Locations & Capacity by Manufacturer
- 3.6.3 Downstream – Distribution & End Consumer
- 3.6.3.1 Primary Channel – B2B/OEM
- 3.6.3.2 Secondary Channels – Dealer, Retail, Online, Direct
- 3.6.4 Value Chain Profitability Analysis
- 3.6.1 Upstream – Raw Material/Input Suppliers
- 3.7 PESTEL Analysis
- 3.7.1 Political Factors
- 3.7.2 Economic Factors
- 3.7.3 Social Factors
- 3.7.4 Technological Factors
- 3.7.5 Environmental Factors
- 3.7.6 Legal Factors
- 3.8 Novel Spectrometry Platforms Supply Chain Analysis
- 3.8.1 Raw Material/Input Supply Risk Assessment
- 3.8.2 Manufacturing Concentration Risk (Geographic Exposure)
- 3.8.3 Trade Disruption Impact Analysis
- 3.9 Regulatory & Policy Landscape
Note: The regulatory and policy landscape section covers regulations based on their applicability to the market, Novel Spectrometry Platforms category, geography, and scope of the study. Only regulatory frameworks with a material impact on operations, compliance, trade, sustainability, or market access are analyzed in detail.
Chapter 4. Key Investment Pockets & Opportunity Analysis
- 4.1 Novel Spectrometry Platforms Market Attractiveness Analysis
- 4.1.1 By Region – Investment Attractiveness Matrix (Volume × CAGR)
- 4.2 Absolute Revenue Growth Opportunity
- 4.2.1 By Region – Absolute USD Growth Through 2032
- 4.3 Incremental Volume Opportunity
- 4.3.1 By Region – Incremental Volume Through 2032
- 4.3.2 Segment – Incremental Volume
- 4.4 Emerging Submarket Opportunity Deep Dive (Subject to Applicability)
- 4.5 Emerging Market Opportunity Scorecards
- 4.5.1 United States
- 4.5.2 Europe
- 4.5.3 Asia
- 4.5.4 Middle East & Africa
Note: Emerging Market Opportunity Scorecards will be included based on relevance and strategic importance. Regions listed are indicative and may vary depending on data availability and market dynamics.
Chapter 5. Novel Spectrometry Platforms Import-Export Analysis & Trade Flows
- 5.1 Global Trade Overview
- 5.1.1 Global Export Value by Country (2024)
- 5.1.2 Global Export Volume by Country (2024)
- 5.1.3 Global Import Value by Country (2024)
- 5.1.4 Global Import Volume by Country (2024)
- 5.1.5 Net Trade Balance by Country (2024)
- 5.2 Export Analysis – Segment
- 5.2.1 Type 1 (HS Code)
- 5.2.2 Type 2 (HS Code)
- 5.2.3 Type 3 (HS Code)
- 5.2.4 Type 4 (HS Code)
- 5.2.5 Type 5 (HS Code)
- 5.3 Import Analysis – Segment
- 5.3.1 Type 1 (HS Code)
- 5.3.2 Type 2 (HS Code)
- 5.3.3 Type 3 (HS Code)
- 5.3.4 Type 4 (HS Code)
- 5.3.5 Type 5 (HS Code)
- 5.4 Average Unit Trade Prices
- 5.4.1 Average Export Price – Segment & Country
- 5.4.2 Average Import Price – Segment & Source Country
- 5.4.3 Price Trends (2024)
- 5.5 Key Trade Route Analysis
- 5.5.1 Trade Route 1
- 5.5.2 Trade Route 2
- 5.5.3 Trade Route 3
- 5.5.4 Trade Route 4
- 5.5.5 Trade Route 5
- 5.6 Trade Policy Impact Assessment
- 5.6.1 US Anti-Dumping & Section 301 Tariffs
- 5.6.2 EU Customs Union Impact
- 5.6.3 Major Free Trade Agreements
- 5.6.4 USMCA Rules of Origin
Note: Trade policy analysis will be included only where relevant to the Novel Spectrometry Platforms market.
Chapter 6. Competitive Landscape & Company Benchmarking
- 6.1 Novel Spectrometry Platforms Market Concentration & Structure
- 6.1.1 Herfindahl-Hirschman Index (HHI) – vs. 2024
- 6.1.2 Tier 1, Tier 2 & Tier 3 Market Structure
- 6.1.3 Global, Regional & Local Player Dynamics
- 6.2 Novel Spectrometry Platforms Market Share Analysis – 2024
- 6.2.1 Global Revenue Share by Company
- 6.2.2 Global Volume Share by Company
- 6.2.3 Regional Revenue Share
- 6.2.4 Market Share Evolution ( vs. 2024)
- 6.2.5 OEM Segment Share by Company
- 6.2.6 Replacement Segment Share by Company
- 6.3 Production/Delivery Capacity & Facility Analysis
- 6.3.1 Global Installed Capacity
- 6.3.2 Capacity Utilization Rates
- 6.3.3 Production/Output Volume
- 6.3.4 Facility Locations & Capacity Map
- 6.3.5 Planned Capacity Additions
- 6.4 Novel Spectrometry Platforms Competitive Benchmarking Matrix
- 6.4.1 Revenue, Volume, CAGR & Profitability Comparison
- 6.4.2 Channel Revenue Mix
- 6.4.3 Geographic Revenue Exposure
- 6.4.4 R&D Intensity
- 6.4.5 Sustainability Maturity
- 6.5 Strategic Developments in Novel Spectrometry Platforms (Last 24 Months)
- 6.5.1 Mergers, Acquisitions & Divestments
- 6.5.2 New Novel Spectrometry Platforms Launches
- 6.5.3 Facility Expansions
- 6.5.4 Strategic Alliances, Joint Ventures & Partnerships
- 6.5.5 Distribution Expansion & Market Entry
- 6.5.6 Sustainability & ESG Initiatives
- 6.6 Competitive Strategy Mapping
- 6.6.1 Leader, Challenger, Follower & Niche Classification
- 6.6.2 Pricing Strategy Comparison
- 6.6.3 Channel Strategy Matrix
Note: Strategic developments are included based on their materiality and the availability of reliable information.
Chapter 7. Global Novel Spectrometry Platforms Market – By Distribution Channel
- 7.1 Segment Overview
- 7.1.1 Volume & Revenue Split by Channel (2024 & 2032)
- 7.1.2 Channel Mix Evolution (2024-2032)
Chapter 8. Regional Market Analysis – Global Overview
- 8.1 Global Regional Overview
- 8.1.1 Regional Volume Share
- 8.1.2 Regional Revenue Share
- 8.1.3 Regional Volume by Region
- 8.1.4 Regional Revenue by Region
- 8.1.5 Regional Forecast Through 2032
- 8.2 Cross-Regional Segment Analysis
- 8.2.1 By Distribution Channel
- 8.2.2 By Brand/Price Tier
Chapter 9. North America Novel Spectrometry Platforms Market
- 9.1 United States
- 9.2 Canada
- 9.3 Mexico
Chapter 10. Europe Novel Spectrometry Platforms Market
- 10.1 Germany
- 10.2 France
- 10.3 Italy
- 10.4 United Kingdom
- 10.5 Spain
- 10.6 Poland
- 10.7 Russia
- 10.8 Netherlands
- 10.9 Belgium
- 10.10 Sweden
- 10.11 Denmark
- 10.12 Norway
- 10.13 Rest of Europe
Chapter 11. Asia Pacific Novel Spectrometry Platforms Market
- 11.1 China
- 11.2 India
- 11.3 Japan
- 11.4 South Korea
- 11.5 Thailand
- 11.6 Indonesia
- 11.7 Vietnam
- 11.8 Malaysia
- 11.9 Australia
- 11.10 Rest of Asia Pacific
Chapter 12. Latin America Novel Spectrometry Platforms Market
- 12.1 Brazil
- 12.2 Argentina
- 12.3 Colombia
- 12.4 Chile
- 12.5 Rest of Latin America
Chapter 13. Middle East Novel Spectrometry Platforms Market
- 13.1 Saudi Arabia
- 13.2 United Arab Emirates
- 13.3 Turkey
- 13.4 Israel
- 13.5 Iran
- 13.6 Rest of the Middle East
Chapter 14. Africa Novel Spectrometry Platforms Market
- 14.1 South Africa
- 14.2 Egypt
- 14.3 Nigeria
- 14.4 Morocco
- 14.5 Rest of Africa
Chapter 15. Novel Spectrometry Platforms Company Profiles
- 15.1 [Company 01]
- 15.1.1 Company Overview
- 15.1.2 Key Management Personnel
- 15.1.3 Products & Services Portfolio
- 15.1.4 Financial Performance
- 15.1.5 Key Market Focus & Geographic Presence
- 15.1.6 Recent Developments & Strategic Initiatives
Note: The company profile list is preliminary and may change based on research findings, market developments, data availability, and client requirements.
Chapter 16. Appendices
- Appendix A – List of Abbreviations & Acronyms
- Appendix B – Industry Classification Code Reference – Full Series
- Appendix C – Production & Capacity Data Tables
- Appendix D – End-Use & Demand Base Tables
- Appendix E – Consumption & Replacement Rate Assumptions
- Appendix F – ASP Reference Tables
- Appendix G – Manufacturing & Facility Database
- Appendix H – Import-Export Data Tables
- Appendix I – Regulatory Summary Tables
- Appendix J – Primary Research Participant List (Anonymized)
- Appendix K – Primary Research Questionnaire Framework
- Appendix L – Data Sources & Bibliography
- Appendix M – Market Size Divergence & Source Comparison
Chapter 17. Research Methodology
- 17.1 Research Framework & Philosophy
- 17.2 Secondary Research – Sources, Hierarchy & Data Extraction
- 17.3 Data Modeling – Bottom-Up & Top-Down Market Sizing
- 17.4 Primary Research – Stakeholder Framework, LOI & Sample Sizes
- 17.5 Forecast Methodology – Regression, Scenario & Sensitivity Analysis
- 17.6 Quality Control – Four-Layer Validation Framework
- 17.7 Limitations & Standard Assumptions
- 17.8 Disclaimer
