| REPORT ATTRIBUTE |
DETAILS |
| Historical Period |
2020-2023 |
| Base Year |
2024 |
| Forecast Period |
2025-2032 |
| Oil and Gas Integrity Market Size 2024 |
USD 18,480.0 Million |
| Oil and Gas Integrity Market, CAGR |
6.70% |
| Oil and Gas Integrity Market Size 2032 |
USD 31,046.8 Million |
Market Overview
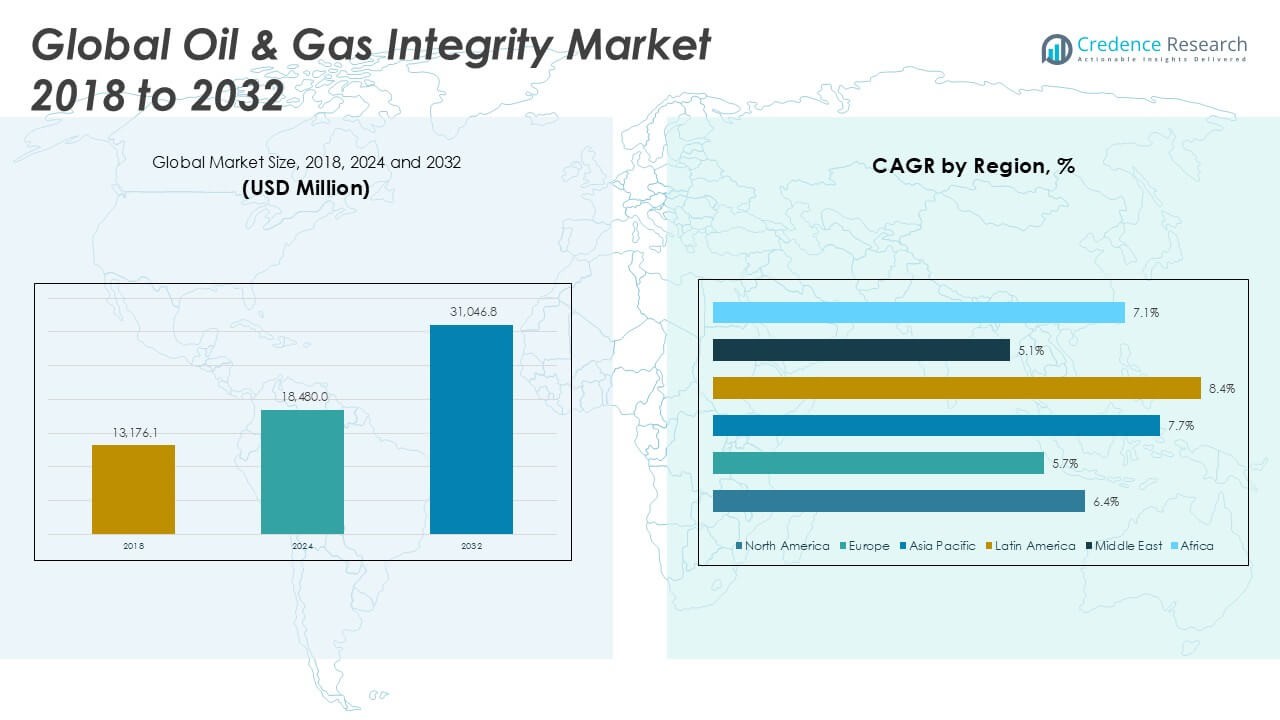
The Global Oil and Gas Integrity Market is projected to grow from USD 18,480.0 million in 2024 to an estimated USD 31,046.8 million by 2032, with a compound annual growth rate (CAGR) of 6.70% from 2025 to 2032.
Stringent regulatory frameworks and increasing focus on operational safety drive market expansion. Operators face growing pressure to monitor aging pipelines and offshore assets, prompting adoption of automated inline inspection tools, corrosion monitoring systems and predictive maintenance platforms. Digital transformation underpins these trends, as companies integrate robotics, artificial intelligence and Internet of Things (IoT) sensors to enhance real-time data analytics and reduce unplanned downtime.
North America commands the largest share, underpinned by extensive mature infrastructure and stringent U.S. regulatory standards. Europe follows closely, driven by the North Sea’s aging assets and strict environmental mandates. Asia Pacific exhibits the highest CAGR, fueled by rapid capacity additions in China, India and Southeast Asia. The Middle East & Africa region benefits from ongoing offshore developments, while Latin America pursues integrity upgrades in its deepwater fields. Key players shaping the competitive landscape include Baker Hughes, Schlumberger, Halliburton, T.D. Williamson, SGS, Intertek, Applus+, ROSEN and TÜV SÜD.
Access crucial information at unmatched prices!
Request your sample report today & start making informed decisions powered by Credence Research Inc.!
Download Sample
Market Insights
- The Global Oil and Gas Integrity Market will expand from USD 18,480 million in 2024 to USD 31,046.8 million by 2032 at a 6.7% CAGR, driven by infrastructure upgrades and compliance investments.
- Strict safety and environmental standards force operators to secure advanced inspection and monitoring solutions.
- Robotics, artificial intelligence and IoT integration enable real-time condition monitoring and predictive maintenance.
- Significant upfront expenses for hardware and software slow adoption among smaller operators.
- Limited availability of certified integrity specialists hampers efficient deployment of inspection technologies.
- With a 32.8% market share and USD 6,061 million revenue in 2024, it leads due to mature pipelines and stringent U.S. regulations.
- Forecast to grow at a 7.7% CAGR, the region benefits from rapid capacity additions in China, India and Southeast Asia.
Market Drivers
Rising Regulatory Compliance and Safety Standards Driving Market Demand
The Global Oil and Gas Integrity Market responds to stricter safety regulations worldwide. Regulators enforce pipeline inspection, risk assessment and maintenance protocols. Companies allocate budgets to meet new environmental mandates. It supports demand for non-destructive testing and monitoring solutions. Firms partner with certified service providers to ensure compliance. This dynamic boosts investments in advanced integrity management services.
- For instance, in 2023, the U.S. Pipeline and Hazardous Materials Safety Administration (PHMSA) reported that over 9,700 pipeline integrity inspections were conducted nationwide, reflecting increased regulatory enforcement and industry compliance efforts.
Advances in Digital Inspection Technologies Elevate Integrity Solutions
The Global Oil and Gas Integrity Market benefits from robotics, AI and IoT adoption. Operators deploy smart sensors and data analytics for real-time condition monitoring. It integrates digital twins with inspection workflows to predict equipment failure. Service providers customize solutions that deliver detailed integrity insights. Companies streamline workflows and reduce manual errors. Growth in software and sensor sales drives market expansion.
- For instance, Baker Hughes announced in 2024 that its digital inspection division deployed more than 2,500 robotic crawlers and drones for oil and gas asset inspections globally, significantly increasing the volume and accuracy of integrity assessments.
Growth in Aging Infrastructure Requires Comprehensive Integrity Management
The Global Oil and Gas Integrity Market tackles challenges posed by aging pipelines and offshore platforms. Operators face corrosion, fatigue and material degradation risks. It prioritizes preventive maintenance to avoid costly shutdowns. Service firms conduct thorough risk assessments and targeted repairs. Clients invest in reinforcement and upgrade projects for legacy assets. Demand for turnkey integrity services rises across mature regions.
Expansion of Offshore and Unconventional Resources Spurs Integrity Services
The Global Oil and Gas Integrity Market experiences growth from offshore developments and shale exploitation. Exploration firms deploy horizontal drilling and subsea installations that require robust integrity checks. It uses advanced inspection tools to assess complex infrastructure. Service providers expand geographic presence to support remote operations. Clients count on agile response teams for emergency repairs. Market players increase training programs to maintain skilled workforce.
Market Trends
Integration of Predictive Analytics and AI for Proactive Maintenance
The Global Oil and Gas Integrity Market harnesses predictive analytics and AI to forecast equipment health. It enables operators to schedule maintenance before failures occur. Service providers deliver analytic platforms that assess sensor data in real time. Companies adopt machine learning models that detect corrosion patterns and material fatigue. It improves decision making and extends asset life. Stakeholders seek deeper insights to reduce inspection costs and unplanned downtime.
- For instance, a study by the American Society of Civil Engineers found that AI models achieved over 90 accuracy in predicting corrosion failures and over 80 accuracy for equipment failures in oil pipeline systems, demonstrating the tangible impact of predictive analytics on proactive maintenance strategies
Adoption of Robotics and Automated Inspection Tools in Challenging Environments
The Global Oil and Gas Integrity Market deploys robotic crawlers and drones for remote inspections. It reaches subsea pipelines, offshore platforms and confined spaces without human entry. Operators rely on unmanned vehicles equipped with ultrasonic and magnetic sensors. It captures high-resolution data at precise intervals. Companies minimize safety risks and accelerate survey cycles. Service firms expand their fleets of automated tools to meet rising demand. Clients appreciate faster turnaround times for integrity assessments.
- For instance, Baker Hughes’ Waygate Technologies division deployed over 1,000 crawler robots equipped with non-destructive testing payloads and advanced PTZ cameras for oil and gas inspections worldwide in 2024, enabling remote surveys in hazardous and hard-to-access locations
Shift toward Cloud-Based Data Management and Collaborative Platforms
The Global Oil and Gas Integrity Market moves data management to cloud platforms. It centralizes inspection reports, sensor feeds and maintenance logs. Operators grant secure access to engineers, auditors and regulators worldwide. It supports real-time collaboration and remote decision making. Companies integrate integrity data with asset management systems for unified workflows. Service providers offer subscription models that lower upfront costs. Clients achieve faster reporting cycles and improved compliance.
Emphasis on Sustainability and Eco-Friendly Integrity Practices
The Global Oil and Gas Integrity Market emphasizes corrosion inhibitors and non-toxic coatings to protect pipelines. It selects inspection fluids and chemicals that comply with environmental standards. Operators replace hazardous agents with biodegradable alternatives. It seeks to reduce carbon footprint through efficient field operations and digital surveys. Companies adopt reuse strategies for inspection equipment to limit waste. Service firms publish sustainability reports to demonstrate green credentials. Clients reward providers that align with corporate environmental goals.
Market Challenges
High Capital Investment and Technology Integration Barriers
The Global Oil and Gas Integrity Market faces pressure from high equipment and system acquisition costs. Operators must allocate significant budgets for inspection tools and digital platforms. It demands careful cost-benefit analysis for each technology purchase. Service firms struggle to justify return on investment in early adoption phases. Vendors offer financing options to offset upfront expenses. Clients seek transparent pricing and modular solutions. Budget constraints often delay critical integrity assessments.
- For instance, Equipment Leases, a direct lender in the sector, reports a portfolio worth more than $1.5 billion and over $200 million available for oil and gas equipment loans, illustrating the substantial capital required and the financing solutions offered to help companies manage high acquisition costs
Skilled Workforce Shortage and Regulatory Complexity
The Global Oil and Gas Integrity Market must address talent gaps in inspection and data analysis. Companies invest in training programs to close skill deficits in robotics operation and data interpretation. It also navigates overlapping regulations across multiple jurisdictions. Service providers dedicate teams to track evolving standards and ensure compliance. Clients require clear audit trails and robust documentation. Staff turnover and remote location assignments further complicate project execution. Operators balance regulatory demands with workforce development priorities.
Market Opportunities
Expansion into Digital Integrity Solutions for Enhanced Asset Monitoring
The Global Oil and Gas Integrity Market holds significant potential in digital territory, driven by operators who demand advanced systems to monitor assets. It offers room for providers who design cloud-native data platforms. Service firms can team with software vendors and deliver unified dashboards. It ensures real-time risk evaluation that prevents unplanned shutdowns. Clients value interoperable tools that integrate with SCADA assets. It creates cross-sell paths for end-to-end integrity services. Vendors tailor subscription-based models to speed adoption.
Growth Through Strategic Collaborations and New Region Penetration
The Global Oil and Gas Integrity Market gains from strategic partnerships between inspection experts and technology innovators. It allows joint development of autonomous inspection vehicles for complex terrains. Service firms can enter new regions with joint ventures that share local knowledge. It reduces entry barriers and accelerates project mobilization. Clients benefit from combined strengths that deliver turnkey integrity programs. It opens revenue streams in offshore wind and hydrogen transport sectors. Providers expand their footprint and secure long-term contracts.
Market Segmentation Analysis
By Component
The Global Oil and Gas Integrity Market divides into hardware, software, and services, with hardware dominating revenue share due to demand for inspection equipment. It benefits from growth in sensor modules and monitoring devices. Software drives value through analytics platforms and digital twins. It enables condition assessment and risk modeling. Services sustain recurring revenue via maintenance, calibration, and inspection contracts. It encourages full lifecycle support and bundled solutions that meet operator requirements.
- For instance, according to a 2024 industry report, over 500,000 inspection tools and sensor modules were deployed globally across oil and gas assets, highlighting the large-scale adoption of hardware components in integrity management
By Deployment
The Global Oil and Gas Integrity Market deployment analysis divides into onshore and offshore segments. It generates major revenue in onshore operations thanks to dense pipeline networks and land-based assets. It requires inspection trucks and portable test rigs for rapid assessments. Offshore offers higher growth potential through platform and subsea integrity checks. It employs specialized vessels and remotely operated vehicles for submerged infrastructure surveys. It drives balanced investment across both environments.
- For instance, government and company data show that in 2024, more than 70,000 onshore integrity assessments were conducted worldwide, compared to approximately 18,000 offshore inspections using remotely operated vehicles and specialized survey vessels
By Sector
The Global Oil and Gas Integrity Market segments into upstream, midstream, and downstream sectors, each with distinct demands. Upstream firms invest heavily in wellhead and pipeline integrity to sustain production. It demands robust inspection tools and predictive analytics. Midstream operators focus on long-distance pipelines and storage terminals. It seeks corrosion monitoring and leak detection systems. Downstream facilities require integrity management for refineries and processing units. It relies on service contracts covering inspection, repair, and compliance.
Segments
Based on Component
- Hardware
- Software
- Services
Based on Deployment
Based on Sector
- Upstream
- Midstream
- Downstream
Based on Region
- North America
- Europe
- UK
- France
- Germany
- Italy
- Spain
- Russia
- Belgium
- Netherlands
- Austria
- Sweden
- Poland
- Denmark
- Switzerland
- Rest of Europe
- Asia Pacific
- China
- Japan
- South Korea
- India
- Australia
- Thailand
- Indonesia
- Vietnam
- Malaysia
- Philippines
- Taiwan
- Rest of Asia Pacific
- Latin America
- Brazil
- Argentina
- Peru
- Chile
- Colombia
- Rest of Latin America
- Middle East
- UAE
- KSA
- Israel
- Turkey
- Iran
- Rest of Middle East
- Africa
- Egypt
- Nigeria
- Algeria
- Morocco
- Rest of Africa
Regional Analysis
North America Oil and Gas Integrity Market
North America posted USD 6,061 m in 2024 and USD 9,128 m in 2032. It holds 32.8% share of the Oil and Gas Integrity Market with 6.4% CAGR. Operators upgrade pipelines and conduct frequent inspections. They invest in corrosion control and integrity management. Service firms boost digital inspection and analytics offerings. Regional partnerships foster integrated service models.
Europe Oil and Gas Integrity Market
Europe generated USD 4,528 m in 2024 and USD 6,861 m in 2032. It holds 24.5% share of the Oil and Gas Integrity Market with 5.7% CAGR. Mature assets lead to higher demand for monitoring services. Operators invest in aging pipeline assessments and upgrades. Service providers enhance remote inspection and risk analytics. Regional funding supports bundled integrity solutions.
Asia Pacific Oil and Gas Integrity Market
Asia Pacific achieved USD 4,010 m in 2024 and USD 7,948 m in 2032. It holds 21.7% share of the Oil and Gas Integrity Market with 7.7% CAGR. Rapid capacity additions drive integrity assessments. Operators deploy digital sensors and predictive analytics. Service firms expand in China, India and Southeast Asia. Regional growth supports turnkey integrity offerings.
Latin America Oil and Gas Integrity Market
Latin America posted USD 1,885 m in 2024 and USD 3,943 m in 2032. It holds 10.2% share of the Oil and Gas Integrity Market with 8.4% CAGR. Emerging offshore fields demand robust integrity checks. Operators adopt automated inspection tools for pipelines. Service providers enter with turnkey maintenance solutions. Regional partnerships boost service deployment speed.
Middle East Oil and Gas Integrity Market
Middle East recorded USD 1,127 m in 2024 and USD 1,832 m in 2032. It holds 6.1% share of the Oil and Gas Integrity Market with 5.1% CAGR. Offshore developments fuel demand for subsea inspections. Operators deploy ROVs and corrosion monitoring systems. Service firms partner locally to ensure rapid support. Regional growth opens new integrity service contracts.
Africa Oil and Gas Integrity Market
Africa reached USD 869 m in 2024 and USD 1,335 m in 2032. It holds 4.7% share of the Oil and Gas Integrity Market with 7.1% CAGR. Operators upgrade land pipelines and storage facilities. They invest in portable NDT tools and analytics. Service providers expand training and field support. Regional potential attracts new service entrants.
Key players
- Bureau Veritas
- Schlumberger
- Baker Hughes
- DNV
- Emerson Electric
- Rosen Group
- Intertek Group
- Aker Solutions
- Wood Group
- Oceaneering International
- Fluor Corporation
- Technip Energies
- GE Digital
- Quest Integrity
Competitive Analysis
The Oil and Gas Integrity Market features fierce competition among global service and technology providers. Leaders differentiate through advanced inspection tools, digital platforms and comprehensive service portfolios. It pushes firms to invest in predictive analytics and robotics to secure new contracts. Bureau Veritas and DNV leverage certification expertise to build trust with operators. Schlumberger and Baker Hughes deploy integrated solutions across upstream and midstream sectors. Emerson Electric and GE Digital focus on software innovation for real-time monitoring. Rosen Group and Quest Integrity emphasize specialized corrosion and integrity assessments. Aker Solutions and Technip Energies partner on offshore projects to broaden geographic reach. Intertek, Wood Group and Fluor expand maintenance services through local alliances. This dynamic landscape rewards agility, technical depth and strong client relationships.
Recent Developments
- In Q1 2025, Bureau Veritas reported a strong financial performance with €1.5587 billion in revenue, marking an 8.3% year-over-year increase. The company also announced a €200 million share buyback program, signaling confidence in its business and a commitment to enhancing shareholder returns. This buyback is scheduled to be completed by the end of June 2025.
- In 2025, SLB (formerly Schlumberger) received two SEAL Business Sustainability Awards, including one for its Celsius Energy carbon-reduction system according to SLB. The awards highlight SLB’s commitment to sustainable business practices and innovation in the energy sector. The Celsius Energy system, specifically, was recognized for its ability to help large facilities reduce their carbon footprint through geoenergy solutions for heating and cooling.

Market Concentration and Characteristics
The Oil and Gas Integrity Market displays moderate concentration with the top five players accounting for over half of global revenue. It features high entry barriers due to capital-intensive equipment and stringent certification requirements. Market leaders leverage robust service portfolios and advanced digital tools to secure long-term contracts. Smaller firms carve niches through specialized services or regional focus. The sector demands continuous innovation, and providers update inspection technologies and analytics platforms. Regulatory compliance mandates further solidify established vendors’ positions. Fragmented segments such as subsea integrity assessments retain room for new entrants with unique capabilities. This balance yields stable competition and gradual shifts in market share toward digital-centric providers.
Shape Your Report to Specific Countries or Regions & Enjoy 30% Off!
Report Coverage
The research report offers an in-depth analysis based on Component, Deployment, Sector and Region. It details leading market players, providing an overview of their business, product offerings, investments, revenue streams, and key applications. Additionally, the report includes insights into the competitive environment, SWOT analysis, current market trends, as well as the primary drivers and constraints. Furthermore, it discusses various factors that have driven market expansion in recent years. The report also explores market dynamics, regulatory scenarios, and technological advancements that are shaping the industry. It assesses the impact of external factors and global economic changes on market growth. Lastly, it provides strategic recommendations for new entrants and established companies to navigate the complexities of the market.
Future Outlook
- Operators will integrate AI-driven predictive maintenance into standard integrity programs. It will identify potential failures early and optimize inspection schedules.
- Service providers will expand remote monitoring networks using IoT sensor arrays. They will deliver continuous data streams to centralized analytics platforms.
- Robotics deployment will rise for inspections in confined spaces and subsea environments. Drones and crawlers will replace manual surveys in high-risk areas.
- Cloud-native integrity platforms will gain traction among global operators. They will enable real-time collaboration between field teams and headquarters.
- Blockchain-based data management will enhance auditability and tamper-proof reporting. It will streamline compliance verification across multiple jurisdictions.
- Corrosion-resistant composite materials will see broader adoption in pipeline repairs. They will reduce downtime and extend asset service life cost-effectively.
- Strategic alliances between technology innovators and regional service firms will increase. They will accelerate market entry and regional solution customization.
- Subscription-based service models will emerge, shifting from capex to opex structures. They will lower upfront costs and improve budget predictability for operators.
- Sustainability mandates will drive demand for eco-friendly inspection fluids and coatings. Providers will develop biodegradable alternatives and publish carbon-footprint metrics.
- Workforce development programs will intensify to address talent shortages. Companies will offer certification courses and virtual reality training for integrity specialists.


