Market Overview:
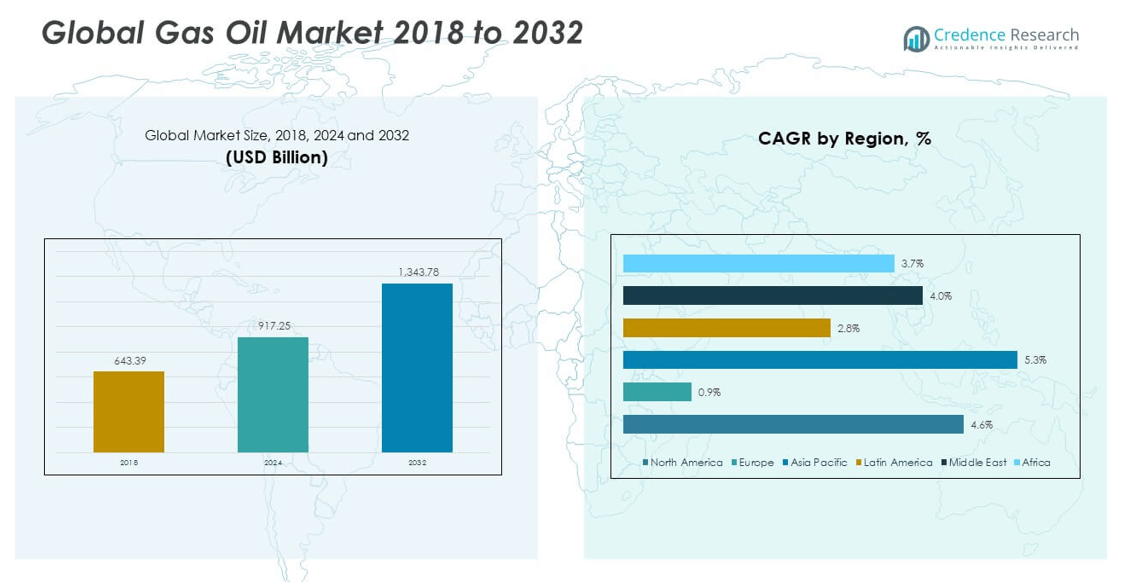
The Global Gas Oil Market size was valued at USD 643.39 billion in 2018 to USD 917.25 billion in 2024 and is anticipated to reach USD 1,343.78 billion by 2032, at a CAGR of 4.55% during the forecast period.
| REPORT ATTRIBUTE |
DETAILS |
| Historical Period |
2020-2023 |
| Base Year |
2024 |
| Forecast Period |
2025-2032 |
| Gas Oil Market Size 2024 |
USD 917.25 billion |
| Gas Oil Market, CAGR |
4.55% |
| Gas Oil Market Size 2032 |
USD 1,343.78 billion |
Gas oil remains a crucial energy commodity, serving as a primary fuel in transportation, industrial production, and power generation. Its role in supporting economic activities across sectors ensures sustained demand, with both emerging and developed markets contributing to consumption growth. The market is being driven by rising energy demand due to expanding industrial activity, infrastructure development, and urbanization, particularly in Asia-Pacific, the Middle East, and parts of Africa. Advances in refining technology, along with investments in modern fuel infrastructure, are improving efficiency and product quality. The maritime sector is a notable consumer, with gas oil increasingly used as a cleaner alternative to heavy fuel oil in compliance with international emissions standards.
Regionally, Asia-Pacific dominates the market due to strong industrialization and large-scale transportation networks, while North America and Europe maintain steady demand supported by established industrial and logistics sectors. Emerging economies in Latin America, the Middle East, and Africa are witnessing accelerating growth, driven by infrastructure expansion and increased energy needs. The shift toward cleaner, low-sulfur fuel variants is shaping market strategies, creating new opportunities for innovation and sustainable growth.
Market Insights:
- The Global Gas Oil Market size was valued at USD 643.39 billion in 2018 to USD 917.25 billion in 2024 and is projected to reach USD 1,343.78 billion by 2032, at a CAGR of 4.55%.
- Growth is driven by rising global energy demand, transportation sector expansion, and industrialization in emerging economies.
- Regulatory compliance costs and crude oil price volatility act as key restraints.
- Asia-Pacific holds the largest share, supported by industrial growth and high transportation fuel consumption.
- The market is shifting toward low-sulfur, cleaner fuel variants to meet environmental standards.
- Technological advancements in refining are improving product quality and efficiency.
- Bio-based and blended fuels are emerging as niche growth segments.
Access crucial information at unmatched prices!
Request your sample report today & start making informed decisions powered by Credence Research Inc.!
Download Sample
Market Drivers:
Rising Global Energy Demand and Economic Expansion:
The Global Gas Oil Market is fueled by growing global energy consumption driven by industrialization, urbanization, and expanding transportation networks. Gas oil serves as a vital energy source for commercial vehicles, shipping, and power generation, making it a backbone of modern economies. Emerging markets, particularly in Asia-Pacific and Africa, are increasing their consumption in line with infrastructure development and industrial growth. Economic expansion in these regions continues to strengthen demand for both conventional and low-sulfur gas oil products.
- For instance, in 2024, developing economies in Asia accounted for approximately 40% of the additional global gas demand, led by robust industrial usage and infrastructure expansion in countries like China and India. China’s natural gas demand alone increased by over 7%, and India’s rose by 10% in 2024 as both countries expanded natural gas grids for industrial and power generation needs.
Growth in Transportation and Logistics Infrastructure:
The transportation sector remains the largest consumer of gas oil, benefiting from ongoing investment in road, rail, and maritime infrastructure. Expanding logistics networks, supported by e-commerce growth, require reliable and high-energy-density fuels like gas oil. The global shipping industry is also contributing to demand, especially with the transition to marine gas oil as a compliant fuel option under IMO emission standards. These factors ensure stable and sustained consumption patterns.
- For instance, global demand for marine gas oil surged as the shipping industry adapted to new emission standards. The majority of the world’s merchant fleet has transitioned to very low sulfur fuel oil (VLSFO) following the IMO 2020 regulations, with companies like Maersk deploying VLSFO across more than 700 vessels in their fleet by 2025.
Technological Advancements in Refining and Fuel Quality:
The market is experiencing significant benefits from advancements in refining processes, which are enabling the production of cleaner, more efficient fuels. Modern refineries are incorporating desulfurization technologies to meet stringent environmental standards. These innovations not only reduce emissions but also improve fuel performance, making gas oil more competitive compared to alternative fuels. Refiners are also diversifying output to cater to both domestic and export markets, enhancing global trade opportunities.
Strategic Importance in Industrial and Power Generation Sectors:
Gas oil plays a critical role in industrial operations and power generation, particularly in areas where natural gas infrastructure is underdeveloped. It is used in backup power systems, manufacturing processes, and heavy machinery operations. In developing countries, gas oil often bridges the gap in energy supply, providing a reliable source for both urban and rural communities. This versatility and reliability ensure its continued relevance in the global energy mix.
Market Trends:
Shift Toward Low-Sulfur and Cleaner Fuel Variants:
The Global Gas Oil Market is witnessing a shift toward low-sulfur gas oil in response to stringent emission regulations. Regulatory frameworks, such as IMO 2020, have accelerated demand for compliant fuels in the shipping industry. This transition is pushing refiners to invest in hydrodesulfurization units and cleaner production technologies, shaping the future of gas oil offerings.
- For instance, The International Maritime Organization confirmed that by 2025, most shipping companies worldwide successfully converted from heavy fuel oil to very low sulfur options (maximum 0.5% sulfur content) to remain compliant.
Integration of Digital Monitoring in Fuel Supply Chains:
Digitalization is transforming the gas oil supply chain with real-time monitoring, predictive maintenance, and inventory management systems. Advanced data analytics help optimize fuel distribution and reduce operational costs. The integration of IoT and AI in storage and transportation is improving efficiency, transparency, and compliance in global fuel markets.
- For instance, AI-powered digital twins are being used by companies like Church Brothers Farms for fuel logistics, replicating entire supply networks to optimize delivery routes and proactively identify supply bottlenecks.
Expansion of Cross-Border Energy Trade:
The market is seeing robust growth in cross-border gas oil trade, particularly between resource-rich regions and high-demand markets. Strategic trade partnerships and improved port infrastructure are facilitating larger and faster shipments. Export opportunities are expanding for countries with surplus refining capacity, while importing nations benefit from competitive pricing and diversified supply sources.
Increased Focus on Blended and Bio-Based Gas Oils:
Refiners are exploring bio-based and blended gas oils to meet sustainability goals without compromising performance. These alternatives reduce the carbon footprint and align with international climate targets. Adoption is growing in regions with strong environmental policies, creating a niche segment within the broader gas oil market.
Market Challenges Analysis:
Regulatory Pressures and Compliance Costs:
The Global Gas Oil Market faces increasing regulatory scrutiny, with emission limits and fuel quality standards tightening worldwide. Compliance with low-sulfur mandates requires substantial capital investment in refining upgrades, which can strain smaller operators. Meeting evolving environmental standards while maintaining cost competitiveness is a major challenge for industry players.
Volatility in Crude Oil Prices and Supply Risks:
Gas oil pricing is closely linked to crude oil markets, making it vulnerable to fluctuations caused by geopolitical tensions, supply disruptions, and OPEC+ production decisions. Sudden price spikes can affect transportation and industrial sectors dependent on gas oil. Additionally, supply chain disruptions—whether due to conflicts, natural disasters, or logistical constraints—pose risks to consistent availability in certain markets.
Market Opportunities:
Emerging Markets with Growing Energy Needs:
The Global Gas Oil Market can tap into high-growth potential in regions with rising industrialization and limited alternative energy infrastructure. Countries in Southeast Asia, Sub-Saharan Africa, and Latin America are expanding their reliance on gas oil for transportation, manufacturing, and power generation, creating strong market entry and expansion prospects.
Innovation in Refining for Sustainable Fuel Production:
Investments in cleaner refining technologies and alternative fuel integration present opportunities to capture environmentally conscious markets. Companies that develop cost-effective low-emission fuel solutions can gain a competitive edge, particularly in regions where sustainability regulations are accelerating.
Market Segmentation Analysis:
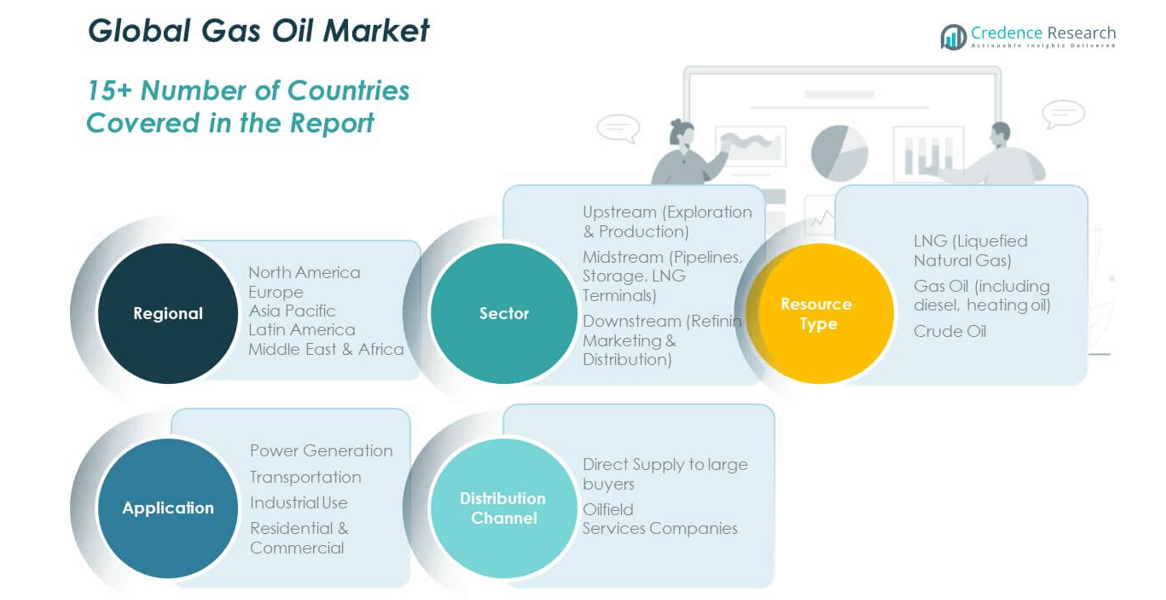
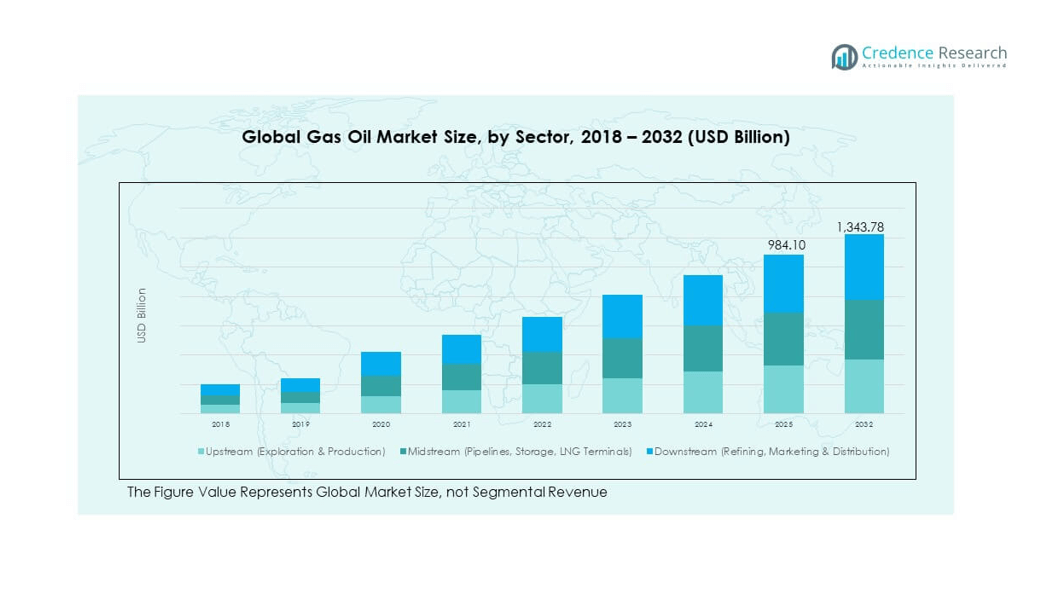
By Sector
The Global Gas Oil Market is divided into upstream, midstream, and downstream operations. The upstream segment focuses on exploration and production, supplying crude feedstock essential for further processing. The midstream segment manages pipelines, storage facilities, and LNG terminals, ensuring efficient transportation and storage before refining. The downstream segment, which includes refining, marketing, and distribution, captures the highest value addition in the supply chain and serves as the primary link to end-user markets.
- For instance, Saudi Aramco’s upstream segment achieved record crude oil production of 13.4 million barrels per day in 2025, supplying feedstock for both domestic and international midstream pipeline operators, such as the Trans-Arabian Pipeline. In the midstream, Qatar expanded its LNG export fleet to 128 vessels, reflecting the sector’s growing importance.
By Resource Type
The market comprises LNG, gas oil, and crude oil. LNG is gaining market share due to its cleaner combustion properties and suitability for emission-conscious markets. Gas oil, including diesel and heating oil, remains the most widely consumed product, particularly in transportation and heating applications. Crude oil continues to serve as the primary feedstock for refining, forming the backbone of the industry’s production cycle.
- For instance, in 2024, global LNG demand grew strongly, especially in Asia-Pacific, where high temperatures led to increased electricity and cooling requirements—India’s natural gas demand grew by 10% and LNG imports surged accordingly. Despite LNG growth, gas oil (including diesel and heating oil) remained the top consumed fuel in global transportation, with diesel-powered commercial vehicles accounting for the majority of freight movement.
By Application
Gas oil finds applications in power generation, transportation, industrial operations, and residential and commercial sectors. Transportation is the leading application segment, driven by freight, shipping, and passenger mobility. Industrial use and power generation maintain consistent baseline demand, while the residential and commercial sectors rely on gas oil for heating and backup energy solutions.
By Distribution Channel
Distribution is split between direct supply to large buyers and oilfield services companies. Direct supply channels cater to utilities, transport fleets, and industrial operators that require bulk quantities on a regular basis. Oilfield services companies manage specialized deliveries to support drilling, maintenance, and production operations within the energy sector. This segmentation framework reflects the market’s extensive integration from resource extraction to end-user consumption.
Segmentation:
By Sector:
- Upstream (Exploration & Production)
- Midstream (Pipelines, Storage, LNG Terminals)
- Downstream (Refining, Marketing & Distribution)
By Resource Type:
- LNG (Liquefied Natural Gas)
- Gas Oil (Including Diesel, Heating Oil)
- Crude Oil
By Application:
- Power Generation
- Transportation
- Industrial Use
- Residential & Commercial
By Distribution Channel:
- Direct Supply to Large Buyers
- Oilfield Services Companies
Regional Analysis:
North America
The North America Global Gas Oil Market size was valued at USD 183.52 billion in 2018 to USD 257.47 billion in 2024 and is anticipated to reach USD 378.81 billion by 2032, at a CAGR of 4.6% during the forecast period. Holding approximately 28.08% of the 2024 global market share, North America maintains strong demand driven by a combination of industrial activity, large-scale transportation fleets, and extensive maritime trade. The United States accounts for the bulk of regional consumption, supported by its advanced logistics sector and reliance on diesel for freight movement. Canada’s demand is influenced by industrial and mining operations, while Mexico’s market benefits from growing manufacturing and trade with the U.S. Refining infrastructure in the region is among the most advanced globally, enabling production of low-sulfur and compliant marine gas oil. Regulatory measures such as the EPA’s emission standards are pushing refiners to adopt cleaner technologies. Domestic production capacity ensures a high level of energy security, while cross-border energy trade strengthens market stability. Continued investment in transport infrastructure and industrial growth will sustain demand over the forecast period.
Europe
The Europe Global Gas Oil Market size was valued at USD 48.98 billion in 2018 to USD 60.44 billion in 2024 and is anticipated to reach USD 67.05 billion by 2032, at a CAGR of 0.9%. Representing around 6.59% of the 2024 global market share, Europe’s consumption is shaped by transportation, manufacturing, and residential heating demand. Countries like Germany, France, and the UK lead regional usage due to their industrial output and logistical networks. However, stringent environmental policies under the EU’s Green Deal are driving a transition toward cleaner fuels and electrification in transport. The heating oil segment remains important in northern and eastern Europe, although it faces gradual decline as alternative energy sources gain ground. Refinery modernization and the use of bio-blended diesel are helping meet tightening emissions standards. Europe’s reliance on imports for crude feedstock can make pricing vulnerable to global supply disruptions. Still, the region’s mature infrastructure and established regulatory framework ensure market stability despite slow growth rates.
Asia-Pacific
The Asia-Pacific Global Gas Oil Market size was valued at USD 280.74 billion in 2018 to USD 415.04 billion in 2024 and is anticipated to reach USD 645.18 billion by 2032, at a CAGR of 5.3%. With 45.27% of the 2024 market share, Asia-Pacific is the largest regional market, driven by rapid industrialization, urbanization, and transportation growth. China and India dominate demand due to their massive populations, expanding logistics sectors, and high industrial activity. Japan, South Korea, and Southeast Asia contribute significantly through maritime trade and advanced manufacturing industries. The region is also investing heavily in refining capacity, with countries like China and India enhancing domestic output to reduce reliance on imports. Gas oil use spans freight transportation, construction, agriculture, and power generation, making it indispensable across multiple sectors. Environmental regulations are gradually tightening, prompting refiners to produce low-sulfur variants. The sheer scale of infrastructure development and economic growth in the region ensures that demand will remain strong for the foreseeable future.
Latin America
The Latin America Global Gas Oil Market size was valued at USD 27.96 billion in 2018 to USD 39.32 billion in 2024 and is anticipated to reach USD 50.40 billion by 2032, at a CAGR of 2.8%. Accounting for 4.29% of the 2024 market share, demand in Latin America is led by Brazil, Argentina, and Mexico. The transportation sector, particularly trucking and maritime operations, consumes the largest share of gas oil in the region. Industrial applications, especially in mining and agriculture, also contribute significantly. Economic reforms and infrastructure development projects are increasing energy consumption, though growth remains moderate compared to Asia-Pacific. Refining capacity varies widely, with some countries relying heavily on imports to meet domestic needs. The adoption of low-sulfur fuels is growing, spurred by environmental regulations in larger economies like Brazil. Cross-border trade in refined products is expanding, supported by improvements in port and pipeline infrastructure. While political and economic instability in some countries can pose risks, the overall demand outlook remains positive.
Middle East
The Middle East Global Gas Oil Market size was valued at USD 69.06 billion in 2018 to USD 96.26 billion in 2024 and is anticipated to reach USD 135.64 billion by 2032, at a CAGR of 4.0%. Representing 10.49% of the 2024 global market share, the Middle East benefits from significant refining capacity and a strong position as a global exporter of refined products. Domestic consumption is driven by transportation, oilfield services, and power generation, particularly in GCC countries. Energy subsidies in some markets continue to support consumption levels. The region’s strategic location enables it to serve both Asian and European markets efficiently. Investments in new refining projects, especially in Saudi Arabia and the UAE, are aimed at producing more compliant and low-sulfur fuels. Geopolitical factors can influence export patterns, but robust infrastructure and production capabilities ensure resilience. Maritime fuel demand is also substantial due to the region’s role as a global shipping hub.
Africa
The Africa Global Gas Oil Market size was valued at USD 33.13 billion in 2018 to USD 48.72 billion in 2024 and is anticipated to reach USD 66.70 billion by 2032, at a CAGR of 3.7%. Holding 5.31% of the 2024 global market share, Africa’s growth is driven by industrial expansion, urbanization, and infrastructure development. South Africa, Nigeria, and Egypt are the largest consumers, with demand centered on transportation, mining, and power generation. Many countries rely heavily on imports due to limited refining capacity, which can make supply and pricing volatile. The adoption of low-sulfur fuels is increasing slowly, influenced by international trade requirements. Investments in port facilities and energy infrastructure are expected to improve supply chain efficiency. Gas oil remains essential for rural electrification and backup power generation in regions lacking stable grid access. Political instability and economic challenges in certain markets may limit growth, but demand fundamentals remain strong due to ongoing industrial activity.
Shape Your Report to Specific Countries or Regions & Enjoy 30% Off!
Key Player Analysis:
- ExxonMobil
- Shell
- LUKOIL
- BP
- Chevron
- TotalEnergies
- Valero
- Reliance Industries
- Indian Oil Corporation
- Sinopec
Competitive Analysis:
The Global Gas Oil Market is characterized by a mix of multinational oil majors and regional players, each leveraging refining capacity, distribution networks, and strategic alliances to maintain competitiveness. Companies like ExxonMobil, Shell, BP, Chevron, and TotalEnergies dominate production and global trade, while national oil companies such as Indian Oil Corporation, Reliance Industries, and Sinopec serve large domestic markets. Innovation in refining processes, compliance with low-sulfur regulations, and expansion into emerging markets are central strategies.
Recent Developments:
- In August 2025, ExxonMobil announced strong second-quarter earnings of $7.1 billion, supported by robust upstream production and efficient operations. The company continues its focus on expanding oil and gas exploration, including plans to nearly double output from the Guyana Stabroek block to 1.3 million barrels per day by 2027. ExxonMobil also maintains a significant presence in the Permian Basin, with expected production growth to 2 million barrels of oil equivalent per day by 2027.
- In mid-2025, Shell is reported to be in early discussions considering a potential acquisition of BP, aiming to consolidate and strengthen its position as the world’s largest oil producer. Shell’s interest lies in expanding its low-sulfur fuel oil and LNG assets. Meanwhile, Shell’s Pulau Bukom refinery in Singapore has scaled up its very low sulfur fuel oil (VLSFO) production to 2 million metric tons annually, addressing global demand under IMO 2020 emission regulations.
- In 2025, BP reported a strategic shift, increasing investment in oil and gas exploration with plans to drill 40 new exploration wells over three years. BP made its largest oil discovery in 25 years offshore Brazil and is focusing on expanding its fossil fuel production amidst a broader market consolidation wave. The company is also a potential acquisition target with ongoing talks involving Shell.
- In 2025, BP reported a strategic shift, increasing investment in oil and gas exploration with plans to drill 40 new exploration wells over three years. BP made its largest oil discovery in 25 years offshore Brazil and is focusing on expanding its fossil fuel production amidst a broader market consolidation wave. The company is also a potential acquisition target with ongoing talks involving Shell.
Market Concentration & Characteristics:
The Global Gas Oil Market is moderately concentrated, with a few integrated energy companies holding substantial global shares. Long-term supply contracts, advanced refining capabilities, and established distribution systems create high entry barriers. Market growth is cyclical and closely tied to global economic performance and crude oil price movements. Regulatory compliance and environmental standards are shaping the product mix, pushing refiners toward sustainable and low-emission alternatives.
Report Coverage:
The research report offers an in-depth analysis based on the market’s key segments, including sector, resource type, application, and distribution channel. It details leading market players, providing an overview of their business, product offerings, investments, revenue streams, and key applications. Additionally, the report includes insights into the competitive environment, SWOT analysis, current market trends, as well as the primary drivers and constraints. Furthermore, it discusses various factors that have driven market expansion in recent years. The report also explores market dynamics, regulatory scenarios, and technological advancements that are shaping the industry. It assesses the impact of external factors and global economic changes on market growth. Lastly, it provides strategic recommendations for new entrants and established companies to navigate the complexities of the market.
Future Outlook:
- Continued dominance of Asia-Pacific due to industrial growth and infrastructure expansion.
- Increasing maritime fuel demand driven by global trade and IMO 2020 compliance.
- Accelerated shift toward low-sulfur and cleaner fuel variants.
- Greater integration of digital monitoring and automation in refining and logistics.
- Expansion of refining capacity in emerging economies to reduce import reliance.
- Rising adoption of bio-based and blended gas oils in markets with strong environmental regulations.
- Strategic cross-border trade agreements enhancing supply chain resilience.
- Steady demand from industrial and power generation sectors in developing regions.
- Advanced refinery upgrades to improve efficiency and reduce emissions.
- Long-term market stability supported by diversified applications across sectors.


