| REPORT ATTRIBUTE |
DETAILS |
| Historical Period |
2020-2023 |
| Base Year |
2024 |
| Forecast Period |
2025-2032 |
| Optical Satellite Communication Market Size 2024 |
USD 472.85 million |
| Optical Satellite Communication Market, CAGR |
28.58% |
| Optical Satellite Communication Market Size 2032 |
USD 3,516.01 million |
Market Overview
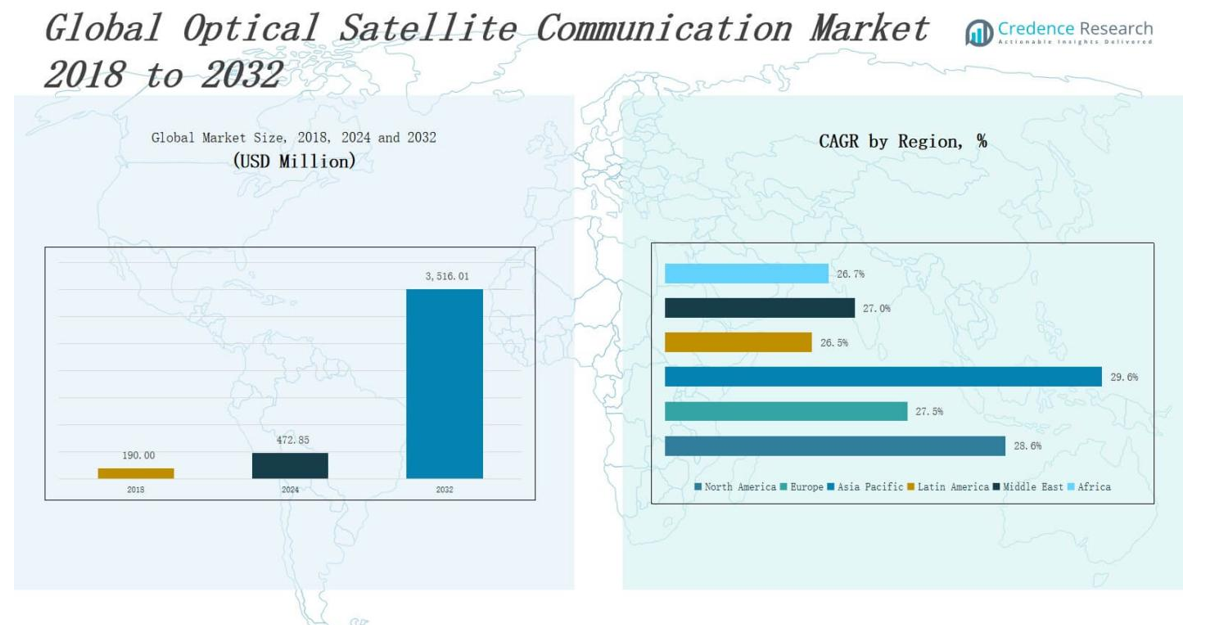
The Optical Satellite Communication Market size was valued at USD 190.00 million in 2018 to USD 472.85 million in 2024 and is anticipated to reach USD 3,516.01 million by 2032, at a CAGR of 28.58% during the forecast period.
The Optical Satellite Communication Market is gaining traction due to the rising demand for high-throughput and secure communication systems across defense, aerospace, and commercial sectors. As conventional radio frequency (RF) systems face spectrum congestion, optical solutions offer significantly higher bandwidth, enhanced data transfer rates, and immunity to electromagnetic interference. Increasing satellite deployments for Earth observation, navigation, and broadband internet services are accelerating the adoption of laser-based communication technologies. The market also benefits from advancements in photonics, deep space communication, and miniaturized optical terminals. Governments and space agencies are investing in secure, low-latency satellite links for real-time intelligence and disaster management applications. Moreover, the surge in satellite constellations by private space companies is boosting the need for inter-satellite optical links to ensure efficient data relay. Trends such as hybrid RF-optical systems, adaptive optics, and quantum key distribution are reshaping the landscape, driving innovation and opening new avenues for secure, high-speed communication in both terrestrial and extraterrestrial environments.
The Optical Satellite Communication Market demonstrates significant geographical diversity, with strong growth across North America, Europe, Asia Pacific, Latin America, Middle East, and Africa. Asia Pacific leads in projected market size, driven by rapid advancements in China, Japan, and India. North America dominates current share, supported by U.S. defense investments and commercial satellite expansion. Europe remains a hub for innovation with ESA-backed programs, while the Middle East and Latin America are emerging markets prioritizing strategic and rural connectivity. Africa shows early-stage adoption focused on bridging infrastructure gaps. Key players in the market include ATLAS Space Operations, Mynaric AG, Maxar Technologies, BridgeSat Inc., Laser Light Communications Inc., Mitsubishi Electric Corporation, Hisdesat Servicios Estrategicos, and Analytical Space Inc., each advancing optical technologies to enhance satellite-based communication networks globally. Competitive strategies focus on partnerships, miniaturization, and secure high-throughput systems.
Market Insights
- The Optical Satellite Communication Market was valued at USD 190.00 million in 2018, reached USD 472.85 million in 2024, and is projected to hit USD 3,516.01 million by 2032, growing at a CAGR of 28.58%.
- Demand is rising for high-throughput, secure communication systems in defense, aerospace, and commercial sectors, with optical links offering superior data rates and resistance to interference.
- Satellite constellations by firms like SpaceX and OneWeb are driving the need for inter-satellite optical links to enable efficient, low-latency data relay.
- Technological advancements in photonics, beam steering, and compact optical terminals are accelerating adoption and supporting small satellite integration.
- North America leads in current share due to U.S. defense investments, while Asia Pacific is projected to dominate by 2032 with major contributions from China, Japan, and India.
- Key challenges include high deployment costs and signal degradation due to atmospheric conditions, requiring advanced tracking and adaptive optics solutions.
- Leading companies such as ATLAS Space Operations, Mynaric AG, Maxar Technologies, Mitsubishi Electric, and BridgeSat are focusing on innovation, secure data transmission, and global market expansion.
Access crucial information at unmatched prices!
Request your sample report today & start making informed decisions powered by Credence Research Inc.!
Download Sample
Market Drivers
Rising Demand for High-Speed and Secure Communication
The Optical Satellite Communication Market is driven by the growing need for high-speed data transfer and secure communication networks. Traditional RF systems are increasingly unable to meet rising data demands due to limited bandwidth and susceptibility to interference. Optical communication provides significantly higher data rates and better resistance to interception. Governments and defense agencies are prioritizing secure communication technologies for surveillance, intelligence, and critical missions. The need for real-time connectivity in remote and hostile environments further strengthens adoption. Optical links enable efficient communication over long distances without compromising security or data integrity.
- For instance, Axelspace Corporation in Japan was selected by NEDO in March 2023 to develop and demonstrate an optical inter-satellite communication network, advancing secure and efficient data transmission for space-based applications.
Increasing Satellite Constellations and Inter-Satellite Connectivity
The proliferation of satellite constellations for global broadband and Earth observation services is a key factor fueling the Optical Satellite Communication Market. Companies like SpaceX, Amazon, and OneWeb are deploying thousands of satellites, creating a strong need for reliable inter-satellite links. Optical technology supports faster and more efficient data transfer between satellites, eliminating the need to downlink to Earth for routing. This approach reduces latency and improves bandwidth utilization. Inter-satellite optical links help ensure continuous communication, supporting both commercial and governmental applications. Growing satellite traffic is pushing operators to adopt scalable and interference-free communication systems.
- For instance, SpaceX has launched over 8,000 Starlink satellites since 2019, with more than 7,000 still in orbit, relying on optical inter-satellite links to enable high-speed, low-latency data transfer across its network.
Advancements in Photonics and Optical Terminal Miniaturization
Technological progress in photonics, laser systems, and compact optical terminals is expanding opportunities in the Optical Satellite Communication Market. Innovations in lightweight components and energy-efficient designs allow for integration into small and medium satellites. These advances help reduce launch costs and improve payload efficiency. Manufacturers are developing rugged optical terminals capable of withstanding harsh space environments. The integration of adaptive optics and beam steering technologies enhances performance in dynamic orbital conditions. It enables satellites to maintain stable, high-speed communication even during high-mobility scenarios. These innovations are making optical systems viable for broader deployment.
Growing Investments in Space-Based Communication Infrastructure
Increasing investment from public and private sectors in space communication infrastructure is driving the Optical Satellite Communication Market. Governments worldwide are funding space programs aimed at enhancing strategic communication capabilities. Private firms are launching ventures to commercialize high-speed satellite internet and secure communication platforms. These investments support research in advanced laser communication, quantum encryption, and spaceborne data networks. The market is also witnessing collaborations among aerospace companies, telecom providers, and research institutions. Strategic funding enables the development of standardized, scalable optical communication systems. It strengthens market readiness for next-generation space communication services.
Market Trends
Emergence of Hybrid RF-Optical Communication Systems
The integration of optical and radio frequency (RF) systems is a growing trend in the Optical Satellite Communication Market. Hybrid systems provide flexibility by leveraging the strengths of both technologies—optical for high-speed transmission and RF for reliability under adverse conditions. This dual-mode approach ensures continuous connectivity during signal blockages or atmospheric disturbances. Governments and commercial operators are adopting hybrid models for mission-critical communications. It allows seamless transition between RF and optical links without disrupting operations. This trend is pushing satellite design and ground infrastructure toward dual-band capabilities.
- For instance, LEO Sat’s constellation employs hybrid architecture, using optical technologies for inter-satellite links and Ka-band RF for space-to-ground communication, ensuring robust connectivity even during atmospheric disturbances.
Development of Inter-Satellite Optical Links (ISLs)
A key trend reshaping the Optical Satellite Communication Market is the rise of inter-satellite optical links (ISLs). ISLs enable direct data exchange between satellites, eliminating dependence on ground stations for routing. This configuration reduces latency and increases network efficiency, especially for large constellations. Private companies and space agencies are integrating ISLs into their next-generation satellite networks. It supports real-time global coverage and improves data throughput across orbits. Growing reliance on decentralized satellite networks continues to elevate demand for optical interconnectivity in space.
- For instance, the European Space Agency’s SILEX system achieved the world’s first civilian laser communication between satellites in 2001, transmitting images from the French SPOT-4 satellite in low Earth orbit to the ARTEMIS satellite in geostationary orbit using a laser diode wavelength of 800–850 nm.
Adoption of Quantum Communication Technologies
Quantum communication is gaining ground as a futuristic trend within the Optical Satellite Communication Market. It offers unmatched security by leveraging quantum key distribution (QKD) to detect eavesdropping and ensure encrypted data transfer. Governments and defense sectors are investing in quantum-enabled satellites to future-proof national communication infrastructure. China, the EU, and the U.S. have initiated pilot projects and launched quantum-capable satellites. This trend reflects increasing focus on information security in geopolitical and commercial contexts. Quantum communication systems represent a strategic frontier in optical space technology.
Advancements in Compact and Energy-Efficient Terminals
The trend toward miniaturized, power-efficient optical terminals is influencing the Optical Satellite Communication Market. Manufacturers are designing lightweight terminals that meet the demands of small satellite platforms. This enables optical systems to be deployed in low Earth orbit (LEO) constellations where space and power are limited. Energy-efficient components reduce operational costs and improve mission longevity. It allows broader deployment across both commercial and research missions. Compact terminals are critical to expanding market accessibility and promoting scalable optical networks.
Market Challenges Analysis
Atmospheric Interference and Line-of-Sight Limitations
One of the primary challenges in the Optical Satellite Communication Market is its vulnerability to atmospheric conditions. Cloud cover, fog, rain, and dust can significantly degrade the performance of optical signals, especially during ground-to-satellite communication. Unlike RF systems, optical links require a clear line of sight, which restricts flexibility and limits usage in certain weather and geographic conditions. This creates reliability concerns for continuous data transmission. To overcome these obstacles, developers must invest in adaptive optics, tracking systems, and site diversity solutions. These additions increase system complexity and deployment costs, affecting scalability.
High Cost and Complexity of Deployment
The high initial investment and technological sophistication required for optical communication systems present another critical barrier in the Optical Satellite Communication Market. Laser terminals, precision alignment mechanisms, and advanced pointing and acquisition systems involve high development and maintenance costs. Small satellite operators may find these solutions financially unfeasible without external funding or partnerships. It also takes considerable time and expertise to test, validate, and integrate these systems into operational networks. Standardization across vendors and platforms remains limited, further complicating widespread adoption. Addressing these challenges is essential for expanding market accessibility and achieving long-term operational efficiency.
Market Opportunities
Expansion of Global Broadband and Internet Connectivity
The growing push for global broadband access presents a strong opportunity for the Optical Satellite Communication Market. Governments and private companies are investing in satellite-based internet services to reach underserved and remote regions. Optical communication supports high-capacity data transfer, making it well-suited for backhaul and trunk-line connectivity in broadband networks. It enables low-latency performance essential for real-time applications such as video conferencing and IoT. As satellite constellations increase, the need for efficient, scalable, and secure communication links becomes critical. Optical systems meet these demands with minimal spectrum usage and high-speed throughput.
Integration with Emerging Defense and Space Missions
Rising interest in next-generation defense systems and deep space missions is creating new avenues in the Optical Satellite Communication Market. Defense agencies seek secure, jam-resistant, and high-bandwidth communication for surveillance, reconnaissance, and tactical operations. Optical links offer encryption-friendly transmission and resistance to electromagnetic interference, making them ideal for strategic applications. Space exploration programs also demand high-data-rate communication to support interplanetary missions and scientific data transmission. This growing demand drives innovation in long-range optical systems and enhances their viability for broader space and military deployments. These mission-critical applications provide long-term market growth potential.
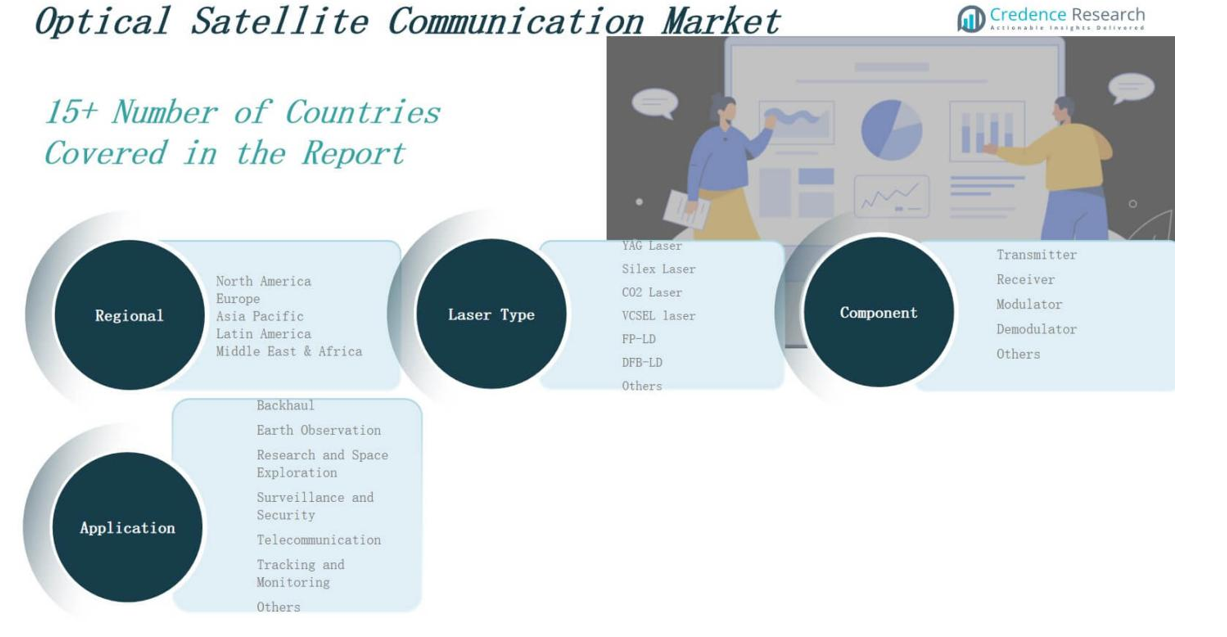
Market Segmentation Analysis:
By Laser Type
The Optical Satellite Communication Market is segmented by laser type into YAG Laser, Silex Laser, CO2 Laser, VCSEL Laser, FP-LD, DFB-LD, and Others. DFB-LD and FP-LD lasers are gaining strong traction due to their compact size, high modulation speeds, and efficiency in long-range space communications. YAG and CO2 lasers are used in high-power applications, particularly where beam quality and material interaction are crucial. VCSEL lasers are emerging for short-range and power-sensitive applications, particularly in small satellite systems. The diversity in laser technology supports a wide range of communication scenarios from ground-to-satellite to inter-satellite links.
- For instance, CO2 lasers are commonly deployed in industrial material processing where their high power and precise beam quality are essential for cutting and welding operations.
By Component
By component, the Optical Satellite Communication Market includes Transmitter, Receiver, Modulator, Demodulator, and Others. Transmitters and receivers form the core of any optical communication setup and hold a dominant share due to their essential role in signal generation and detection. Modulators and demodulators are witnessing growth with increasing demand for advanced data encoding and decoding to enhance link quality and efficiency. The shift toward miniaturized and integrated optical components is shaping the component landscape and supporting new satellite designs.
- For instance, SpaceX’s Starlink satellites are equipped with advanced optical inter-satellite links (OISLs) that use laser communication terminals to connect satellites in orbit, enabling high-speed, low-latency global internet coverage and supporting real-time data transfer between spacecraft.
By Application
By application, the Optical Satellite Communication Market covers Backhaul, Earth Observation, Research and Space Exploration, Surveillance and Security, Telecommunication, Tracking and Monitoring, and Others. Telecommunication and surveillance represent key revenue contributors due to the need for secure, high-speed communication networks. Earth observation and space research applications are growing steadily with the launch of advanced observational satellites and interplanetary missions. Backhaul and tracking applications benefit from low latency and high data throughput, driving consistent adoption across commercial and government sectors.
Segments:
Based on Laser Type
- YAG Laser
- Silex Laser
- CO2 Laser
- VCSEL Laser
- FP-LD
- DFB-LD
- Others
Based on Component
- Transmitter
- Receiver
- Modulator
- Demodulator
- Others
Based on Application
- Backhaul
- Earth Observation
- Research and Space Exploration
- Surveillance and Security
- Telecommunication
- Tracking and Monitoring
- Others
Based on Region
- North America
- Europe
- Germany
- France
- U.K.
- Italy
- Spain
- Rest of Europe
- Asia Pacific
- China
- Japan
- India
- South Korea
- South-east Asia
- Rest of Asia Pacific
- Latin America
- Brazil
- Argentina
- Rest of Latin America
- Middle East & Africa
- GCC Countries
- South Africa
- Rest of the Middle East and Africa
Regional Analysis
North America
The North America Optical Satellite Communication Market size was valued at USD 50.35 million in 2018 to USD 123.22 million in 2024 and is anticipated to reach USD 914.52 million by 2032, at a CAGR of 28.6% during the forecast period. North America holds the leading position in the Optical Satellite Communication Market, accounting for the highest market share in 2024. It benefits from strong investments by government agencies like NASA and the Department of Defense in secure, high-speed satellite communications. The presence of major aerospace and defense contractors, as well as private space firms, contributes to regional dominance. The U.S. leads in technological innovation, supporting early adoption of laser-based inter-satellite links. Increasing deployment of satellite constellations for military and commercial use accelerates growth. Strategic partnerships and government funding continue to strengthen infrastructure and R&D in the region.
Europe
The Europe Optical Satellite Communication Market size was valued at USD 44.08 million in 2018 to USD 104.87 million in 2024 and is anticipated to reach USD 730.46 million by 2032, at a CAGR of 27.5% during the forecast period. Europe maintains a significant share in the Optical Satellite Communication Market with active contributions from the European Space Agency (ESA) and leading aerospace companies. Countries such as Germany, France, and the UK are advancing laser communication capabilities for defense and Earth observation missions. The region emphasizes research collaboration, satellite standardization, and secure data transmission. Innovation in small satellite platforms and laser payload integration supports adoption. Public-private partnerships are promoting space infrastructure development. Rising demand for encrypted communication and data relay services fuels continued market expansion.
Asia Pacific
The Asia Pacific Optical Satellite Communication Market size was valued at USD 74.04 million in 2018 to USD 189.40 million in 2024 and is anticipated to reach USD 1,501.34 million by 2032, at a CAGR of 29.6% during the forecast period. Asia Pacific holds the largest projected market size in the Optical Satellite Communication Market by 2032. China, Japan, and India are key contributors, investing heavily in space-based technologies and quantum communication research. National space programs are launching advanced satellite networks with integrated optical links. Growing need for broadband coverage in remote regions drives interest in satellite communication backhaul. Regional space agencies and private firms are scaling up infrastructure to support civilian and military operations. Rising competition and policy support enhance innovation and market penetration across Asia Pacific.
Latin America
The Latin America Optical Satellite Communication Market size was valued at USD 7.18 million in 2018 to USD 17.59 million in 2024 and is anticipated to reach USD 114.87 million by 2032, at a CAGR of 26.5% during the forecast period. Latin America shows emerging potential in the Optical Satellite Communication Market, supported by increasing government focus on communication coverage in remote areas. Countries such as Brazil and Argentina are expanding national satellite programs to address rural connectivity and disaster response. Interest in optical links is growing due to their ability to offer low-latency, high-throughput communication. The market is still in its early stages but shows steady demand in telecommunication and surveillance. International collaborations are opening doors to new technologies and applications. Regional satellite launches are expected to increase through the forecast period.
Middle East
The Middle East Optical Satellite Communication Market size was valued at USD 7.39 million in 2018 to USD 17.26 million in 2024 and is anticipated to reach USD 116.05 million by 2032, at a CAGR of 27.0% during the forecast period. The Middle East is gradually expanding its role in the Optical Satellite Communication Market, focusing on secure defense communication and commercial satellite services. Countries like the UAE and Saudi Arabia are investing in advanced space programs and forming alliances with international space agencies. Regional initiatives aim to build secure, encrypted satellite communication channels for national security and strategic data exchange. Private firms are also entering the sector with space technology ventures. Investment in space research and data infrastructure supports long-term market growth. Demand for resilient communication networks is rising across energy, defense, and telecom industries.
Africa
The Africa Optical Satellite Communication Market size was valued at USD 6.95 million in 2018 to USD 20.52 million in 2024 and is anticipated to reach USD 138.77 million by 2032, at a CAGR of 26.7% during the forecast period. Africa represents a developing region in the Optical Satellite Communication Market, driven by the need to improve connectivity and disaster response systems. Countries are exploring satellite-based communication solutions to bridge infrastructure gaps in remote and rural areas. Government-led initiatives, supported by international agencies, are supporting small-scale satellite deployments. Adoption of optical systems remains limited but is gaining traction for Earth observation and environmental monitoring. Interest in low-cost, high-throughput solutions is fueling experimental projects and pilot programs. Progress depends on investment, policy support, and regional collaboration.
Shape Your Report to Specific Countries or Regions & Enjoy 30% Off!
Key Player Analysis
- ATLAS Space Operations, Inc.
- Analytical Space Inc.
- Hisdesat Servicios Estrategicos S.A.
- BridgeSat Inc.
- Mitsubishi Electric Corporation
- Maxar Technologies Ltd.
- SITAEL S.p.A
- Mynaric AG
- Laser Light Communications Inc.
Competitive Analysis
The Optical Satellite Communication Market is marked by intense competition among established aerospace firms, satellite operators, and emerging technology startups. Key players such as ATLAS Space Operations, Maxar Technologies, Mitsubishi Electric Corporation, and Mynaric AG are focusing on R&D, strategic partnerships, and government contracts to strengthen their market positions. It is witnessing growing participation from private space companies investing in inter-satellite laser communication systems and high-throughput data links. Companies are prioritizing miniaturized and energy-efficient terminals to meet the demand from small satellite constellations. Innovation in beam steering, optical modulation, and quantum encryption is shaping product differentiation. Firms that can offer scalable, secure, and high-speed solutions while meeting orbital environment constraints are gaining a competitive edge. The market favors players with advanced photonics capabilities and proven space deployment experience, especially in defense, Earth observation, and telecom applications. Competitive intensity is expected to rise with global expansion of satellite broadband networks.
Recent Developments
- In November 2024, Sony Space Communications Corporation (SSCC) partnered with Astro Digital US, Inc. to launch two microsatellites featuring SSCC’s optical terminals, aiming to demonstrate high-speed laser communication links between satellites and ground stations.
- In October 2024, the Japan Aerospace Exploration Agency (JAXA) and NEC Corporation successfully demonstrated optical inter-satellite communication using the Optical Data Relay Satellite and the “DAICHI-4” satellite, showcasing the use of laser-based transmitters and receivers for rapid, high-volume data downlink from space.
- In December 2024, Airbus and CNES successfully demonstrated the TELEO system, a high-speed optical communication link achieving 10 Gbps data transfer from the Badr-8 GEO satellite to ground stations.
- In December 2023, Kepler Communications partnered with Axiom Space and Skyloom Global to advance inter-satellite optical links (OISLs), supporting Kepler’s development of a real-time optical relay satellite constellation.
Market Concentration & Characteristics
The Optical Satellite Communication Market exhibits a moderately concentrated structure, with a mix of established aerospace corporations and agile technology startups competing for market share. It is characterized by high entry barriers due to the complexity of laser communication systems, significant capital investment, and strict space qualification standards. Players with proven capabilities in photonics, miniaturization, and secure data transmission maintain a competitive edge. The market favors vertically integrated companies that can develop, test, and deploy end-to-end optical communication solutions. Long product development cycles and the need for specialized infrastructure limit the entry of new participants. Strategic collaborations between space agencies, private satellite operators, and technology vendors are shaping the pace of innovation. The market remains dynamic, with growing demand for scalable and secure communication networks fueling rapid technology development. Companies are focusing on differentiating through reliability, bandwidth efficiency, and interoperability across satellite platforms and constellations, reinforcing competition around performance and global coverage
Report Coverage
The research report offers an in-depth analysis based on Laser Type, Component, Application and Region. It details leading market players, providing an overview of their business, product offerings, investments, revenue streams, and key applications. Additionally, the report includes insights into the competitive environment, SWOT analysis, current market trends, as well as the primary drivers and constraints. Furthermore, it discusses various factors that have driven market expansion in recent years. The report also explores market dynamics, regulatory scenarios, and technological advancements that are shaping the industry. It assesses the impact of external factors and global economic changes on market growth. Lastly, it provides strategic recommendations for new entrants and established companies to navigate the complexities of the market.
Future Outlook
- Demand for high-speed, secure satellite communication will continue to grow across defense, commercial, and government sectors.
- Inter-satellite optical links will become standard in next-generation satellite constellations to enable faster and more efficient data relay.
- Miniaturized and energy-efficient optical terminals will see wider adoption in small satellite platforms and CubeSats
- Integration of quantum communication and encryption technologies will enhance data security in space-based networks.
- Hybrid RF-optical communication systems will gain traction for flexibility under varying environmental conditions.
- Public and private investments will accelerate development of deep space optical communication infrastructure.
- Advances in adaptive optics and beam tracking systems will improve reliability in dynamic and adverse atmospheric conditions.
- Regional markets such as Asia Pacific and Middle East will expand rapidly, driven by government initiatives and satellite deployment.
- Standardization efforts will improve system compatibility across global satellite networks and vendors.
- Strategic partnerships between satellite manufacturers, telecom providers, and technology firms will shape long-term market growth.


