
| REPORT ATTRIBUTE | DETAILS |
|---|---|
| Historical Period | 2019-2022 |
| Base Year | 2023 |
| Forecast Period | 2024-2032 |
| Platform as a Service (PaaS) Market Size 2024 | USD 69,835 million |
| Platform as a Service (PaaS) Market, CAGR | 14.20% |
| Platform as a Service (PaaS) Market Size 2032 | USD 202,022.08 million |
Market Overview
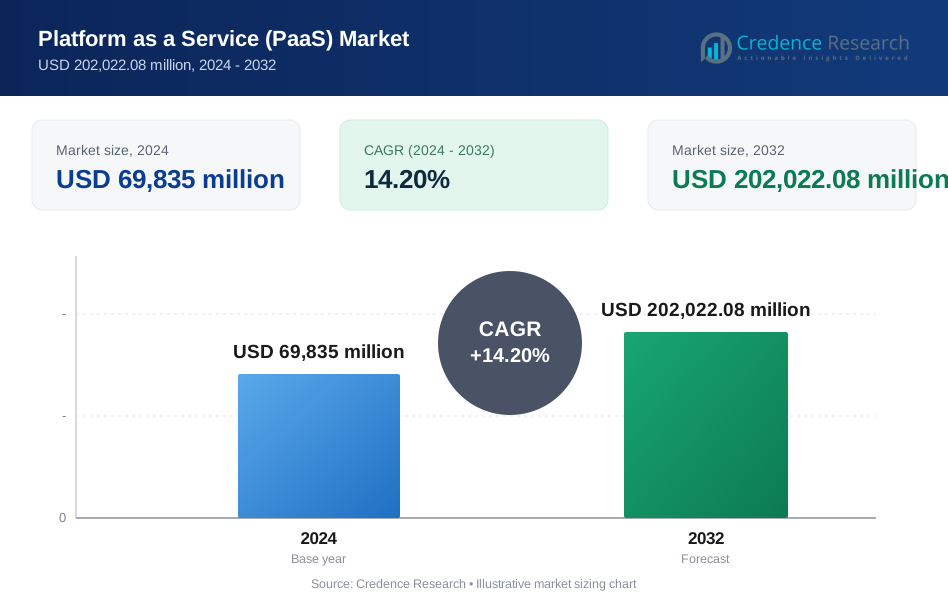
The Platform as a Service (PaaS) market is projected to grow significantly, expanding from USD 69,835 million in 2024 to USD 202,022.08 million by 2032, reflecting a robust compound annual growth rate (CAGR) of 14.20%.
The Platform as a Service (PaaS) market is driven by the increasing demand for scalable and cost-effective cloud solutions, enabling businesses to accelerate application development and deployment. The rise of DevOps practices fosters collaboration and efficiency, while the growing trend of digital transformation across industries further propels PaaS adoption. Additionally, the need for enhanced flexibility and integration of emerging technologies, such as artificial intelligence and machine learning, significantly influences market growth. Organizations increasingly leverage PaaS to streamline operations and reduce time-to-market, making it a crucial component in their digital strategies.
The Platform as a Service (PaaS) market is characterized by significant growth across various regions, particularly in North America and Europe. Key players like Salesforce, VMware, and CircleCI dominate the U.S. market, driving innovation and competitive offerings. Meanwhile, Platform.sh represents a strong presence in France, emphasizing localized solutions. Swiss company Plesk adds diversity to the European landscape, focusing on web hosting and application management. In addition, Jelastic and Zoho Corporation from India are emerging players, expanding their influence with cost-effective solutions tailored for regional businesses, further enhancing the global PaaS ecosystem.
Market Drivers
Cost Reduction and Efficiency
The Platform as a Service (PaaS) model significantly reduces infrastructure costs for organizations by eliminating the need for them to invest in and maintain their own hardware, software, and infrastructure. For instance, a survey by IBM indicated that businesses leveraging PaaS can reduce their operational costs substantially due to the elimination of capital expenditures associated with hardware and software maintenance. With a pay-as-you-go pricing structure, businesses can easily scale resources up or down based on demand, avoiding unnecessary expenses. Additionally, PaaS providers manage routine tasks such as patching, updating, and security, allowing IT teams to concentrate on core business objectives and enhancing overall operational efficiency.
Faster Time to Market
PaaS platforms accelerate application development and deployment through pre-configured development environments, tools, and services. For instance, a recent study found that organizations using PaaS reported a significant reduction in the time required to bring applications to market compared to traditional methods. This rapid setup facilitates faster delivery of applications, allowing organizations to respond quickly to market demands. By automating many underlying infrastructure tasks, PaaS also simplifies management, reducing the time and effort required to oversee applications. As a result, organizations can bring their products and services to market more swiftly, gaining a competitive advantage.
Enhanced Scalability and Flexibility
The elastic scaling capabilities of PaaS platforms ensure optimal performance and cost efficiency by automatically adjusting resources to meet fluctuating demand. This flexibility supports a diverse range of applications, from simple web solutions to complex enterprise systems. Organizations benefit from the ability to innovate and expand without being constrained by their infrastructure, allowing them to adapt to changing business environments seamlessly.
Improved Collaboration and Productivity
PaaS fosters enhanced collaboration and productivity by enabling teams to work together seamlessly on projects, regardless of their geographic location. With built-in tools for version control, continuous integration, and continuous delivery, the development process becomes more streamlined and efficient. This collaborative environment encourages innovation, allowing organizations to focus on developing cutting-edge products and services while maintaining high productivity levels.
Market Trends
Evolution of Development Paradigms
The PaaS landscape is witnessing a significant shift toward serverless computing, particularly through Function-as-a-Service (FaaS). This approach allows developers to write and deploy individual functions without the need to manage servers, resulting in enhanced scalability and cost efficiency. For instance, a recent survey indicated that a substantial percentage of developers are adopting serverless architectures to streamline their workflows and reduce operational overhead, reflecting a growing trend towards more efficient development practices. Additionally, PaaS platforms increasingly support event-driven architectures, enabling applications to respond dynamically to real-time events and data changes. Coupled with the rise of low-code and no-code platforms, application development is becoming more accessible to a broader audience, including citizen developers and business analysts. These tools streamline the development process, accelerating cycles and reducing reliance on traditional coding methods, thereby fostering innovation and agility within organizations.
Integration of Advanced Technologies
As PaaS continues to evolve, the integration of artificial intelligence (AI) and machine learning (ML) services is gaining momentum. PaaS providers are offering pre-built AI and ML functionalities, such as natural language processing, image recognition, and predictive analytics, which allow businesses to develop data-driven applications that make intelligent decisions and recommendations. Moreover, the expansion of edge computing is enhancing PaaS offerings by bringing computing resources closer to data sources, improving latency and responsiveness. This trend is especially pertinent for Internet of Things (IoT) applications, where real-time data processing and analysis are critical. Additionally, the adoption of hybrid and multi-cloud environments is providing organizations with greater flexibility and control over their deployment strategies. By supporting these environments, PaaS providers enable businesses to leverage a combination of on-premises and cloud solutions, enhancing choice and control over their infrastructure and data management.
Market Challenges Analysis
Challenges of Vendor Lock-In and Limited Customization
One significant challenge organizations face with Platform as a Service (PaaS) is vendor lock-in, which arises from a dependency on a single provider. For instance, a survey by the Cloud Industry Forum found that 70% of organizations reported concerns about being locked into a single cloud provider, highlighting the difficulty of switching vendors without incurring substantial costs or experiencing operational disruptions. This reliance can restrict flexibility and increase costs, making it difficult to adapt to changing business needs. Additionally, migrating to a different provider can be a complex and time-consuming process, often leading to potential disruptions and data loss. Furthermore, limited customization options within PaaS environments exacerbate this issue. Pre-configured settings may not fully meet specific organizational requirements, leaving companies to operate within constraints that do not align with their unique needs. This situation often results in reduced control over underlying infrastructure components compared to traditional on-premises solutions, complicating efforts to tailor services and features to optimize performance.
Security, Performance, and Skill Gaps
Security concerns also pose a significant challenge in the PaaS landscape, where a shared responsibility model requires organizations to take proactive measures in securing their applications and data. While PaaS providers implement robust security measures, companies must ensure compliance with data privacy regulations, particularly when handling sensitive information. Performance and scalability issues further complicate the adoption of PaaS. Network latency can affect applications, especially for those requiring low latency, while scalability limitations may restrict how quickly resources can be adjusted to meet demand. Additionally, organizations may face unexpected costs due to data transfer fees, storage usage, and additional services, making cost management an ongoing challenge that necessitates careful planning and monitoring of resource utilization. Finally, skill gaps can hinder effective PaaS utilization, as organizations may need to acquire specialized knowledge or invest in training and development to ensure their teams can leverage the full range of PaaS capabilities. Addressing these challenges is crucial for organizations aiming to maximize the benefits of PaaS while mitigating potential risks.
Market Segmentation Analysis:
By Type:
The Platform as a Service (PaaS) market is segmented by type, encompassing Application PaaS (aPaaS), Integration PaaS (iPaaS), Database PaaS (dbPaaS), and others. Application PaaS (aPaaS) serves as a robust environment for developers to create, deploy, and manage applications without the complexities of underlying infrastructure. This segment is gaining traction due to its ability to streamline development processes and enhance productivity. Integration PaaS (iPaaS) focuses on facilitating seamless integration of various applications and data sources, making it crucial for organizations aiming to achieve interoperability across diverse systems. Database PaaS (dbPaaS) offers managed database services, allowing businesses to scale and manage their databases with ease, which is vital for handling large volumes of data efficiently. The "Others" segment includes specialized PaaS solutions tailored to unique industry needs. Together, these segments reflect the diverse applications of PaaS, catering to a wide range of organizational requirements.
By Deployment:
PaaS is also segmented based on deployment models, primarily comprising public and private options. Public PaaS offers services over the internet, enabling organizations to leverage shared infrastructure and resources, resulting in cost savings and enhanced scalability. This model is particularly appealing for startups and small to medium-sized enterprises seeking flexibility without significant capital investments. Conversely, private PaaS solutions provide dedicated resources within a secure environment, making them ideal for larger organizations or those in regulated industries requiring stringent compliance measures. This deployment model allows for greater control over security and customization, ensuring that organizations can tailor their PaaS solutions to meet specific needs. By understanding these deployment options, businesses can make informed decisions that align with their strategic goals and operational requirements. Overall, the segmentation of PaaS by type and deployment highlights the market's adaptability to varying organizational needs and preferences.
Segments:
Based on the Type:
- Application PaaS (aPaaS)
- Integration PaaS (iPaaS)
- Database PaaS (dbPaaS)
- Others
Based on the Deployment:
- Public
- Private
Based on the Organization size:
- Large Enterprises
- SMEs
Based on the Vertical:
- BFSI
- Consumer goods and retail
- Telecommunication
- IT and ITeS
- Manufacturing
- Healthcare and life sciences
- Energy and utility
- Others
Based on the Geography:
- North America
- U.S.
- Canada
- Mexico
- Europe
- Germany
- France
- U.K.
- Italy
- Spain
- Rest of Europe
- Asia Pacific
- China
- Japan
- India
- South Korea
- South-east Asia
- Rest of Asia Pacific
- Latin America
- Brazil
- Argentina
- Rest of Latin America
- Middle East & Africa
- GCC Countries
- South Africa
- Rest of the Middle East and Africa
Regional Analysis
North America
North America holds a significant share of the Platform as a Service (PaaS) market, accounting for approximately 45%. This region benefits from a robust adoption of cloud services across various industries, including healthcare, finance, and retail. According to surveys conducted by government authorities and industry analysts, a considerable percentage of enterprises in North America have reported increased operational efficiency due to the adoption of PaaS solutions. The rapid pace of digital transformation, combined with a focus on innovation and efficiency, further propels the growth of PaaS in this region. Additionally, the increasing trend of DevOps practices among organizations has been shown to enhance collaboration and accelerate application development, positioning North America as a leader in PaaS adoption.
Asia-Pacific
In contrast, the Asia-Pacific region is witnessing rapid growth in the PaaS market, projected to reach a market share of around 30%. The expanding digital economy in countries like China, India, and Japan significantly contributes to this growth. With a large population of tech-savvy users and increasing investments in cloud technologies, organizations in the Asia-Pacific region are leveraging PaaS to enhance operational efficiency and drive innovation. The rise of startups and small to medium-sized enterprises (SMEs) further accelerates demand for flexible and cost-effective PaaS solutions. Additionally, government initiatives promoting digitalization and smart technologies in various sectors are creating a favorable environment for PaaS growth. As organizations in the Asia-Pacific region prioritize agility and scalability, the adoption of PaaS is expected to accelerate, contributing to its expanding market share.
Key Player Analysis
- Salesforce (US)
- VMware (US)
- Render (US)
- sh (France)
- CircleCI (US)
- Apprenda (US)
- Plesk (Switzerland)
- Microsoft (US)
- Jelastic (US)
- Zoho Corporation (India)
Competitive Analysis
The Platform as a Service (PaaS) market is competitive, with key players including Salesforce, VMware, Render, Platform.sh, CircleCI, Apprenda, Plesk, Microsoft, Jelastic, and Zoho Corporation. Salesforce leads with its CRM-focused solutions that integrate well with various applications, enhancing customer experiences. Many providers focus on integrating advanced technologies such as artificial intelligence and machine learning into their platforms, enabling businesses to leverage data analytics for improved decision-making. Additionally, a strong emphasis is placed on automation, particularly in continuous integration and delivery processes, allowing for quicker deployment and reduced time-to-market. Collaborative tools and user-friendly interfaces are becoming increasingly important, as they enable development teams to work seamlessly across various projects. Moreover, cost-effective solutions tailored for small and medium-sized enterprises are gaining traction, expanding accessibility and encouraging widespread adoption. As the market matures, companies are exploring strategic partnerships and acquisitions to enhance their capabilities, further intensifying competition and driving innovation within the PaaS landscape.
Recent Developments
- In February 2023, SANDSTORM, an Innovative Remote Network Monitoring and Smart Device Assurance Solution for Telcos and Businesses, was introduced by Tech Mahindra. Furthermore, SANDSTORM is a state-of-the-art technology that enables service providers to remotely monitor user experiences on any device, including connected cars, VR headsets, smart TVs, and tablets.
- In February 2023, by a partnership with esports start-up Gamerji, Vodafone Idea has increased its market shares in the mobile gaming industry and added Esports to its offering. Also, VI has introduced an Esports platform on the Vi App under the banner of Vi Games, which will offer well-known Esports games across numerous genres, such as Battle Royale, Racing, Cricket, Action Role Playing, etc., thanks to the cooperation.
Market Concentration & Characteristics
The Platform as a Service (PaaS) market exhibits a moderate level of concentration, with a mix of established players and emerging startups driving competition. Major providers dominate the landscape, leveraging their extensive resources and technological expertise to offer robust and scalable solutions. These key players focus on enhancing their platforms with advanced features, such as artificial intelligence, machine learning, and automation, to meet the evolving needs of businesses. The market is characterized by rapid innovation, as companies continuously enhance their service offerings to improve user experience and operational efficiency. Additionally, PaaS providers are increasingly emphasizing integration capabilities, allowing seamless interoperability with existing software and services. The growing demand for cloud-based solutions, driven by the need for flexibility and cost efficiency, is further fueling market growth. As more enterprises adopt digital transformation strategies, the PaaS market is poised for continued expansion, attracting new entrants and fostering a dynamic competitive environment.Top of Form
Report Coverage
The research report offers an in-depth analysis based on Type, Deployment, Organization size, Vertical and Geography. It details leading market players, providing an overview of their business, product offerings, investments, revenue streams, and key applications. Additionally, the report includes insights into the competitive environment, SWOT analysis, current market trends, as well as the primary drivers and constraints. Furthermore, it discusses various factors that have driven market expansion in recent years. The report also explores market dynamics, regulatory scenarios, and technological advancements that are shaping the industry. It assesses the impact of external factors and global economic changes on market growth. Lastly, it provides strategic recommendations for new entrants and established companies to navigate the complexities of the market.
Future Outlook
- The PaaS market is expected to experience robust growth as businesses increasingly adopt cloud-based solutions.
- Enhanced integration capabilities will drive demand, allowing seamless connectivity between applications and services.
- Artificial intelligence and machine learning features will become standard, enabling improved analytics and automation.
- The rise of low-code and no-code development platforms will empower non-technical users to create applications easily.
- Companies will prioritize security and compliance, leading to the development of more secure PaaS offerings.
- Multi-cloud strategies will gain traction as organizations seek to avoid vendor lock-in and improve resilience.
- The demand for real-time data processing and analytics will push PaaS providers to enhance their offerings.
- Enhanced collaboration tools will emerge, facilitating remote work and teamwork among development teams.
- PaaS will continue to evolve to support the Internet of Things (IoT), enabling developers to build IoT applications efficiently.
- Strategic partnerships and acquisitions will intensify, as companies seek to enhance their capabilities and market reach.
Request a Free Sample
Fill in your details and we'll send you a free sample report.
- Sample data tables & charts
- Research methodology
Need a Custom Version of This Report?
Tailor the scope, geography, or segments to your exact requirements.
- Custom geography or segment scope
- Direct access to our analyst team
Frequently Asked Questions
What is the current size of the Platform as a Service market?
What factors are driving the growth of the Platform as a Service?
What are the key segments within the Platform as a Service?
Who are the major players in the Platform as a Service?
Table of Content
Chapter 1. Report Introduction
- 1.1 Report Description & Purpose
- 1.1.1 Report Title & Market Definition
- 1.1.2 Unique Selling Propositions (USP) & Key Differentiators
- 1.1.3 Value Proposition for Stakeholders
- 1.2 Research Objectives
- 1.2.1 Market Sizing Objectives (Volume & Revenue) (Volume Where Applicable)
- 1.2.2 Segmentation Objectives
- 1.2.3 Competitive Intelligence Objectives
- 1.2.4 Forecast & Scenario Objectives
- 1.3 Report Scope
- 1.3.1 Platform as a Service (PaaS) Scope – Segments & Subsegments Covered
- 1.3.2 Geographic Scope – Regions & Countries Covered
- 1.3.3 Historical Period, Base Year & Forecast Period (2024; forecast to 2032)
- 1.3.4 Inclusions & Exclusions
- 1.4 Industry Classification & Applicable Codes
- 1.5 Currency, Measurement Units & Valuation Basis
- 1.6 Target Stakeholders
- 1.7 Limitations & Assumptions
Chapter 2. Executive Summary
- 2.1 Global Platform as a Service (PaaS) Market Snapshot
- 2.1.1 Market Size – Historical (2024) & Forecast (2024-2032) (2024: USD 69,835 million → 2032: USD 202,022.08 million)
- 2.1.2 Volume & Revenue – Global Totals (Volume Where Applicable)
- 2.1.3 Key Market Highlights – Top Five Facts
- 2.2 Platform as a Service (PaaS) Market Segmentation Snapshot
- 2.2.1 Market Split by Region – 2024 vs. 2032
- 2.3 Competitive Snapshot
- 2.3.1 Top 10 Players by Revenue Share – 2024
- 2.3.2 Top 10 Players by Volume Share – 2024 (Volume Where Applicable)
- 2.3.3 Recent Strategic Developments (18-Month Summary)
- 2.4 Key Investment Highlights & Strategic Conclusions
Chapter 3. Platform as a Service (PaaS) Market Dynamics & Industry Analysis
- 3.1 Market Overview & Context
- 3.1.1 Platform as a Service (PaaS) Market Position in the Broader Industry Value Chain
- 3.1.2 Demand Structure & Purchasing Dynamics
- 3.1.3 Market Maturity & Development Stage by Region
- 3.2 Platform as a Service (PaaS) Market Drivers
- 3.3 Platform as a Service (PaaS) Market Restraints & Challenges
- 3.4 Platform as a Service (PaaS) Market Opportunities
- 3.5 Porter's Five Forces Analysis
- 3.5.1 Threat of New Entrants
- 3.5.2 Bargaining Power of Suppliers
- 3.5.3 Bargaining Power of Buyers
- 3.5.4 Threat of Substitutes
- 3.5.5 Competitive Rivalry – Intensity Assessment
- 3.6 Platform as a Service (PaaS) Value Chain Analysis
- 3.6.1 Upstream – Key Inputs, Resources & Suppliers
- 3.6.1.1 Key Input/Resource 1
- 3.6.1.2 Key Input/Resource 2
- 3.6.1.3 Key Input/Resource 3
- 3.6.2 Midstream – Core Operations & Value Creation
- 3.6.2.1 Operating Model & Process Overview
- 3.6.2.2 Key Operating Locations & Capabilities by Company
- 3.6.3 Downstream – Market Channels & End Users
- 3.6.3.1 Direct Sales & Customer Engagement Channels
- 3.6.3.2 Indirect Sales, Intermediaries & Partner Channels
- 3.6.4 Value Chain Profitability Analysis
- 3.6.1 Upstream – Key Inputs, Resources & Suppliers
- 3.7 PESTEL Analysis
- 3.7.1 Political Factors
- 3.7.2 Economic Factors
- 3.7.3 Social Factors
- 3.7.4 Technological Factors
- 3.7.5 Environmental Factors
- 3.7.6 Legal Factors
- 3.8 Platform as a Service (PaaS) Supply Chain Analysis
- 3.8.1 Critical Input & Resource Availability Risk Assessment
- 3.8.2 Supplier & Operational Concentration Risk (Geographic Exposure)
- 3.8.3 Supply & Service Disruption Impact Analysis
- 3.9 Regulatory & Policy Landscape
Note: The regulatory and policy landscape section covers regulations based on their applicability to the market, Platform as a Service (PaaS) category, geography, and scope of the study. Only regulatory frameworks with a material impact on operations, compliance, trade, sustainability, or market access are analyzed in detail.
Chapter 4. Key Investment Pockets & Opportunity Analysis
- 4.1 Platform as a Service (PaaS) Market Attractiveness Analysis
- 4.1.1 By Region – Investment Attractiveness Matrix (Market Size × CAGR)
- 4.2 Absolute Revenue Growth Opportunity
- 4.2.1 By Region – Absolute Revenue Growth Through 2032
- 4.3 Incremental Demand Opportunity
- 4.3.1 By Region – Incremental Demand Through 2032
- 4.3.2 Segment – Incremental Demand
- 4.4 Emerging Submarket Opportunity Deep Dive (Subject to Applicability)
- 4.5 Priority Market Opportunity Scorecards
- 4.5.1 United States
- 4.5.2 Europe
- 4.5.3 Asia
- 4.5.4 Middle East & Africa
Note: Priority market opportunity scorecards reflect the geographic scope and strategic relevance of the study. Listed markets are indicative and may be adapted to the industry.
Chapter 5. Platform as a Service (PaaS) Cross-Border Trade & Market Access Analysis
- 5.1 International Trade & Cross-Border Activity Overview
- 5.1.1 Global Export Value by Country (2024)
- 5.1.2 Global Export Volume by Country (2024) (Volume Where Applicable)
- 5.1.3 Global Import Value by Country (2024)
- 5.1.4 Global Import Volume by Country (2024) (Volume Where Applicable)
- 5.1.5 Net Trade Balance by Country (2024)
- 5.2 Export Analysis – Segment
- 5.2.1 Category 1 (Applicable Classification Code)
- 5.2.2 Category 2 (Applicable Classification Code)
- 5.2.3 Category 3 (Applicable Classification Code)
- 5.2.4 Category 4 (Applicable Classification Code)
- 5.2.5 Category 5 (Applicable Classification Code)
- 5.3 Import Analysis – Segment
- 5.3.1 Category 1 (Applicable Classification Code)
- 5.3.2 Category 2 (Applicable Classification Code)
- 5.3.3 Category 3 (Applicable Classification Code)
- 5.3.4 Category 4 (Applicable Classification Code)
- 5.3.5 Category 5 (Applicable Classification Code)
- 5.4 Cross-Border Pricing & Transaction Benchmarks
- 5.4.1 Export Pricing – Segment & Country
- 5.4.2 Import Pricing – Segment & Source Country
- 5.4.3 Price Trends (2024)
- 5.5 Key Cross-Border Trade & Delivery Routes
- 5.5.1 Cross-Border Trade/Delivery Route 1
- 5.5.2 Cross-Border Trade/Delivery Route 2
- 5.5.3 Cross-Border Trade/Delivery Route 3
- 5.5.4 Cross-Border Trade/Delivery Route 4
- 5.5.5 Cross-Border Trade/Delivery Route 5
- 5.6 Trade Policy & Market Access Impact Assessment
- 5.6.1 Tariff & Non-Tariff Barriers
- 5.6.2 Regional Trade & Economic Integration Frameworks
- 5.6.3 Bilateral & Multilateral Trade Agreements
- 5.6.4 Cross-Border Operating, Licensing & Localization Requirements
Note: This chapter applies where cross-border trade or delivery is relevant to Platform as a Service (PaaS). Goods, services, and digital offerings are assessed using applicable classifications and transaction measures. Import-export volumes, trade balances, and route analyses are included only where meaningful to the market.
Chapter 6. Competitive Landscape & Company Benchmarking
- 6.1 Platform as a Service (PaaS) Market Concentration & Structure
- 6.1.1 Herfindahl-Hirschman Index (HHI) – vs. 2024
- 6.1.2 Leading, Mid-Sized & Emerging Player Structure
- 6.1.3 Global, Regional & Local Player Dynamics
- 6.2 Platform as a Service (PaaS) Market Share Analysis – 2024
- 6.2.1 Global Revenue Share by Company
- 6.2.2 Global Volume Share by Company (Volume Where Applicable)
- 6.2.3 Regional Revenue Share
- 6.2.4 Market Share Evolution ( vs. 2024)
- 6.2.5 Company Market Share by Key Segment
- 6.2.6 Company Market Share by Customer Group
- 6.3 Operating Scale, Capacity & Infrastructure Analysis
- 6.3.1 Global Operating Scale & Supply Capacity
- 6.3.2 Resource Utilization & Operating Efficiency
- 6.3.3 Output, Service Delivery & Activity Metrics
- 6.3.4 Operating Footprint & Infrastructure Map
- 6.3.5 Planned Operational & Capacity Expansion
- 6.4 Platform as a Service (PaaS) Competitive Benchmarking Matrix
- 6.4.1 Revenue, Growth, Profitability & Operating Metric Comparison
- 6.4.2 Channel Revenue Mix
- 6.4.3 Geographic Revenue Exposure
- 6.4.4 R&D Intensity
- 6.4.5 Sustainability Maturity
- 6.5 Strategic Developments in Platform as a Service (PaaS) (Last 24 Months)
- 6.5.1 Mergers, Acquisitions & Divestments
- 6.5.2 New Products, Services & Solutions in Platform as a Service (PaaS)
- 6.5.3 Operational & Infrastructure Expansions
- 6.5.4 Strategic Alliances, Joint Ventures & Partnerships
- 6.5.5 Distribution Expansion & Market Entry
- 6.5.6 Sustainability & ESG Initiatives
- 6.6 Competitive Strategy Mapping
- 6.6.1 Leader, Challenger, Follower & Niche Classification
- 6.6.2 Pricing Strategy Comparison
- 6.6.3 Channel Strategy Matrix
Note: Strategic developments are included based on their materiality and the availability of reliable information.
Chapter 7. Global Platform as a Service (PaaS) Market – By Sales & Delivery Channel
- 7.1 Segment Overview
- 7.1.1 Volume & Revenue Split by Channel (2024 & 2032) (Volume Where Applicable)
- 7.1.2 Channel Mix Evolution (2024-2032)
Chapter 8. Regional Market Analysis – Global Overview
- 8.1 Global Regional Overview
- 8.1.1 Regional Volume Share (Volume Where Applicable)
- 8.1.2 Regional Revenue Share
- 8.1.3 Regional Volume by Region (Volume Where Applicable)
- 8.1.4 Regional Revenue by Region
- 8.1.5 Regional Forecast Through 2032
- 8.2 Cross-Regional Segment Analysis
- 8.2.1 By Sales & Delivery Channel
- 8.2.2 By Competitive Positioning & Price Tier
Chapter 9. North America Platform as a Service (PaaS) Market
- 9.1 United States
- 9.2 Canada
- 9.3 Mexico
Chapter 10. Europe Platform as a Service (PaaS) Market
- 10.1 Germany
- 10.2 France
- 10.3 Italy
- 10.4 United Kingdom
- 10.5 Spain
- 10.6 Poland
- 10.7 Russia
- 10.8 Netherlands
- 10.9 Belgium
- 10.10 Sweden
- 10.11 Denmark
- 10.12 Norway
- 10.13 Rest of Europe
Chapter 11. Asia Pacific Platform as a Service (PaaS) Market
- 11.1 China
- 11.2 India
- 11.3 Japan
- 11.4 South Korea
- 11.5 Thailand
- 11.6 Indonesia
- 11.7 Vietnam
- 11.8 Malaysia
- 11.9 Australia
- 11.10 Rest of Asia Pacific
Chapter 12. Latin America Platform as a Service (PaaS) Market
- 12.1 Brazil
- 12.2 Argentina
- 12.3 Colombia
- 12.4 Chile
- 12.5 Rest of Latin America
Chapter 13. Middle East Platform as a Service (PaaS) Market
- 13.1 Saudi Arabia
- 13.2 United Arab Emirates
- 13.3 Turkey
- 13.4 Israel
- 13.5 Iran
- 13.6 Rest of the Middle East
Chapter 14. Africa Platform as a Service (PaaS) Market
- 14.1 South Africa
- 14.2 Egypt
- 14.3 Nigeria
- 14.4 Morocco
- 14.5 Rest of Africa
Chapter 15. Platform as a Service (PaaS) Company Profiles
- 15.1 [Company 01]
- 15.1.1 Company Overview
- 15.1.2 Key Management Personnel
- 15.1.3 Products & Services Portfolio
- 15.1.4 Financial Performance
- 15.1.5 Key Market Focus & Geographic Presence
- 15.1.6 Recent Developments & Strategic Initiatives
Note: The company profile list is preliminary and may change based on research findings, market developments, data availability, and client requirements.
Chapter 16. Appendices
- Appendix A – List of Abbreviations & Acronyms
- Appendix B – Industry Classification Code Reference – Full Series
- Appendix C – Supply, Output & Operating Capacity Data Tables
- Appendix D – End-Use & Demand Base Tables
- Appendix E – Demand, Adoption & Usage Assumptions
- Appendix F – Pricing & Revenue Metric Reference Tables
- Appendix G – Company Operations & Infrastructure Database
- Appendix H – Cross-Border Trade & Activity Data Tables (Where Applicable)
- Appendix I – Regulatory Summary Tables
- Appendix J – Primary Research Participant List (Anonymized)
- Appendix K – Primary Research Questionnaire Framework
- Appendix L – Data Sources & Bibliography
- Appendix M – Market Size Divergence & Source Comparison
Chapter 17. Research Methodology
- 17.1 Research Framework & Philosophy
- 17.2 Secondary Research – Sources, Hierarchy & Data Extraction
- 17.3 Data Modeling – Bottom-Up & Top-Down Market Sizing
- 17.4 Primary Research – Stakeholder Framework, LOI & Sample Sizes
- 17.5 Forecast Methodology – Regression, Scenario & Sensitivity Analysis
- 17.6 Quality Control – Four-Layer Validation Framework
- 17.7 Limitations & Standard Assumptions
- 17.8 Disclaimer
