
| REPORT ATTRIBUTE | DETAILS |
|---|---|
| Historical Period | 2019-2022 |
| Base Year | 2023 |
| Forecast Period | 2024-2032 |
| Polyphenol Market Size 2024 | USD 1,115 million |
| Polyphenol Market, CAGR | 8.32% |
| Polyphenol Market Size 2032 | USD 2,113.21 million |
Market Overview:
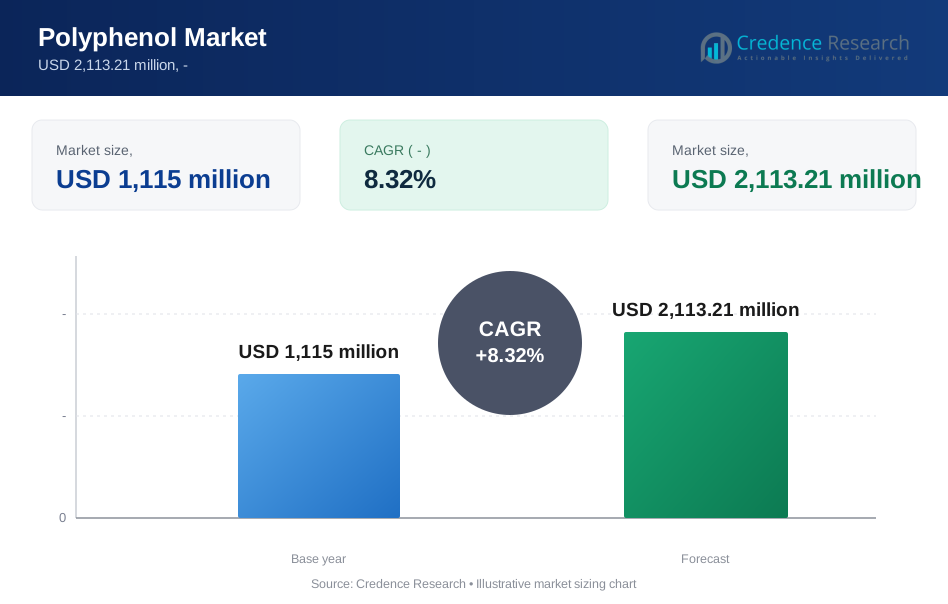
The global polyphenol market is expected to grow significantly from a market size of USD 1,115 million in 2024 to USD 2,113.21 million by 2032, exhibiting a compound annual growth rate (CAGR) of 8.32%. This growth reflects the increasing recognition of polyphenols’ health benefits and their expanding use across industries, particularly in nutraceuticals, functional foods, and cosmetics. Polyphenols, known for their antioxidant properties, are gaining popularity as they help mitigate the effects of oxidative stress and inflammation, making them valuable in health-conscious consumer markets worldwide.
Several factors are driving this growth. The rising prevalence of lifestyle-related diseases, such as cardiovascular disease, diabetes, and obesity, has led to a greater demand for preventive healthcare solutions. Polyphenols, derived from sources like tea, cocoa, grapes, and berries, are increasingly integrated into supplements and functional foods for their potential to improve heart health, cognitive function, and metabolic regulation. Furthermore, as consumers turn toward natural and plant-based ingredients, the demand for polyphenols in cosmetics and personal care products is also rising, where they serve as natural preservatives and skin protectants.
Regionally, North America holds a substantial market share due to high consumer awareness and demand for health-promoting products. The United States, in particular, sees significant adoption in the nutraceutical and cosmetic sectors. Europe follows, with robust growth driven by increasing interest in preventive health and natural supplements, particularly in countries like Germany, the UK, and France. The Asia-Pacific region is expected to witness the fastest growth, fueled by rising disposable incomes, health awareness, and the popularity of traditional polyphenol-rich foods like green tea and herbal extracts in countries such as China, Japan, and India. These regional dynamics underscore a diverse market landscape, with established demand in North America and Europe and strong growth potential in Asia-Pacific.
Market Drivers:
Growing Health Awareness:
The increasing awareness of health benefits associated with polyphenols is a significant driver of market growth. Consumers are becoming more informed about the role of polyphenols in preventing chronic diseases such as diabetes, cardiovascular issues, and certain cancers. For instance, a survey conducted by the International Food Information Council revealed that 75% of consumers consider nutrition and health benefits when choosing food products. This heightened awareness is prompting manufacturers to incorporate polyphenols into functional foods and dietary supplements, thereby expanding their market presence.
Rising Demand for Natural Ingredients:
There is a notable shift towards natural and clean-label products across various consumer segments, particularly in the food and beverage industry. As consumers increasingly seek transparency regarding ingredient sourcing, polyphenols—derived from fruits, vegetables, and other plant sources—are gaining traction. According to a report from the Clean Label Project, 67% of consumers prefer products that contain no artificial additives. This trend is encouraging manufacturers to explore polyphenol-rich ingredients to meet consumer demand for healthier, more natural options.
Expansion in Functional Foods and Beverages:
The growing popularity of functional foods and beverages is another key driver for the polyphenol market. As consumers look for products that offer health benefits beyond basic nutrition, the demand for functional beverages containing polyphenols has surged. For instance, the functional beverage segment accounted for 32.7% of the market share in 2022. Companies are responding by innovating new formulations that incorporate polyphenols, appealing to health-conscious consumers seeking enhanced nutritional profiles.
Technological Advancements in Extraction Methods:
Advancements in extraction technologies are facilitating the efficient production of polyphenols, further driving market growth. Improved extraction methods allow manufacturers to obtain higher yields of polyphenols while preserving their beneficial properties. For instance, companies like ADM are investing in research and development to enhance extraction processes, ensuring that they can provide high-quality polyphenol products at competitive prices. This focus on innovation not only meets rising consumer demand but also positions manufacturers favorably within an increasingly competitive market landscape.
Market Trends:
Growing Demand for Health-Enhancing Products:
The polyphenol market is witnessing increased demand as consumers prioritize health-enhancing products that align with preventative wellness. Polyphenols are renowned for their antioxidant, anti-inflammatory, and anti-aging properties, making them popular in nutraceuticals and dietary supplements. For instance, companies like Nestlé and PepsiCo have expanded their product portfolios to include polyphenol-rich offerings, such as green tea and functional beverages, targeting health-conscious consumers. According to a recent survey, over 60% of consumers actively seek products with natural health benefits, demonstrating the rising interest in polyphenol-based products in daily diets.
Incorporation into Cosmetics and Personal Care:
Polyphenols are increasingly used in cosmetics for their skin-protective qualities and natural preservative properties, aligning with the consumer shift toward clean and plant-based beauty products. For instance, Major brands, including L’Oréal and Estée Lauder, now incorporate polyphenols from green tea and grape seeds in their skincare lines, emphasizing antioxidant and anti-aging benefits. Government surveys indicate that the global demand for clean beauty products has risen by approximately 40% in the past three years, supporting the growth of polyphenols in cosmetic formulations. This trend reflects an enduring preference for natural ingredients that offer health and beauty benefits without synthetic additives.
Expansion in Functional Foods and Beverages:
Functional foods and beverages enriched with polyphenols have gained popularity as consumers seek multi-functional nutrition. Market leaders like Unilever and Danone have introduced polyphenol-enriched teas, yogurt, and juices to meet the demand for functional nutrition. In government studies, over 70% of consumers reported choosing functional foods as part of their wellness routines, highlighting the integration of polyphenols in daily consumables. These additions cater to consumers interested in products that support heart health, cognitive function, and immunity.
Focus on Sustainable Sourcing:
Sustainability is another crucial trend as manufacturers respond to consumer demand for environmentally conscious products. Companies such as ADM and Barry Callebaut have committed to sustainable polyphenol sourcing, focusing on cocoa and tea extracts harvested through eco-friendly practices. Initiatives to reduce the environmental impact of polyphenol extraction align with government sustainability goals, as many countries emphasize green production practices in food and cosmetics sectors. This trend not only addresses consumer demand for ethical sourcing but also reflects broader industry goals to mitigate environmental impact.
Market Challenges Analysis:
Regulatory Compliance Issues:
One of the primary challenges facing the polyphenol market is the complex regulatory landscape governing food and dietary supplements. Different countries have varying standards for labeling, safety, and quality control, which can complicate compliance for manufacturers. For example, the Food Safety and Standards Authority of India (FSSAI) has implemented stringent regulations regarding the production and labeling of food products, including those containing polyphenols. Companies must navigate these regulations carefully to avoid penalties and ensure their products meet local standards.
Consumer Perception and Awareness:
Despite the health benefits associated with polyphenols, consumer awareness remains a significant barrier. Many consumers are not fully educated about the advantages of polyphenols or how they can be incorporated into their diets. A survey by the International Food Information Council found that 60% of consumers are unaware of dietary polyphenols and their potential health benefits. This lack of understanding can hinder market growth as consumers may opt for more familiar products over those enriched with polyphenols.
Supply Chain Challenges:
The sourcing and supply chain for polyphenol-rich ingredients can present challenges for manufacturers. Fluctuations in the availability of raw materials, such as fruits and vegetables high in polyphenols, can disrupt production schedules. Additionally, ensuring consistent quality across different batches can be difficult, particularly when sourcing from multiple suppliers. These supply chain complexities can lead to increased costs and potential delays in bringing products to market.
Competition from Alternative Ingredients:
The polyphenol market faces stiff competition from other functional ingredients that offer similar health benefits. Ingredients such as vitamins, minerals, and other antioxidants are often more familiar to consumers and may be perceived as more effective. The functional food segment is increasingly crowded with alternatives that compete for consumer attention. Manufacturers must invest in marketing strategies that clearly communicate the unique benefits of polyphenols to differentiate their products in this competitive landscape.
Market Segmentation Analysis:
By Type, the market includes flavonoids, phenolic acids, and lignans. Flavonoids dominate due to their antioxidant and anti-inflammatory properties, commonly found in products targeting heart health, cognitive support, and anti-aging. Phenolic acids, sourced from coffee and various fruits, are increasingly popular in functional foods and beverages, while lignans, often extracted from seeds, cater to nutraceuticals targeting hormone regulation.
By Technology, the polyphenol market leverages various extraction methods, such as solvent extraction, ultrasound-assisted extraction, and microwave-assisted extraction. Solvent extraction remains the most widely used, valued for its efficiency and adaptability across different polyphenol sources. However, emerging technologies like ultrasound-assisted extraction are gaining attention for their environmental benefits and improved yield. Such innovations are helping manufacturers meet the rising demand for sustainably sourced polyphenols while enhancing product quality.
By End User, the market serves the nutraceutical, food and beverage, cosmetics, and pharmaceutical sectors. Nutraceuticals hold a significant share as polyphenols are increasingly integrated into dietary supplements promoting overall wellness. The food and beverage industry follows closely, utilizing polyphenols to enhance product appeal with health-boosting ingredients. In cosmetics, polyphenols are favored for their anti-aging and skin-protective benefits, while in pharmaceuticals, they are studied for potential therapeutic applications, particularly in chronic disease prevention.
Segmentations:
By Source:- Grapes
- Green Tea
- Cocoa
- Berries
- Other Sources
- Functional Foods
- Dietary Supplements
- Beverages
- Other Application
- North America
-
- U.S.
- Canada
- Mexico
- Europe
- Germany
- France
- U.K.
- Italy
- Spain
- Rest of Europe
- Asia Pacific
- China
- Japan
- India
- South Korea
- South-east Asia
- Rest of Asia Pacific
- Latin America
- Brazil
- Argentina
- Rest of Latin America
- Middle East & Africa
- GCC Countries
- South Africa
- Rest of the Middle East and Africa
Regional Analysis:
North America
North America holds the largest share of the polyphenol market, accounting for approximately 40% of the global market. This dominant position is driven by high consumer awareness of health benefits and strong demand for nutraceutical and functional food products. The United States leads in polyphenol consumption as dietary supplements, functional beverages, and skin care products gain traction among health-conscious consumers. The U.S. Department of Agriculture (USDA) supports polyphenol research, especially on the cardiovascular and cognitive benefits of these compounds, further bolstering market growth. Canada follows, where rising interest in natural health products and government initiatives supporting plant-based foods contribute to polyphenol demand.
Europe
Europe represents around 30% of the global polyphenol market, fueled by growing awareness of preventive health and a strong preference for natural and plant-based products. Germany, the United Kingdom, and France are major contributors, where demand for polyphenol-rich supplements and skincare products aligns with consumer interests in clean and natural ingredients. European regulatory bodies, including the European Food Safety Authority (EFSA), provide guidelines that ensure product quality and efficacy, strengthening consumer trust in polyphenol-based products. This regulatory environment supports steady growth, and European consumers' inclination toward preventive health solutions reinforces a solid market foundation for polyphenol-rich products across sectors.
Asia-Pacific
The Asia-Pacific region is anticipated to experience the fastest growth in the polyphenol market, projected to capture approximately 20% of the global market by 2032. This growth is driven by rising disposable incomes, expanding middle-class populations, and increasing health awareness, particularly in countries like China, Japan, and India. China and Japan have a strong tradition of polyphenol-rich foods, such as green tea, which has supported market expansion. India, with its rising interest in herbal and functional foods, also represents a significant growth area. Government support for health and wellness initiatives across the region further bolsters demand for polyphenol-based products in various industries, including functional foods and cosmetics.
Latin America
Latin America holds a moderate share of the polyphenol market, at around 7%. Demand is concentrated in countries like Brazil and Mexico, where rising urbanization, shifting dietary preferences, and growing health awareness drive demand for polyphenol-enriched products. Improvements in healthcare infrastructure across these regions and the adoption of wellness trends boost polyphenol usage, particularly in supplements and beverages. While still smaller than other regions, Latin America’s expanding focus on wellness and natural products presents growth potential in the coming years.
Middle East & Africa
The Middle East & Africa account for approximately 3% of the global polyphenol market. This region’s demand is mainly influenced by increased awareness of health and wellness, particularly in the UAE and South Africa. Growing disposable incomes and greater access to health and dietary supplements support the market, though limited awareness in rural areas constrains further expansion. As health-conscious trends grow and polyphenol accessibility improves, demand in these regions is expected to rise, albeit modestly.
Key Player Analysis:
- Ajinomoto Co., Inc.
- Archer Daniels Midland (ADM)
- Koninklijke DSM N.V.
- Naturex (Givaudan)
- Sabinsa Corporation
- Dupont-Danisco
- Indena S.p.A.
- Diana Naturals (Symrise AG)
- Frutarom Industries Ltd.
- Martin Bauer Group
Competitive Analysis:
The polyphenol market is competitive, led by major players such as Ajinomoto Co., Inc., Archer Daniels Midland (ADM), and Koninklijke DSM N.V., which hold substantial market shares due to their established supply chains and extensive portfolios in nutraceuticals, functional foods, and cosmetics. These companies leverage advanced extraction technologies and R&D capabilities to enhance product quality and cater to the rising demand for natural health ingredients. Mid-sized firms like Naturex (Givaudan) and Sabinsa Corporation are gaining traction by focusing on specialized polyphenol applications and sustainable sourcing, appealing to the eco-conscious consumer base. Smaller players and regional manufacturers add to the market's diversity by targeting specific polyphenol sources, such as grape seeds and green tea. Overall, companies are investing heavily in product innovation, sustainable practices, and strategic partnerships to maintain competitive advantage in this growing market.
Recent Developments:
- ADM expanded its polyphenol production capacity in 2023, enhancing its processing facilities to meet the growing demand for plant-based and functional ingredients in the U.S. market. This development supports ADM’s focus on sustainable production while catering to rising consumer interest in health-promoting polyphenols.
- In June 2023, Active Concepts launched a new skincare ingredient, AC PomeaShield, which incorporates pomegranate polyphenols for enhanced skin elasticity and a youthful complexion. This product aligns with the increasing consumer preference for natural, antioxidant-rich skincare solutions.
- RFI Ingredients introduced its FermaPro technology in early 2024, applying it to berry extracts to improve the polyphenol content and bioavailability for nutraceutical applications. This innovation leverages fermentation to maximize the antioxidant benefits of berries, addressing growing consumer demand for natural and effective wellness ingredients.
- In 2024, Kemin Industries launched its expanded line of polyphenol-rich products, with a focus on cognitive and sleep support. Products such as Neumentix™ are tailored to brain health, capitalizing on polyphenol-based ingredients that meet consumer interest in preventative wellness and cognitive enhancement.
Market Concentration & Characteristics:
The polyphenol market is moderately concentrated, led by established players such as Archer Daniels Midland (ADM), Kemin Industries, and Ajinomoto Co., Inc., which hold significant shares due to their advanced production capabilities and diversified portfolios in food, nutraceuticals, and cosmetics. These major companies capitalize on their research and development (R&D) resources to innovate polyphenol applications in functional foods and wellness products, meeting high demand from health-conscious consumers. Additionally, mid-sized firms like Active Concepts and RFI Ingredients are strengthening their positions by focusing on niche applications, such as skincare and targeted health supplements. Market concentration is further influenced by the rise of sustainable practices, as companies strive to reduce environmental impact in polyphenol extraction and production. This competitive landscape highlights a balance of innovation from large players and specialized offerings from smaller brands, each contributing to the sector’s growth trajectory and evolving product offerings.
Report Coverage:
The research report offers an in-depth analysis based on Source, Application, and Region. It details leading market players, providing an overview of their business, product offerings, investments, revenue streams, and key applications. Additionally, the report includes insights into the competitive environment, SWOT analysis, current market trends, as well as the primary drivers and constraints. Furthermore, it discusses various factors that have driven market expansion in recent years. The report also explores market dynamics, regulatory scenarios, and technological advancements that are shaping the industry. It assesses the impact of external factors and global economic changes on market growth. Lastly, it provides strategic recommendations for new entrants and established companies to navigate the complexities of the market.
Future Outlook:
- The polyphenol market is set to grow as consumers increasingly seek natural health solutions, with polyphenols gaining popularity for their antioxidant and anti-inflammatory benefits.
- Expanding applications in functional foods, beverages, and dietary supplements are expected to drive demand, as consumers prioritize wellness and preventative healthcare products.
- Increased use of polyphenols in cosmetics is projected, with brands focusing on natural ingredients for anti-aging and skin-protective formulations, responding to clean beauty trends.
- Innovations in extraction technologies, such as ultrasound and microwave-assisted methods, will enhance efficiency and support sustainable production.
- Rising awareness of polyphenols’ cognitive health benefits will likely fuel demand in supplements targeting mental well-being and cognitive performance.
- Asia-Pacific is expected to see strong growth due to rising disposable incomes and a preference for plant-based, health-promoting ingredients, particularly in China and Japan.
- The trend toward sustainable and transparent sourcing will continue, with leading players investing in eco-friendly supply chains to meet consumer expectations.
- Increased partnerships between polyphenol suppliers and food manufacturers are likely, aimed at creating enhanced functional food products.
- Growth in e-commerce will make polyphenol-based products more accessible globally, expanding market reach beyond traditional retail channels.
- Regulatory support for natural ingredients in nutraceuticals and food products will boost the polyphenol market, especially in North America and Europe.
Request a Free Sample
Fill in your details and we'll send you a free sample report.
- Sample data tables & charts
- Research methodology
Need a Custom Version of This Report?
Tailor the scope, geography, or segments to your exact requirements.
- Custom geography or segment scope
- Direct access to our analyst team
Frequently Asked Questions
What is the current size of the polyphenol market?
What factors are driving the growth of the polyphenol market?
What are some challenges faced by the polyphenol market?
Who are the major players in the polyphenol market?
Which segment is leading the market share?
Table of Content
Chapter 1. Report Introduction
- 1.1 Report Description & Purpose
- 1.1.1 Report Title & Market Definition
- 1.1.2 Unique Selling Propositions (USP) & Key Differentiators
- 1.1.3 Value Proposition for Stakeholders
- 1.2 Research Objectives
- 1.2.1 Market Sizing Objectives (Volume & Revenue)
- 1.2.2 Segmentation Objectives
- 1.2.3 Competitive Intelligence Objectives
- 1.2.4 Forecast & Scenario Objectives
- 1.3 Report Scope
- 1.3.1 Polyphenol Scope – Types & Subtypes Covered
- 1.3.2 Geographic Scope – Regions & Countries Covered
- 1.3.3 Historical Period, Base Year & Forecast Period (the historical period; forecast to the forecast period)
- 1.3.4 Inclusions & Exclusions
- 1.4 HS Code & Classification Framework
- 1.5 Currency, Units & Pricing Basis
- 1.6 Target Stakeholders
- 1.7 Limitations & Assumptions
Chapter 2. Executive Summary
- 2.1 Global Polyphenol Market Snapshot
- 2.1.1 Market Size – Historical (the historical period) & Forecast (the forecast period) (base year: USD 1,115 million → forecast year: USD 2,113.21 million)
- 2.1.2 Volume & Revenue – Global Totals
- 2.1.3 Key Market Highlights – Top Five Facts
- 2.2 Polyphenol Market Segmentation Snapshot
- 2.2.1 Market Split by Region – vs.
- 2.3 Competitive Snapshot
- 2.3.1 Top 10 Players by Revenue Share –
- 2.3.2 Top 10 Players by Volume Share –
- 2.3.3 Recent Strategic Developments (18-Month Summary)
- 2.4 Key Investment Highlights & Strategic Conclusions
Chapter 3. Polyphenol Market Dynamics & Industry Analysis
- 3.1 Market Overview & Context
- 3.1.1 Polyphenol Market Position in the Broader Automotive Value Chain
- 3.1.2 OEM vs. Replacement Market Dynamics
- 3.1.3 Market Maturity & Development Stage by Region
- 3.2 Polyphenol Market Drivers
- 3.3 Polyphenol Market Restraints & Challenges
- 3.4 Polyphenol Market Opportunities
- 3.5 Porter's Five Forces Analysis
- 3.5.1 Threat of New Entrants
- 3.5.2 Bargaining Power of Suppliers
- 3.5.3 Bargaining Power of Buyers
- 3.5.4 Threat of Substitutes
- 3.5.5 Competitive Rivalry – Intensity Assessment
- 3.6 Polyphenol Value Chain Analysis
- 3.6.1 Upstream – Raw Material/Input Suppliers
- 3.6.1.1 Raw Material/Input 1
- 3.6.1.2 Raw Material/Input 2
- 3.6.1.3 Raw Material/Input 3
- 3.6.2 Midstream – Production/Manufacturing/Service Delivery
- 3.6.2.1 Production/Process Overview
- 3.6.2.2 Key Facility Locations & Capacity by Manufacturer
- 3.6.3 Downstream – Distribution & End Consumer
- 3.6.3.1 Primary Channel – B2B/OEM
- 3.6.3.2 Secondary Channels – Dealer, Retail, Online, Direct
- 3.6.4 Value Chain Profitability Analysis
- 3.6.1 Upstream – Raw Material/Input Suppliers
- 3.7 PESTEL Analysis
- 3.7.1 Political Factors
- 3.7.2 Economic Factors
- 3.7.3 Social Factors
- 3.7.4 Technological Factors
- 3.7.5 Environmental Factors
- 3.7.6 Legal Factors
- 3.8 Polyphenol Supply Chain Analysis
- 3.8.1 Raw Material/Input Supply Risk Assessment
- 3.8.2 Manufacturing Concentration Risk (Geographic Exposure)
- 3.8.3 Trade Disruption Impact Analysis
- 3.9 Regulatory & Policy Landscape
Note: The regulatory and policy landscape section covers regulations based on their applicability to the market, Polyphenol category, geography, and scope of the study. Only regulatory frameworks with a material impact on operations, compliance, trade, sustainability, or market access are analyzed in detail.
Chapter 4. Key Investment Pockets & Opportunity Analysis
- 4.1 Polyphenol Market Attractiveness Analysis
- 4.1.1 By Region – Investment Attractiveness Matrix (Volume × CAGR)
- 4.2 Absolute Revenue Growth Opportunity
- 4.2.1 By Region – Absolute USD Growth Through the forecast period
- 4.3 Incremental Volume Opportunity
- 4.3.1 By Region – Incremental Volume Through the forecast period
- 4.3.2 Segment – Incremental Volume
- 4.4 Emerging Submarket Opportunity Deep Dive (Subject to Applicability)
- 4.5 Emerging Market Opportunity Scorecards
- 4.5.1 United States
- 4.5.2 Europe
- 4.5.3 Asia
- 4.5.4 Middle East & Africa
Note: Emerging Market Opportunity Scorecards will be included based on relevance and strategic importance. Regions listed are indicative and may vary depending on data availability and market dynamics.
Chapter 5. Polyphenol Import-Export Analysis & Trade Flows
- 5.1 Global Trade Overview
- 5.1.1 Global Export Value by Country (the historical period)
- 5.1.2 Global Export Volume by Country (the historical period)
- 5.1.3 Global Import Value by Country (the historical period)
- 5.1.4 Global Import Volume by Country (the historical period)
- 5.1.5 Net Trade Balance by Country (the historical period)
- 5.2 Export Analysis – Segment
- 5.2.1 Type 1 (HS Code)
- 5.2.2 Type 2 (HS Code)
- 5.2.3 Type 3 (HS Code)
- 5.2.4 Type 4 (HS Code)
- 5.2.5 Type 5 (HS Code)
- 5.3 Import Analysis – Segment
- 5.3.1 Type 1 (HS Code)
- 5.3.2 Type 2 (HS Code)
- 5.3.3 Type 3 (HS Code)
- 5.3.4 Type 4 (HS Code)
- 5.3.5 Type 5 (HS Code)
- 5.4 Average Unit Trade Prices
- 5.4.1 Average Export Price – Segment & Country
- 5.4.2 Average Import Price – Segment & Source Country
- 5.4.3 Price Trends (the historical period)
- 5.5 Key Trade Route Analysis
- 5.5.1 Trade Route 1
- 5.5.2 Trade Route 2
- 5.5.3 Trade Route 3
- 5.5.4 Trade Route 4
- 5.5.5 Trade Route 5
- 5.6 Trade Policy Impact Assessment
- 5.6.1 US Anti-Dumping & Section 301 Tariffs
- 5.6.2 EU Customs Union Impact
- 5.6.3 Major Free Trade Agreements
- 5.6.4 USMCA Rules of Origin
Note: Trade policy analysis will be included only where relevant to the Polyphenol market.
Chapter 6. Competitive Landscape & Company Benchmarking
- 6.1 Polyphenol Market Concentration & Structure
- 6.1.1 Herfindahl-Hirschman Index (HHI) – vs.
- 6.1.2 Tier 1, Tier 2 & Tier 3 Market Structure
- 6.1.3 Global, Regional & Local Player Dynamics
- 6.2 Polyphenol Market Share Analysis –
- 6.2.1 Global Revenue Share by Company
- 6.2.2 Global Volume Share by Company
- 6.2.3 Regional Revenue Share
- 6.2.4 Market Share Evolution ( vs. )
- 6.2.5 OEM Segment Share by Company
- 6.2.6 Replacement Segment Share by Company
- 6.3 Production/Delivery Capacity & Facility Analysis
- 6.3.1 Global Installed Capacity
- 6.3.2 Capacity Utilization Rates
- 6.3.3 Production/Output Volume
- 6.3.4 Facility Locations & Capacity Map
- 6.3.5 Planned Capacity Additions
- 6.4 Polyphenol Competitive Benchmarking Matrix
- 6.4.1 Revenue, Volume, CAGR & Profitability Comparison
- 6.4.2 Channel Revenue Mix
- 6.4.3 Geographic Revenue Exposure
- 6.4.4 R&D Intensity
- 6.4.5 Sustainability Maturity
- 6.5 Strategic Developments in Polyphenol (Last 24 Months)
- 6.5.1 Mergers, Acquisitions & Divestments
- 6.5.2 New Polyphenol Launches
- 6.5.3 Facility Expansions
- 6.5.4 Strategic Alliances, Joint Ventures & Partnerships
- 6.5.5 Distribution Expansion & Market Entry
- 6.5.6 Sustainability & ESG Initiatives
- 6.6 Competitive Strategy Mapping
- 6.6.1 Leader, Challenger, Follower & Niche Classification
- 6.6.2 Pricing Strategy Comparison
- 6.6.3 Channel Strategy Matrix
Note: Strategic developments are included based on their materiality and the availability of reliable information.
Chapter 7. Global Polyphenol Market – By Distribution Channel
- 7.1 Segment Overview
- 7.1.1 Volume & Revenue Split by Channel ( & )
- 7.1.2 Channel Mix Evolution (the forecast period)
Chapter 8. Regional Market Analysis – Global Overview
- 8.1 Global Regional Overview
- 8.1.1 Regional Volume Share
- 8.1.2 Regional Revenue Share
- 8.1.3 Regional Volume by Region
- 8.1.4 Regional Revenue by Region
- 8.1.5 Regional Forecast Through the forecast period
- 8.2 Cross-Regional Segment Analysis
- 8.2.1 By Distribution Channel
- 8.2.2 By Brand/Price Tier
Chapter 9. North America Polyphenol Market
- 9.1 United States
- 9.2 Canada
- 9.3 Mexico
Chapter 10. Europe Polyphenol Market
- 10.1 Germany
- 10.2 France
- 10.3 Italy
- 10.4 United Kingdom
- 10.5 Spain
- 10.6 Poland
- 10.7 Russia
- 10.8 Netherlands
- 10.9 Belgium
- 10.10 Sweden
- 10.11 Denmark
- 10.12 Norway
- 10.13 Rest of Europe
Chapter 11. Asia Pacific Polyphenol Market
- 11.1 China
- 11.2 India
- 11.3 Japan
- 11.4 South Korea
- 11.5 Thailand
- 11.6 Indonesia
- 11.7 Vietnam
- 11.8 Malaysia
- 11.9 Australia
- 11.10 Rest of Asia Pacific
Chapter 12. Latin America Polyphenol Market
- 12.1 Brazil
- 12.2 Argentina
- 12.3 Colombia
- 12.4 Chile
- 12.5 Rest of Latin America
Chapter 13. Middle East Polyphenol Market
- 13.1 Saudi Arabia
- 13.2 United Arab Emirates
- 13.3 Turkey
- 13.4 Israel
- 13.5 Iran
- 13.6 Rest of the Middle East
Chapter 14. Africa Polyphenol Market
- 14.1 South Africa
- 14.2 Egypt
- 14.3 Nigeria
- 14.4 Morocco
- 14.5 Rest of Africa
Chapter 15. Polyphenol Company Profiles
- 15.1 [Company 01]
- 15.1.1 Company Overview
- 15.1.2 Key Management Personnel
- 15.1.3 Products & Services Portfolio
- 15.1.4 Financial Performance
- 15.1.5 Key Market Focus & Geographic Presence
- 15.1.6 Recent Developments & Strategic Initiatives
Note: The company profile list is preliminary and may change based on research findings, market developments, data availability, and client requirements.
Chapter 16. Appendices
- Appendix A – List of Abbreviations & Acronyms
- Appendix B – Industry Classification Code Reference – Full Series
- Appendix C – Production & Capacity Data Tables
- Appendix D – End-Use & Demand Base Tables
- Appendix E – Consumption & Replacement Rate Assumptions
- Appendix F – ASP Reference Tables
- Appendix G – Manufacturing & Facility Database
- Appendix H – Import-Export Data Tables
- Appendix I – Regulatory Summary Tables
- Appendix J – Primary Research Participant List (Anonymized)
- Appendix K – Primary Research Questionnaire Framework
- Appendix L – Data Sources & Bibliography
- Appendix M – Market Size Divergence & Source Comparison
Chapter 17. Research Methodology
- 17.1 Research Framework & Philosophy
- 17.2 Secondary Research – Sources, Hierarchy & Data Extraction
- 17.3 Data Modeling – Bottom-Up & Top-Down Market Sizing
- 17.4 Primary Research – Stakeholder Framework, LOI & Sample Sizes
- 17.5 Forecast Methodology – Regression, Scenario & Sensitivity Analysis
- 17.6 Quality Control – Four-Layer Validation Framework
- 17.7 Limitations & Standard Assumptions
- 17.8 Disclaimer
