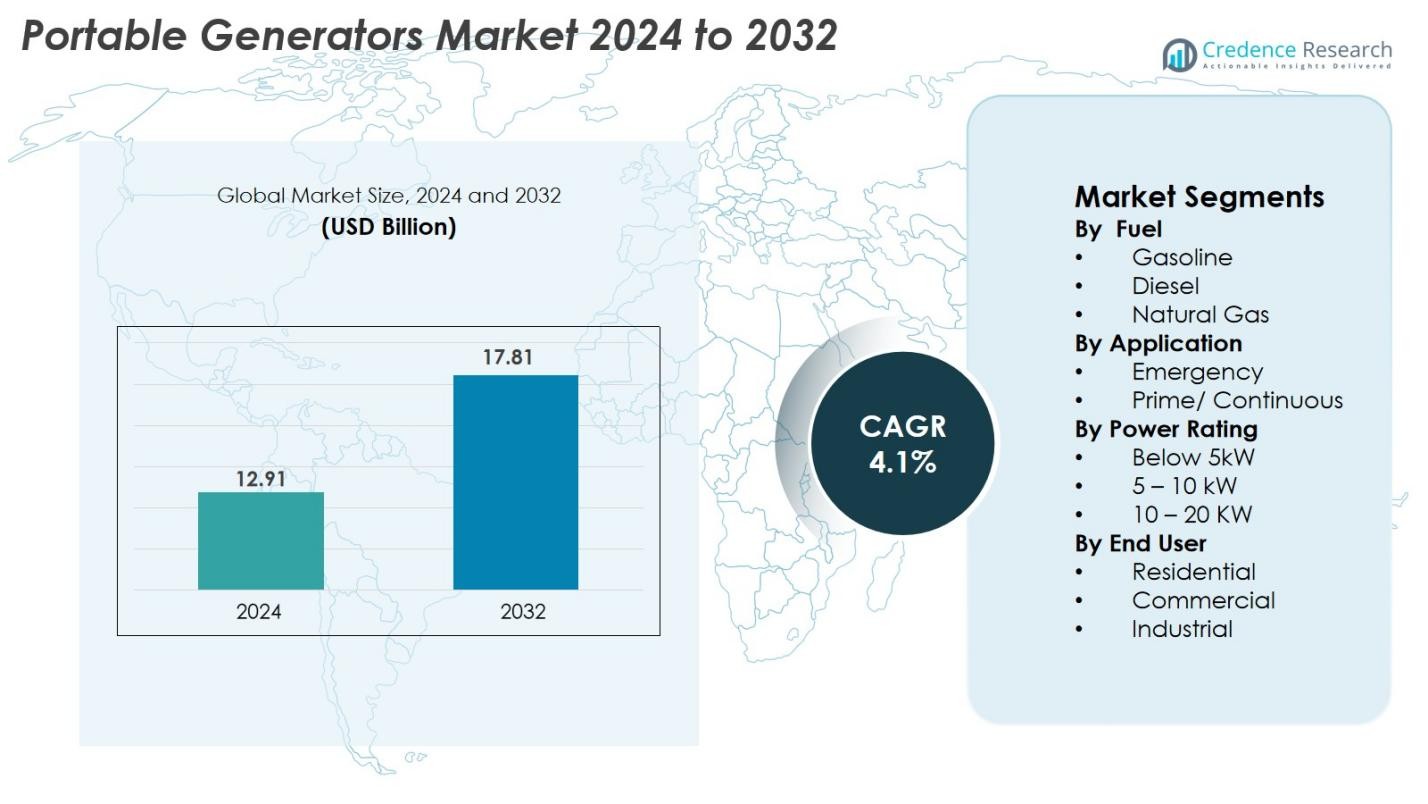
Home » Semiconductor & Electronics » Portable Generators Market

Portable Generators Market By Application (Emergency, Prime/Continuous) By Fuel (Gasoline (Petrol), Diesel, Natural Gas) By Power Rating (Below 5 kW, 5–10 kW, 10–20 kW) By End User (Residential, Commercial, Industrial) – Growth, Share, Opportunities & Competitive Analysis, 2016 – 2028

Price: $4999

Published: | Report ID: 10685 | Report Format : PDF

About this report

The global Portable Generators Market report explores the critical analysis of the portable generators industry using key parameters. The report consists of investment strategies, the need for investments in the portable generators industry, and the multiple benefits for the investors. Importantly, this report sets out major changes in the portable generator industry’s global technical regulations and how economic and non-economic barriers are helping the market grow. Moreover, the report examines historic and forecasted market sizes at the global, regional, and country levels. The report also includes an in-depth examination of key investment propositions, the demand and supply gap, competitor positioning, SRC analysis, STAR analysis, and Tornado analysis. Important technological advancements and other analyses, including Porter’s Five Forces, PESTEL, Value Chain, etc.

Key Highlights of the report

How are the major segments performing in the Portable Generators Market?

The gasoline (petrol) segment led the market in fuel in 2021 and is expected to continue throughout the projection period. Portable gasoline generators are mostly used for short-term, intermittent, or low-load applications. Gasoline is the most common and easiest to obtain fuel, but it is highly flammable and dangerous to store in large quantities. The gasoline (petrol) cost is also somewhat high, and it is typically the least efficient fuel for running a generator, at least over an extended period. It is useful in emergencies, camping, hunting, and other settings. Generators of gasoline (petrol) run more quietly and produce fewer harmful carbon dioxide vapors.

Design Element 2

Access crucial information at unmatched prices!

Request your free sample report today & start making informed decisions powered by Credence Research!

Download Free Sample
CTA Design Element 3

In 2021, the emergency segment held the largest revenue share of the portable generator market by application. Emergency generators are portable power sources used for brief periods during power outages. These generators have an average running time of 10-12 hours with a single tank filling. Portable emergency generators are primarily utilized when natural disasters like storms, torrential rain, and heat waves disrupt the transmission and distribution infrastructure. In developing countries, insufficient power generation infrastructure and poor grid networks have forced small-scale producers and businesses to rely on emergency portable generators.

The 5 – 10 kW segment dominated the global market in terms of power rating in 2021. Portable generators ranging from 5 to 10 kW are used to power devices such as pumps, air conditioners, drills, high-pressure washers, and industrial motors (up to 3 hp). These appliances necessitate more power to operate. They are mostly powered by diesel, natural gas, and propane. The market for these generators is expected to expand due to rising awareness of the importance of in-house power backup and a growing preference for portable powering system applications in outdoor recreational activities.

The residential segment led the end user market in 2021 and is expected to continue throughout the projection period. The unreliability of power grids is attributed to the growth of the residential end-user segment. Besides, areas prone to natural disasters and power outages drive demand for portable generators in the residential end-user segment. Most residential end users rely on portable generators with power ratings of up to 6 kW. These generators are used in homes to power a variety of appliances in times of emergency, including lights, TVs, refrigerators, water pumps, heaters, and air conditioners.

Which region dominated the Portable Generators Market?

The Asia Pacific region dominated the global portable generators market in 2021, owing to an increase in electric power consumption by residential users in nations such as India, China, and Singapore. According to the Energy Information Administration (EIA), Asia-Pacific accounts for nearly 70% of the increase in residential energy consumption. China and India are at the forefront of this consumption due to rising living standards and high demand for energy-consuming appliances, lighting, and equipment. Moreover, the construction sector is expanding in India and China due to government initiatives such as smart cities and green building campaigns. This is expected to support the demand for portable generators throughout the region. Due to increased access to energy sources, India is predicted to experience the fastest relative growth in residential energy usage per person. As a result, the total number of power outages in the residential area will most likely increase the demand for portable generators over the forecast period.

What is the competitive environment of the Portable Generators Market?

The key strategies adopted by the key players in the portable generators market are acquisitions and mergers, product launches, joint ventures, and R&D. For instance, Cummins introduced the QG 2800i and 2500i, 60% quieter RV inverter generators for the recreational vehicle market, in January 2021. They are propelled by liquid propane and gasoline (LP). The Onan QG 2800i and 2500i are inverter-based generator sets with 2.8-kW and 2.5-kW outputs designed primarily for Class B and truck campers. On the other hand, Generac purchased Pika, a manufacturer of home energy storage systems, in May 2019. Pika’s capabilities and portable industrial and commercial generators were combined through the acquisition. The company provides backup power products in various regions, including Puerto Rico, where recent disasters have caused power outages.

Executive Summary

What are all technical developments being developed in the Portable Generators Market?

Advanced electronic circuits and high-tech magnets are used in inverter generators. Inverter generators, as opposed to traditional generators, provide clean AC power and are primarily used to power current-sensitive appliances. The global market for portable generators is anticipated to grow over the forecast period due to technological advancements in portable generator design that maximize efficiency. Companies with advanced technical capabilities are more likely to provide subtly subsidized funding for technological advancements. The portable generator market is changing owing to technological advancements and innovations. Ryobi, Honda, DeWalt, Ego Power, and Nexus are among the portable generator market players that have introduced new models with advanced technology. Portable generators are in high demand due to their lightweight, Bluetooth connectivity, reduced noise and engine hassles, and long recharge times. Thus, technological advancements create new opportunities to expand the portable generator market. For instance, Honda released the Honda My Generator Bluetooth App in September 2019, allowing users to start (electric start models only), stop, and regulate critical operations of Honda portable generators via a Bluetooth interface on a mobile phone.

Which are the key investments by the players in the Portable Generators Market?

Rising R&D investments in new portable generators and technological advancements will open up lucrative opportunities for major market players. Various investments are made across the key player. For instance, GAIL India Ltd. announced in March 2020 that it would invest $567.9 billion over the next five years to expand the National Gas Pipeline Grid and city gas distribution network, which will likely increase demand for portable gasoline generators.

Some of the major players in the market are Briggs & Stratton, Atlas Copco, Yamaha, Generac, Honda, Caterpillar, Cummins, Wacker Neuson, Eaton, Honeywell, Siemens, Kubota, Kohler, Champion, Himoinsa, Loncin, and Duromax.

What are the Major Driving Factors for the Portable Generators Market?

The rising demand for power drives the portable generator market revenue due to rapid urbanization and industrialization, the low cost of flammable gas, increased awareness among end users, and interest in continuous power supply. These generators can be used in standby, prime, persistent, and crest shaving applications in various end-use divisions, for example, the modern, manufacturing, and private sectors. Expanding demand for continuous and dependable power supply, establishing social insurance foundations, increased interest in server farms and IT offices, and rapid urbanization in emerging economies are all expected to drive the portable generator market. The growing frequency of weather-related and non-weather-related (aging grid) power outages presents challenges for small and medium-sized businesses, fueling the portable generator market.

What are the Major Risks for the Portable Generators Market?

The limited power age limit is a significant impediment to the portable generator market. Besides, increasing transmission and distribution usage in major developing countries may hinder the development of the portable generator market during the forecast period. Portable generator emission efficiency is governed by federal, state, and municipal regulations. Environmental regulations that limit carbon emissions are a major impediment to market expansion.

Which is the key End User in the Portable Generators Market?

In 2021, the residential segment led the end-user market, which is expected to continue throughout the forecast period. Portable generators are used in the residential sector for picnics, family gatherings, and camping. Rising consumer preference for emergency backup solutions during a power outage will boost product demand across residential applications. The popularity of portable generators can be attributed to their lower price index and multi-use capacity, which are suitable for a wide range of end-user requirements. Recurrent power outages to meet peak hour demand and increasing end-user awareness of emergency preparedness will complement the business scenario.

How is the Portable Generators Market performing in regions?

The Asia Pacific region dominated the global portable generators market in 2021, attributed to the region’s growing economy and technological advancement. The region’s growing industrialization, urbanization, and demand for and use of portable generators are the main drivers of market expansion. Furthermore, various government initiatives to develop the residential sector in nations such as India and China are expected to drive market growth during the forecast period. In India, for instance, the central government plans to build 20 million affordable houses in urban areas across the country through the Pradhan Mantri Awas Yojana. The demand for portable generators among households in such cities is anticipated to rise, which is anticipated to spur market expansion.

Besides, after the Asia Pacific, North America is the world’s second-largest consumer and producer of electricity. The portable generator market is dominated by the United States and Canada, among the largest consumers in this region and globally. Natural gas network penetration, Power outages, and high peak-time electricity costs are expected to propel the market in this region. The increasing severity and frequency of weather-related disasters and aging grid infrastructure are also expected to drive regional market growth.

What is the regulatory landscape for the Portable Generators Market?

There are numerous commercial, residential, and industrial uses for portable generators. Diesel generators release carbon monoxide, nitrogen oxides, and particulate matter when they burn the fuel. Numerous regulations have been implemented worldwide to reduce air and noise pollution caused by generator sets. Each country has developed regulations and policies to reduce air pollution with growing environmental concerns. For instance, Nitrogen oxide and hydrocarbon emissions from a diesel generator with up to 19 kW of power should not go over 7.5 g/kW h, according to CPCB. The amount of carbon emitted into the atmosphere by generators is regulated by environmental agencies such as India’s Central Pollution Control Board (CPCB), the United States Environmental Protection Agency (EPA), and the European Environmental Agency. Furthermore, every portable generator manufacturer, importer, and assembler must have a Type Approval Certificate for each generator.

What is the Market Size of the Portable Generators regarding value?

The global portable generators market is anticipated to grow at a substantial CAGR of 6.5% in the upcoming years. The global portable generators industry was estimated to be worth USD 1.6 billion in 2021 and was expected to be worth USD 2.33 billion by 2028.

Shape Your Report to Specific Countries or Regions & Enjoy 30% Off!

What are the major players planning for the future of the Portable Generators Market?

Advances in digital technology are enabling effective operational maintenance, efficient production, portfolio expansion, and sales monitoring in the portable generator market. Increasing disposable incomes in developing countries that are developing quickly, decentralized networks, intelligent automation, and proliferation of demand for smart storage are some key market developments. As environmental concerns grow, using additional equipment with a portable generator is one of the new global market trends. This includes the modification of conventional generators. These machines are part of the engineering transition from analog to digital functions. New generators, such as the Wen 3800 and Wen 56200i, are popular. Another trend is the development of fuel-efficient generators that produce more power while using less fuel. The companies are employing next-generation mufflers and more refined engines that produce more power while using less fuel. This is true for diesel-powered portable generators, which also have a low maintenance cost.

Segmentation of Global Portable Generators Market –

Global Portable Generators Market – By Application

  • Emergency
  • Prime/Continuous

Global Portable Generators Market – By Fuel

  • Gasoline (Petrol)
  • Diesel
  • Natural Gas

Global Portable Generators Market – By Power Rating

  • Below 5 kW
  • 5–10 kW
  • 10–20 kW

Global Portable Generators Market – By End User

  • Residential
  • Commercial
  • Industrial

Global Portable Generators Market – By Region

  • North America
    • The U.S.
    • Canada
  • Europe
    • Germany
    • France
    • The U.K.
    • Italy
    • Spain
    • Rest of Europe
  • Asia Pacific
    • China
    • Japan
    • India
    • South Korea
    • South-east Asia
    • Rest of Asia Pacific
  • Latin America
    • Brazil
    • Mexico
    • Rest of Latin America
  • Middle East & Africa
    • GCC Countries
    • South Africa
    • Rest of the Middle East and Africa

1. Preface
1.1. Report Description
1.1.1. Purpose of the Report
1.1.2. Target Audience
1.1.3. USP and Key Offerings
1.2. Research Scope
1.3. Research Methodology
1.3.1. Phase I – Secondary Research
1.3.2. Phase II – Primary Research
1.3.3. Phase III – Expert Panel Review
1.3.4. Approach Adopted
1.3.4.1. Top-Down Approach
1.3.4.2. Bottom-Up Approach
1.3.5. Assumptions
1.4. Market Segmentation

2. Executive Summary
2.1. Market Snapshot: Global Portable Generators Market
2.2. Global Portable Generators Market, By Application
2.3. Global Portable Generators Market, By Fuel
2.4. Global Portable Generators Market, By Power Rating
2.5. Global Portable Generators Market, By End User
2.6. Global Portable Generators Market, By Region

3. Market Dynamics & Factors Analysis
3.1. Introduction
3.1.1. Global Portable Generators Market Value, 2016-2028, (US$ Bn)
3.2. Market Dynamics
3.2.1. Key Growth Trends
3.2.2. Market Drivers
3.2.3. Market Restraints
3.2.4. Market Opportunities
3.2.5. Major Industry Challenges
3.3. Attractive Investment Proposition,2021
3.3.1. Application
3.3.2. Fuel
3.3.3. Power Rating
3.3.4. End User
3.3.5. Geography

4. Premium Insights
4.1. STAR (Situation, Task, Action, Results) Analysis
4.2. Porter’s Five Forces Analysis
4.2.1. Threat of New Entrants
4.2.2. Bargaining Power of Buyers/Consumers
4.2.3. Bargaining Power of Suppliers
4.2.4. Threat of Substitute Types
4.2.5. Intensity of Competitive Rivalry
4.3. Value Chain Analysis
4.4. Technology Analysis
4.5. Marketing Strategy Analysis
4.5.1. Direct Marketing
4.5.2. Indirect Marketing
4.5.3. Marketing Channel Development Trend

5. Market Positioning of Key Players, 2021
5.1. Company market share of key players, 2021
5.2. Competitive Benchmarking
5.3. Market Positioning of Key Vendors
5.4. Geographical Presence Analysis
5.5. Major Strategies Adopted by Key Players
5.5.1. Key Strategies Analysis
5.5.2. Mergers and Acquisitions
5.5.3. Partnerships
5.5.4. Product Launch
5.5.5. Geographical Expansion
5.5.6. Others

6. COVID 19 Impact Analysis
6.1. Global Portable Generators Market Pre Vs Post COVID 19, 2019 – 2028
6.2. Impact on Import & Export
6.3. Impact on Demand & Supply

7. Global Portable Generators Market
7.1. Global Portable Generators Market, by Application, 2016-2028(US$ Bn)
7.1.1. Overview
7.1.2. Global Portable Generators Market, By Application, 2021 vs 2028 (in%)
7.1.3. Global Portable Generators Market, By Emergency, 2016-2028 (US$ Bn)
7.1.4. Global Portable Generators Market, By Prime/Continuous, 2016-2028 (US$ Bn)
7.2. Global Portable Generators Market, by Fuel, 2016-2028(US$ Bn)
7.2.1. Overview
7.2.2. Global Portable Generators Market, By Fuel, 2021 vs 2028 (in%)
7.2.3. Global Portable Generators Market, By Gasoline (Petrol), 2016-2028 (US$ Bn)
7.2.4. Global Portable Generators Market, By Diesel, 2016-2028 (US$ Bn)
7.2.5. Global Portable Generators Market, By Natural Gas, 2016-2028 (US$ Bn)
7.2.6. Global Portable Generators Market, By Others (LPG, Propane, and Biodiesel), 2016-2028 (US$ Bn)
7.3. Global Portable Generators Market, by Power Rating, 2016-2028(US$ Bn)
7.3.1. Overview
7.3.2. Global Portable Generators Market, By Power Rating, 2021 vs 2028 (in%)
7.3.3. Global Portable Generators Market, By Below 5 kW, 2016-2028 (US$ Bn)
7.3.4. Global Portable Generators Market, By 5–10 kW, 2016-2028 (US$ Bn)
7.3.5. Global Portable Generators Market, By 10–20 kW, 2016-2028 (US$ Bn)
7.4. Global Portable Generators Market, by End User, 2016-2028(US$ Bn)
7.4.1. Overview
7.4.2. Global Portable Generators Market, By End User, 2021 vs 2028 (in%)
7.4.3. Global Portable Generators Market, By Residential, 2016-2028 (US$ Bn)
7.4.4. Global Portable Generators Market, By Commercial, 2016-2028 (US$ Bn)
7.4.5. Global Portable Generators Market, By Industrial, 2016-2028 (US$ Bn)

8. North America Portable Generators Market Analysis
8.1. North America Portable Generators Market, by Application, 2016-2028(US$ Bn)
8.1.1. Overview
8.1.2. SRC Analysis
8.2. North America Portable Generators Market, by Fuel, 2016-2028(US$ Bn)
8.2.1. Overview
8.2.2. SRC Analysis
8.3. North America Portable Generators Market, by Power Rating, 2016-2028(US$ Bn)
8.3.1. Overview
8.3.2. SRC Analysis
8.4. North America Portable Generators Market, by End User, 2016-2028(US$ Bn)
8.4.1. Overview
8.4.2. SRC Analysis
8.5. North America Portable Generators Market, by Country, 2016-2028 (US$ Bn)
8.5.1. U.S.
8.5.1.1. U.S. Portable Generators Market Estimates and Forecast, 2016-2028 (US$ Bn)
8.5.1.2. U.S. Portable Generators, By Application, 2016-2028 (US$ Bn)
8.5.1.3. U.S. Portable Generators, By Fuel, 2016-2028 (US$ Bn)
8.5.1.4. U.S. Portable Generators, By Power Rating, 2016-2028 (US$ Bn)
8.5.1.5. U.S. Portable Generators, By End User, 2016-2028 (US$ Bn)
8.5.2. Canada
8.5.2.1. Canada Portable Generators Market Estimates and Forecast, 2016-2028 (US$ Bn)
8.5.2.2. Canada Portable Generators, By Application, 2016-2028 (US$ Bn)
8.5.2.3. Canada Portable Generators, By Fuel, 2016-2028 (US$ Bn)
8.5.2.4. Canada Portable Generators, By Power Rating, 2016-2028 (US$ Bn)
8.5.2.5. Canada Portable Generators, By End User, 2016-2028 (US$ Bn)

9. Europe Portable Generators Market Analysis
9.1. Europe Portable Generators Market, by Application, 2016-2028(US$ Bn)
9.1.1. Overview
9.1.2. SRC Analysis
9.2. Europe Portable Generators Market, by Fuel, 2016-2028(US$ Bn)
9.2.1. Overview
9.2.2. SRC Analysis
9.3. Europe Portable Generators Market, by Power Rating, 2016-2028(US$ Bn)
9.3.1. Overview
9.3.2. SRC Analysis
9.4. Europe Portable Generators Market, by End User, 2016-2028(US$ Bn)
9.4.1. Overview
9.4.2. SRC Analysis
9.5. Europe Portable Generators Market, by Country, 2016-2028 (US$ Bn)
9.5.1. Germany
9.5.1.1. Germany Portable Generators Market Estimates and Forecast, 2016-2028 (US$ Bn)
9.5.1.2. Germany Portable Generators, By Application, 2016-2028 (US$ Bn)
9.5.1.3. Germany Portable Generators, By Fuel, 2016-2028 (US$ Bn)
9.5.1.4. Germany Portable Generators, By Power Rating, 2016-2028 (US$ Bn)
9.5.1.5. Germany Portable Generators, By End User, 2016-2028 (US$ Bn)
9.5.2. France
9.5.2.1. France Portable Generators Market Estimates and Forecast, 2016-2028 (US$ Bn)
9.5.2.2. France Portable Generators, By Application, 2016-2028 (US$ Bn)
9.5.2.3. France Portable Generators, By Fuel, 2016-2028 (US$ Bn)
9.5.2.4. France Portable Generators, By Power Rating, 2016-2028 (US$ Bn)
9.5.2.5. France Portable Generators, By End User, 2016-2028 (US$ Bn)
9.5.3. UK
9.5.3.1. UK Portable Generators Market Estimates and Forecast, 2016-2028 (US$ Bn)
9.5.3.2. UK Portable Generators, By Application, 2016-2028 (US$ Bn)
9.5.3.3. UK Portable Generators, By Fuel, 2016-2028 (US$ Bn)
9.5.3.4. UK Portable Generators, By Power Rating, 2016-2028 (US$ Bn)
9.5.3.5. UK Portable Generators, By End User, 2016-2028 (US$ Bn)
9.5.4. Italy
9.5.4.1. Italy Portable Generators Market Estimates and Forecast, 2016-2028 (US$ Bn)
9.5.4.2. Italy Portable Generators, By Application, 2016-2028 (US$ Bn)
9.5.4.3. Italy Portable Generators, By Fuel, 2016-2028 (US$ Bn)
9.5.4.4. Italy Portable Generators, By Power Rating, 2016-2028 (US$ Bn)
9.5.4.5. Italy Portable Generators, By End User, 2016-2028 (US$ Bn)
9.5.5. Spain
9.5.5.1. Spain Portable Generators Market Estimates and Forecast, 2016-2028 (US$ Bn)
9.5.5.2. Spain Portable Generators, By Application, 2016-2028 (US$ Bn)
9.5.5.3. Spain Portable Generators, By Fuel, 2016-2028 (US$ Bn)
9.5.5.4. Spain Portable Generators, By Power Rating, 2016-2028 (US$ Bn)
9.5.5.5. Spain Portable Generators, By End User, 2016-2028 (US$ Bn)
9.5.6. Rest of Europe
9.5.6.1. Rest of Europe Portable Generators Market Estimates and Forecast, 2016-2028 (US$ Bn)
9.5.6.2. Rest of Europe Portable Generators, By Application, 2016-2028 (US$ Bn)
9.5.6.3. Rest of Europe Portable Generators, By Fuel, 2016-2028 (US$ Bn)
9.5.6.4. Rest of Europe Portable Generators, By Power Rating, 2016-2028 (US$ Bn)
9.5.6.5. Rest of Europe Portable Generators, By End User, 2016-2028 (US$ Bn)

10. Asia Pacific Portable Generators Market Analysis
10.1. Asia Pacific Portable Generators Market, by Application, 2016-2028(US$ Bn)
10.1.1. Overview
10.1.2. SRC Analysis
10.2. Asia Pacific Portable Generators Market, by Fuel, 2016-2028(US$ Bn)
10.2.1. Overview
10.2.2. SRC Analysis
10.3. Asia Pacific Portable Generators Market, by Power Rating, 2016-2028(US$ Bn)
10.3.1. Overview
10.3.2. SRC Analysis
10.4. Asia Pacific Portable Generators Market, by End User, 2016-2028(US$ Bn)
10.4.1. Overview
10.4.2. SRC Analysis
10.5. Asia Pacific Portable Generators Market, by Country, 2016-2028 (US$ Bn)
10.5.1. China
10.5.1.1. China Portable Generators Market Estimates and Forecast, 2016-2028 (US$ Bn)
10.5.1.2. China Portable Generators, By Application, 2016-2028 (US$ Bn)
10.5.1.3. China Portable Generators, By Fuel, 2016-2028 (US$ Bn)
10.5.1.4. China Portable Generators, By Power Rating, 2016-2028 (US$ Bn)
10.5.1.5. China Portable Generators, By End User, 2016-2028 (US$ Bn)
10.5.2. Japan
10.5.2.1. Japan Portable Generators Market Estimates and Forecast, 2016-2028 (US$ Bn)
10.5.2.2. Japan Portable Generators, By Application, 2016-2028 (US$ Bn)
10.5.2.3. Japan Portable Generators, By Fuel, 2016-2028 (US$ Bn)
10.5.2.4. Japan Portable Generators, By Power Rating, 2016-2028 (US$ Bn)
10.5.2.5. Japan Portable Generators, By End User, 2016-2028 (US$ Bn)
10.5.3. India
10.5.3.1. India Portable Generators Market Estimates and Forecast, 2016-2028 (US$ Bn)
10.5.3.2. India Portable Generators, By Application, 2016-2028 (US$ Bn)
10.5.3.3. India Portable Generators, By Fuel, 2016-2028 (US$ Bn)
10.5.3.4. India Portable Generators, By Power Rating, 2016-2028 (US$ Bn)
10.5.3.5. India Portable Generators, By End User, 2016-2028 (US$ Bn)
10.5.4. South Korea
10.5.4.1. South Korea Portable Generators Market Estimates and Forecast, 2016-2028 (US$ Bn)
10.5.4.2. South Korea Portable Generators, By Application, 2016-2028 (US$ Bn)
10.5.4.3. South Korea Portable Generators, By Fuel, 2016-2028 (US$ Bn)
10.5.4.4. South Korea Portable Generators, By Power Rating, 2016-2028 (US$ Bn)
10.5.4.5. South Korea Portable Generators, By End User, 2016-2028 (US$ Bn)
10.5.5. South-East Asia
10.5.5.1. South-East Asia Portable Generators Market Estimates and Forecast, 2016-2028 (US$ Bn)
10.5.5.2. South-East Asia Portable Generators, By Application, 2016-2028 (US$ Bn)
10.5.5.3. South-East Asia Portable Generators, By Fuel, 2016-2028 (US$ Bn)
10.5.5.4. South-East Asia Portable Generators, By Power Rating, 2016-2028 (US$ Bn)
10.5.5.5. South-East Asia Portable Generators, By End User, 2016-2028 (US$ Bn)
10.5.6. Rest of Asia Pacific
10.5.6.1. Rest of Asia Pacific Portable Generators Market Estimates and Forecast, 2016-2028 (US$ Bn)
10.5.6.2. Rest of Asia Pacific Portable Generators, By Application, 2016-2028 (US$ Bn)
10.5.6.3. Rest of Asia Pacific Portable Generators, By Fuel, 2016-2028 (US$ Bn)
10.5.6.4. Rest of Asia Pacific Portable Generators, By Power Rating, 2016-2028 (US$ Bn)
10.5.6.5. Rest of Asia Pacific Portable Generators, By End User, 2016-2028 (US$ Bn)

11. Latin America Portable Generators Market Analysis
11.1. Latin America Portable Generators Market, by Application, 2016-2028(US$ Bn)
11.1.1. Overview
11.1.2. SRC Analysis
11.2. Latin America Portable Generators Market, by Fuel, 2016-2028(US$ Bn)
11.2.1. Overview
11.2.2. SRC Analysis
11.3. Latin America Portable Generators Market, by Power Rating, 2016-2028(US$ Bn)
11.3.1. Overview
11.3.2. SRC Analysis
11.4. Latin America Portable Generators Market, by End User, 2016-2028(US$ Bn)
11.4.1. Overview
11.4.2. SRC Analysis
11.5. Latin America Portable Generators Market, by Country, 2016-2028 (US$ Bn)
11.5.1. Brazil
11.5.1.1. Brazil Portable Generators Market Estimates and Forecast, 2016-2028 (US$ Bn)
11.5.1.2. Brazil Portable Generators, By Application, 2016-2028 (US$ Bn)
11.5.1.3. Brazil Portable Generators, By Fuel, 2016-2028 (US$ Bn)
11.5.1.4. Brazil Portable Generators, By Power Rating, 2016-2028 (US$ Bn)
11.5.1.5. Brazil Portable Generators, By End User, 2016-2028 (US$ Bn)
11.5.2. Mexico
11.5.2.1. Mexico Portable Generators Market Estimates and Forecast, 2016-2028 (US$ Bn)
11.5.2.2. Mexico Portable Generators, By Application, 2016-2028 (US$ Bn)
11.5.2.3. Mexico Portable Generators, By Fuel, 2016-2028 (US$ Bn)
11.5.2.4. Mexico Portable Generators, By Power Rating, 2016-2028 (US$ Bn)
11.5.2.5. Mexico Portable Generators, By End User, 2016-2028 (US$ Bn)
11.5.3. Rest of Latin America
11.5.3.1. Rest of Latin America Portable Generators Market Estimates and Forecast, 2016-2028 (US$ Bn)
11.5.3.2. Rest of Latin America Portable Generators, By Application, 2016-2028 (US$ Bn)
11.5.3.3. Rest of Latin America Portable Generators, By Fuel, 2016-2028 (US$ Bn)
11.5.3.4. Rest of Latin America Portable Generators, By Power Rating, 2016-2028 (US$ Bn)
11.5.3.5. Rest of Latin America Portable Generators, By End User, 2016-2028 (US$ Bn)

12. Middle East and Africa Portable Generators Market Analysis
12.1. Middle East and Africa Portable Generators Market, by Application, 2016-2028(US$ Bn)
12.1.1. Overview
12.1.2. SRC Analysis
12.2. Middle East and Africa Portable Generators Market, by Fuel, 2016-2028(US$ Bn)
12.2.1. Overview
12.2.2. SRC Analysis
12.3. Middle East and Africa Portable Generators Market, by Power Rating, 2016-2028(US$ Bn)
12.3.1. Overview
12.3.2. SRC Analysis
12.4. Middle East and Africa Portable Generators Market, by End User, 2016-2028(US$ Bn)
12.4.1. Overview
12.4.2. SRC Analysis
12.5. Middle East and Africa Portable Generators Market, by Country, 2016-2028 (US$ Bn)
12.5.1. GCC Countries
12.5.1.1. GCC Countries Portable Generators Market Estimates and Forecast, 2016-2028 (US$ Bn)
12.5.1.2. GCC Countries Portable Generators, By Application, 2016-2028 (US$ Bn)
12.5.1.3. GCC Countries Portable Generators, By Fuel, 2016-2028 (US$ Bn)
12.5.1.4. GCC Countries Portable Generators, By Power Rating, 2016-2028 (US$ Bn)
12.5.1.5. GCC Countries Portable Generators, By End User, 2016-2028 (US$ Bn)
12.5.2. South Africa
12.5.2.1. South Africa Portable Generators Market Estimates and Forecast, 2016-2028 (US$ Bn)
12.5.2.2. South Africa Portable Generators, By Application, 2016-2028 (US$ Bn)
12.5.2.3. South Africa Portable Generators, By Fuel, 2016-2028 (US$ Bn)
12.5.2.4. South Africa Portable Generators, By Power Rating, 2016-2028 (US$ Bn)
12.5.2.5. South Africa Portable Generators, By End User, 2016-2028 (US$ Bn)
12.5.3. Rest of Middle East and Africa
12.5.3.1. Rest of Middle East and Africa Portable Generators Market Estimates and Forecast, 2016-2028 (US$ Bn)
12.5.3.2. Rest of Middle East and Africa Portable Generators, By Application, 2016-2028 (US$ Bn)
12.5.3.3. Rest of Middle East and Africa Portable Generators, By Fuel, 2016-2028 (US$ Bn)
12.5.3.4. Rest of Middle East and Africa Portable Generators, By Power Rating, 2016-2028 (US$ Bn)
12.5.3.5. Rest of Middle East and Africa Portable Generators, By End User, 2016-2028 (US$ Bn)

13. Company Profiles
13.1. Atlas Copco (Sweden)
13.1.1. Company Overview
13.1.2. Products/Services Portfolio
13.1.3. Geographical Presence
13.1.4. Financial Summary
13.1.4.1. Market Revenue and Net Profit (2019-2021)
13.1.4.2. Business Segment Revenue Analysis
13.1.4.3. Geographical Revenue Analysis
13.2. Briggs & Stratton (US)
13.3. Generac (US)
13.4. Honda (Japan)
13.5. Yamaha (Japan)
13.6. Caterpillar (US)
13.7. Cummins (US)
13.8. Eaton (Ireland)
13.9. Honeywell (US)
13.10. Siemens (Germany)
13.11. Wacker Neuson (Germany)
13.12. Kubota (Japan)
13.13. Kohler (US)
13.14. Champion (US)
13.15. Himoinsa (Spain)
13.16. Duromax (US)
13.17. Loncin (China)
13.18. Others

List of Figures

FIG. 1 Global Portable Generators Market: Research Methodology
FIG. 2 Market Size Estimation – Top Down & Bottom up Approach
FIG. 3 Global Portable Generators Market Segmentation
FIG. 4 Global Portable Generators Market, by Application, 2021 (US$ Bn)
FIG. 5 Global Portable Generators Market, by Fuel, 2021 (US$ Bn)
FIG. 6 Global Portable Generators Market, by Power Rating, 2021 (US$ Bn)
FIG. 7 Global Portable Generators Market, by End User, 2021 (US$ Bn)
FIG. 8 Global Portable Generators Market, by Geography, 2021 (US$ Bn)
FIG. 9 Attractive Investment Proposition, by Application, 2021
FIG. 10 Attractive Investment Proposition, by Fuel, 2021
FIG. 11 Attractive Investment Proposition, by Power Rating, 2021
FIG. 12 Attractive Investment Proposition, by End User, 2021
FIG. 13 Attractive Investment Proposition, by Geography, 2021
FIG. 14 Global Market Share Analysis of Key Portable Generators Market Manufacturers, 2021
FIG. 15 Global Market Positioning of Key Portable Generators Market Manufacturers, 2021
FIG. 16 Global Portable Generators Market Value Contribution, By Application, 2021 & 2028 (Value %)
FIG. 17 Global Portable Generators Market, by Emergency, Value, 2016-2028 (US$ Bn)
FIG. 18 Global Portable Generators Market, by Prime/Continuous, Value, 2016-2028 (US$ Bn)
FIG. 19 Global Portable Generators Market Value Contribution, By Fuel, 2021 & 2028 (Value %)
FIG. 20 Global Portable Generators Market, by Gasoline (Petrol), Value, 2016-2028 (US$ Bn)
FIG. 21 Global Portable Generators Market, by Diesel, Value, 2016-2028 (US$ Bn)
FIG. 22 Global Portable Generators Market, by Natural Gas, Value, 2016-2028 (US$ Bn)
FIG. 23 Global Portable Generators Market, by Others (LPG, Propane, and Biodiesel), Value, 2016-2028 (US$ Bn)
FIG. 24 Global Portable Generators Market Value Contribution, By Power Rating, 2021 & 2028 (Value %)
FIG. 25 Global Portable Generators Market, by Below 5 kW, Value, 2016-2028 (US$ Bn)
FIG. 26 Global Portable Generators Market, by 5–10 kW, Value, 2016-2028 (US$ Bn)
FIG. 27 Global Portable Generators Market, by 10–20 kW, Value, 2016-2028 (US$ Bn)
FIG. 28 Global Portable Generators Market Value Contribution, By End User, 2021 & 2028 (Value %)
FIG. 29 Global Portable Generators Market, by Residential, Value, 2016-2028 (US$ Bn)
FIG. 30 Global Portable Generators Market, by Commercial, Value, 2016-2028 (US$ Bn)
FIG. 31 Global Portable Generators Market, by Industrial, Value, 2016-2028 (US$ Bn)
FIG. 32 U.S. Portable Generators Market, 2016-2028 (US$ Bn)
FIG. 33 Canada Portable Generators Market, 2016-2028 (US$ Bn)
FIG. 34 Germany Portable Generators Market, 2016-2028 (US$ Bn)
FIG. 35 France Portable Generators Market, 2016-2028 (US$ Bn)
FIG. 36 U.K. Portable Generators Market, 2016-2028 (US$ Bn)
FIG. 37 Italy Portable Generators Market, 2016-2028 (US$ Bn)
FIG. 38 Spain Portable Generators Market, 2016-2028 (US$ Bn)
FIG. 39 Rest of Europe Portable Generators Market, 2016-2028 (US$ Bn)
FIG. 40 China Portable Generators Market, 2016-2028 (US$ Bn)
FIG. 41 Japan Portable Generators Market, 2016-2028 (US$ Bn)
FIG. 42 India Portable Generators Market, 2016-2028 (US$ Bn)
FIG. 43 South Korea Portable Generators Market, 2016-2028 (US$ Bn)
FIG. 44 Southeast Asia Portable Generators Market, 2016-2028 (US$ Bn)
FIG. 45 Rest of Asia Pacific Portable Generators Market, 2016-2028 (US$ Bn)
FIG. 46 Latin America Portable Generators Market, 2016-2028 (US$ Bn)
FIG. 47 Brazil Portable Generators Market, 2016-2028 (US$ Bn)
FIG. 48 Mexico Portable Generators Market, 2016-2028 (US$ Bn)
FIG. 49 Rest of Latin America Portable Generators Market, 2016-2028 (US$ Bn)
FIG. 50 Middle East & Africa Portable Generators Market, 2016-2028 (US$ Bn)
FIG. 51 GCC Countries Portable Generators Market, 2016-2028 (US$ Bn)
FIG. 52 South Africa Portable Generators Market, 2016-2028 (US$ Bn)
FIG. 53 Rest of Middle East and Africa Portable Generators Market, 2016-2028 (US$ Bn)

List of Tables

TABLE 1 Market Snapshot: Global Portable Generators Market
TABLE 2 Global Portable Generators Market, by Competitive Benchmarking, 2021
TABLE 3 Global Portable Generators Market, by Geographical Presence Analysis, 2021
TABLE 4 Global Portable Generators Market, by Key Strategies Analysis, 2021
TABLE 5 Global Portable Generators Market, by Application, 2016-2028 (US$ Bn)
TABLE 6 Global Portable Generators Market, by Fuel, 2016-2028 (US$ Bn)
TABLE 7 Global Portable Generators Market, by Power Rating, 2016-2028 (US$ Bn)
TABLE 8 Global Portable Generators Market, by End User, 2016-2028 (US$ Bn)
TABLE 9 Global Portable Generators Market, by Geography, 2016-2028 (US$ Bn)
TABLE 10 North America Portable Generators Market, by Application, 2016-2028 (US$ Bn)
TABLE 11 North America Portable Generators Market, by Fuel, 2016-2028 (US$ Bn)
TABLE 12 North America Portable Generators Market, by Power Rating, 2016-2028 (US$ Bn)
TABLE 13 North America Portable Generators Market, by End User, 2016-2028 (US$ Bn)
TABLE 14 North America Portable Generators Market, by Country, 2016-2028 (US$ Bn)
TABLE 15 US Portable Generators Market, by Application, 2016-2028 (US$ Bn)
TABLE 16 US Portable Generators Market, by Fuel, 2016-2028 (US$ Bn)
TABLE 17 US Portable Generators Market, by Power Rating, 2016-2028 (US$ Bn)
TABLE 18 US Portable Generators Market, by End User, 2016-2028 (US$ Bn)
TABLE 19 Canada Portable Generators Market, by Application, 2016-2028 (US$ Bn)
TABLE 20 Canada Portable Generators Market, by Fuel, 2016-2028 (US$ Bn)
TABLE 21 Canada Portable Generators Market, by Power Rating, 2016-2028 (US$ Bn)
TABLE 22 Canada Portable Generators Market, by End User, 2016-2028 (US$ Bn)
TABLE 23 Europe Portable Generators Market, by Application, 2016-2028 (US$ Bn)
TABLE 24 Europe Portable Generators Market, by Fuel, 2016-2028 (US$ Bn)
TABLE 25 Europe Portable Generators Market, by Power Rating, 2016-2028 (US$ Bn)
TABLE 26 Europe Portable Generators Market, by End User, 2016-2028 (US$ Bn)
TABLE 27 Europe Portable Generators Market, by Country, 2016-2028 (US$ Bn)
TABLE 28 Germany Portable Generators Market, by Application, 2016-2028 (US$ Bn)
TABLE 29 Germany Portable Generators Market, by Fuel, 2016-2028 (US$ Bn)
TABLE 30 Germany Portable Generators Market, by Power Rating, 2016-2028 (US$ Bn)
TABLE 31 Germany Portable Generators Market, by End User, 2016-2028 (US$ Bn)
TABLE 32 France Portable Generators Market, by Application, 2016-2028 (US$ Bn)
TABLE 33 France Portable Generators Market, by Fuel, 2016-2028 (US$ Bn)
TABLE 34 France Portable Generators Market, by Power Rating, 2016-2028 (US$ Bn)
TABLE 35 France Portable Generators Market, by End User, 2016-2028 (US$ Bn)
TABLE 36 UK Portable Generators Market, by Application, 2016-2028 (US$ Bn)
TABLE 37 UK Portable Generators Market, by Fuel, 2016-2028 (US$ Bn)
TABLE 38 UK Portable Generators Market, by Power Rating, 2016-2028 (US$ Bn)
TABLE 39 UK Portable Generators Market, by End User, 2016-2028 (US$ Bn)
TABLE 40 Italy Portable Generators Market, by Application, 2016-2028 (US$ Bn)
TABLE 41 Italy Portable Generators Market, by Fuel, 2016-2028 (US$ Bn)
TABLE 42 Italy Portable Generators Market, by Power Rating, 2016-2028 (US$ Bn)
TABLE 43 Italy Portable Generators Market, by End User, 2016-2028 (US$ Bn)
TABLE 44 Spain Portable Generators Market, by Application, 2016-2028 (US$ Bn)
TABLE 45 Spain Portable Generators Market, by Fuel, 2016-2028 (US$ Bn)
TABLE 46 Spain Portable Generators Market, by Power Rating, 2016-2028 (US$ Bn)
TABLE 47 Spain Portable Generators Market, by End User, 2016-2028 (US$ Bn)
TABLE 48 Rest of Europe Portable Generators Market, by Application, 2016-2028 (US$ Bn)
TABLE 49 Rest of Europe Portable Generators Market, by Fuel, 2016-2028 (US$ Bn)
TABLE 50 Rest of Europe Portable Generators Market, by Power Rating, 2016-2028 (US$ Bn)
TABLE 51 Rest of Europe Portable Generators Market, by End User, 2016-2028 (US$ Bn)
TABLE 52 Asia Pacific Portable Generators Market, by Application, 2016-2028 (US$ Bn)
TABLE 53 Asia Pacific Portable Generators Market, by Fuel, 2016-2028 (US$ Bn)
TABLE 54 Asia Pacific Portable Generators Market, by Power Rating, 2016-2028 (US$ Bn)
TABLE 55 Asia Pacific Portable Generators Market, by End User, 2016-2028 (US$ Bn)
TABLE 56 Asia Pacific Portable Generators Market, by Country, 2016-2028 (US$ Bn)
TABLE 57 China Portable Generators Market, by Application, 2016-2028 (US$ Bn)
TABLE 58 China Portable Generators Market, by Fuel, 2016-2028 (US$ Bn)
TABLE 59 China Portable Generators Market, by Power Rating, 2016-2028 (US$ Bn)
TABLE 60 China Portable Generators Market, by End User, 2016-2028 (US$ Bn)
TABLE 61 Japan Portable Generators Market, by Application, 2016-2028 (US$ Bn)
TABLE 62 Japan Portable Generators Market, by Fuel, 2016-2028 (US$ Bn)
TABLE 63 Japan Portable Generators Market, by Power Rating, 2016-2028 (US$ Bn)
TABLE 64 Japan Portable Generators Market, by End User, 2016-2028 (US$ Bn)
TABLE 65 India Portable Generators Market, by Application, 2016-2028 (US$ Bn)
TABLE 66 India Portable Generators Market, by Fuel, 2016-2028 (US$ Bn)
TABLE 67 India Portable Generators Market, by Power Rating, 2016-2028 (US$ Bn)
TABLE 68 India Portable Generators Market, by End User, 2016-2028 (US$ Bn)
TABLE 69 South Korea Portable Generators Market, by Application, 2016-2028 (US$ Bn)
TABLE 70 South Korea Portable Generators Market, by Fuel, 2016-2028 (US$ Bn)
TABLE 71 South Korea Portable Generators Market, by Power Rating, 2016-2028 (US$ Bn)
TABLE 72 South Korea Portable Generators Market, by End User, 2016-2028 (US$ Bn)
TABLE 73 South East Asia Portable Generators Market, by Application, 2016-2028 (US$ Bn)
TABLE 74 South East Asia Portable Generators Market, by Fuel, 2016-2028 (US$ Bn)
TABLE 75 South East Asia Portable Generators Market, by Power Rating, 2016-2028 (US$ Bn)
TABLE 76 South East Asia Portable Generators Market, by End User, 2016-2028 (US$ Bn)
TABLE 77 Rest of Asia Pacific Portable Generators Market, by Application, 2016-2028 (US$ Bn)
TABLE 78 Rest of Asia Pacific Portable Generators Market, by Fuel, 2016-2028 (US$ Bn)
TABLE 79 Rest of Asia Pacific Portable Generators Market, by Power Rating, 2016-2028 (US$ Bn)
TABLE 80 Rest of Asia Pacific Portable Generators Market, by End User, 2016-2028 (US$ Bn)
TABLE 81 Latin America Portable Generators Market, by Application, 2016-2028 (US$ Bn)
TABLE 82 Latin America Portable Generators Market, by Fuel, 2016-2028 (US$ Bn)
TABLE 83 Latin America Portable Generators Market, by Power Rating, 2016-2028 (US$ Bn)
TABLE 84 Latin America Portable Generators Market, by End User, 2016-2028 (US$ Bn)
TABLE 85 Latin America Portable Generators Market, by Country, 2016-2028 (US$ Bn)
TABLE 86 Brazil Portable Generators Market, by Application, 2016-2028 (US$ Bn)
TABLE 87 Brazil Portable Generators Market, by Fuel, 2016-2028 (US$ Bn)
TABLE 88 Brazil Portable Generators Market, by Power Rating, 2016-2028 (US$ Bn)
TABLE 89 Brazil Portable Generators Market, by End User, 2016-2028 (US$ Bn)
TABLE 90 Mexico Portable Generators Market, by Application, 2016-2028 (US$ Bn)
TABLE 91 Mexico Portable Generators Market, by Fuel, 2016-2028 (US$ Bn)
TABLE 92 Mexico Portable Generators Market, by Power Rating, 2016-2028 (US$ Bn)
TABLE 93 Mexico Portable Generators Market, by End User, 2016-2028 (US$ Bn)
TABLE 94 Rest of Latin America Portable Generators Market, by Application, 2016-2028 (US$ Bn)
TABLE 95 Rest of Latin America Portable Generators Market, by Fuel, 2016-2028 (US$ Bn)
TABLE 96 Rest of Latin America Portable Generators Market, by Power Rating, 2016-2028 (US$ Bn)
TABLE 97 Rest of Latin America Portable Generators Market, by End User, 2016-2028 (US$ Bn)
TABLE 98 Middle East and Africa Portable Generators Market, by Application, 2016-2028 (US$ Bn)
TABLE 99 Middle East and Africa Portable Generators Market, by Fuel, 2016-2028 (US$ Bn)
TABLE 100 Middle East and Africa Portable Generators Market, by Power Rating, 2016-2028 (US$ Bn)
TABLE 101 Middle East and Africa Portable Generators Market, by End User, 2016-2028 (US$ Bn)
TABLE 102 Middle East and Africa Portable Generators Market, by Country, 2016-2028 (US$ Bn)
TABLE 103 GCC Countries Portable Generators Market, by Application, 2016-2028 (US$ Bn)
TABLE 104 GCC Countries Portable Generators Market, by Fuel, 2016-2028 (US$ Bn)
TABLE 105 GCC Countries Portable Generators Market, by Power Rating, 2016-2028 (US$ Bn)
TABLE 106 GCC Countries Portable Generators Market, by End User, 2016-2028 (US$ Bn)
TABLE 107 South Africa Portable Generators Market, by Application, 2016-2028 (US$ Bn)
TABLE 108 South Africa Portable Generators Market, by Fuel, 2016-2028 (US$ Bn)
TABLE 109 South Africa Portable Generators Market, by Power Rating, 2016-2028 (US$ Bn)
TABLE 110 South Africa Portable Generators Market, by End User, 2016-2028 (US$ Bn)
TABLE 111 Rest of Middle East and Africa Portable Generators Market, by Application, 2016-2028 (US$ Bn)
TABLE 112 Rest of Middle East and Africa Portable Generators Market, by Fuel, 2016-2028 (US$ Bn)
TABLE 113 Rest of Middle East and Africa Portable Generators Market, by Power Rating, 2016-2028 (US$ Bn)
TABLE 114 Rest of Middle East and Africa Portable Generators Market, by End User, 2016-2028 (US$ Bn)

Frequently Asked Questions

How has COVID-19 impacted the global portable generators market?

The portable generators market also suffered from the COVID-19 pandemic, which resulted in a decline of over 3.1% in revenue generated in 2020.

Which is the leading market for portable generators?

The Asia Pacific accounted for the highest share in the global portable generators market regarding value and volume.

What are the key drivers for the growth of the portable generator market?

The key factors driving market growth are power outages, increasing urbanization and industrialization, and technological advancement.

Which is the major segment in the portable generators market by fuel?

Gasoline (Petrol) had a major share in 2021, with more than 52% of the market revenue share. Besides, the natural gas tablet is projected to witness the fastest growth.

Which is the major segment in the portable generators market by applications?

Emergency had a major share in the global market in 2021 and is projected to continue its dominance over the forecast period.

Electrical Computer-Aided Design (ECAD) Market

Published:
Report ID: 36638

Fiber Optics Market

Published:
Report ID: 36367

Field Programmable Gate Array (FPGA) Market

Published:
Report ID: 36359

Electronic Contract Manufacturing and Design Services Market

Published:
Report ID: 36355

Battery Energy Storage System Market

Published:
Report ID: 36352

Laptop Market

Published:
Report ID: 36318

Fiber Optic Preform Market

Published:
Report ID: 36286

Commercial Display Market

Published:
Report ID: 36262

Vibration Control System Market

Published:
Report ID: 36259

Semiconductor Memory Market

Published:
Report ID: 36250

North America Industrial Valve Market

Published:
Report ID: 36223

Flip Chip Market

Published:
Report ID: 36203

Purchase Options

$2999
Delivery Format: Excel.
$4999
Designed for the individual purchaser.
$6999
Users located at a single corporate site or regional office.
$7999
Allowed for unlimited sharing globally within one company.
Smallform of Sample request

Have a question?

User Profile

Don’t settle for less – trust Mitul to help you find the best solution.

Report delivery within 24 to 48 hours

– Other Info –

What people say?-

User Review

I am very impressed with the information in this report. The author clearly did their research when they came up with this product and it has already given me a lot of ideas.

Jana Schmidt
CEDAR CX Technologies

– Connect with us –

Phone

+91 6232 49 3207


support

24/7 Research Support


sales@credenceresearch.com

– Research Methodology –

Going beyond the basics: advanced techniques in research methodology

– Trusted By –

Pepshi, LG, Nestle
Motorola, Honeywell, Johnson and johnson
LG Chem, SIEMENS, Pfizer
Unilever, Samsonite, QIAGEN