CHAPTER NO. 1 : GENESIS OF THE MARKET
1.1 Market Prelude – Introduction & Scope
1.2 The Big Picture – Objectives & Vision
1.3 Strategic Edge – Unique Value Proposition
1.4 Stakeholder Compass – Key Beneficiaries
CHAPTER NO. 2 : EXECUTIVE LENS
2.1 Pulse of the Industry – Market Snapshot
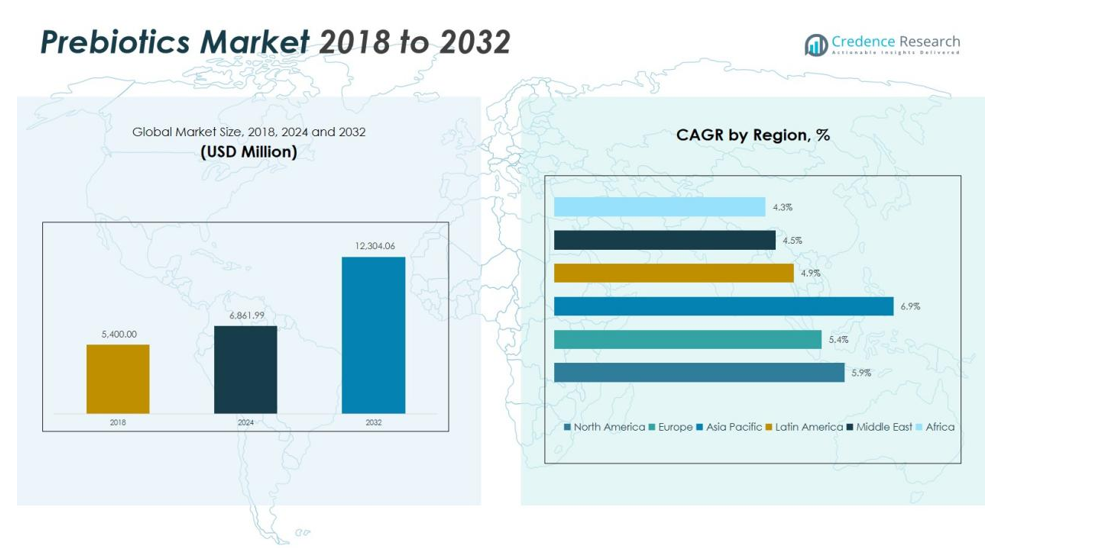
2.2 Growth Arc – Revenue Projections (USD Million)
2.3. Premium Insights – Based on Primary Interviews
CHAPTER NO. 3 : PREBIOTICS MARKET FORCES & INDUSTRY PULSE
3.1 Foundations of Change – Market Overview
3.2 Catalysts of Expansion – Key Market Drivers
3.2.1 Momentum Boosters – Growth Triggers
3.2.2 Innovation Fuel – Disruptive Technologies
3.3 Headwinds & Crosswinds – Market Restraints
3.3.1 Regulatory Tides – Compliance Challenges
3.3.2 Economic Frictions – Inflationary Pressures
3.4 Untapped Horizons – Growth Potential & Opportunities
3.5 Strategic Navigation – Industry Frameworks
3.5.1 Market Equilibrium – Porter’s Five Forces
3.5.2 Ecosystem Dynamics – Value Chain Analysis
3.5.3 Macro Forces – PESTEL Breakdown
3.6 Price Trend Analysis
3.6.1 Regional Price Trend
3.6.2 Price Trend by product
CHAPTER NO. 4 : KEY INVESTMENT EPICENTER
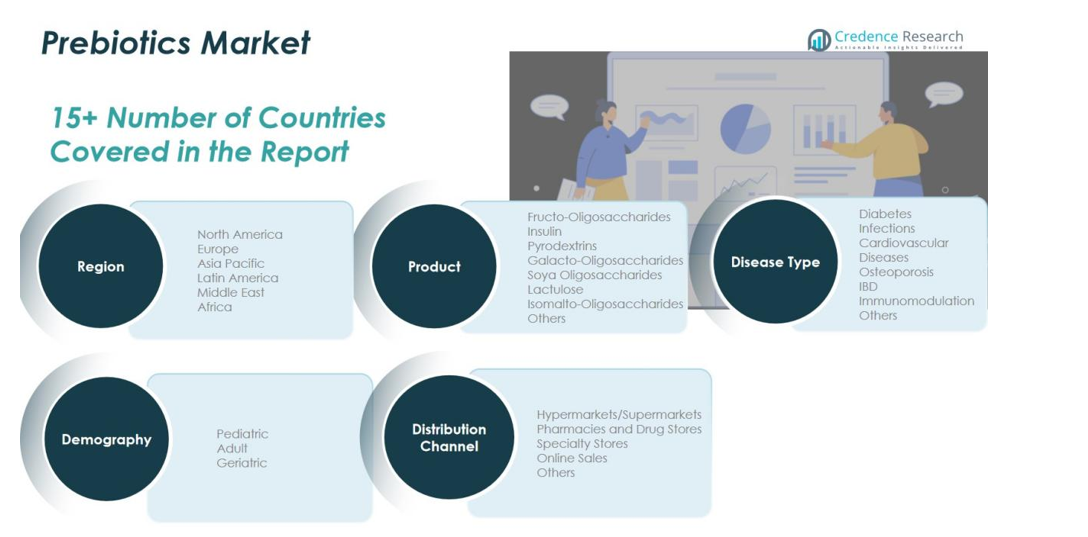
4.1 Regional Goldmines – High-Growth Geographies
4.2 Product Frontiers – Lucrative Product Categories
4.3 Disease Type Sweet Spots – Emerging Demand Segments
CHAPTER NO. 5: REVENUE TRAJECTORY & WEALTH MAPPING
5.1 Momentum Metrics – Forecast & Growth Curves
5.2 Regional Revenue Footprint – Market Share Insights
5.3 Segmental Wealth Flow – Product & Disease Type Revenue
CHAPTER NO. 6 : TRADE & COMMERCE ANALYSIS
6.1. Import Analysis by Region
6.1.1. Global Prebiotics Market Import Revenue By Region
6.2. Export Analysis by Region
6.2.1. Global Prebiotics Market Export Revenue By Region
CHAPTER NO. 7 : COMPETITION ANALYSIS
7.1. Company Market Share Analysis
7.1.1. Global Prebiotics Market: Company Market Share
7.2. Global Prebiotics Market Company Revenue Market Share
7.3. Strategic Developments
7.3.1. Acquisitions & Mergers
7.3.2. New Product Launch
7.3.3. Regional Expansion
7.4. Competitive Dashboard
7.5. Company Assessment Metrics, 2024
CHAPTER NO. 8 : PREBIOTICS MARKET – BY PRODUCT SEGMENT ANALYSIS
8.1. Prebiotics Market Overview by Product Segment
8.1.1. Prebiotics Market Revenue Share By Product
8.2. Fructo-Oligosaccharides
8.3. Insulin
8.4. Pyrodextrins
8.5. Galacto-Oligosaccharides
8.6. Soya Oligosaccharides
8.7. Lactulose
8.8. Isomalto-Oligosaccharides
8.9. Others
CHAPTER NO. 9 : PREBIOTICS MARKET – BY DISEASE TYPE SEGMENT ANALYSIS
9.1. Prebiotics Market Overview by Disease Type Segment
9.1.1. Prebiotics Market Revenue Share By Disease Type
9.2. Diabetes
9.3. Infections
9.4. Cardiovascular Diseases
9.5. Osteoporosis
9.6. IBD
9.7. Immunomodulation
9.8 Others
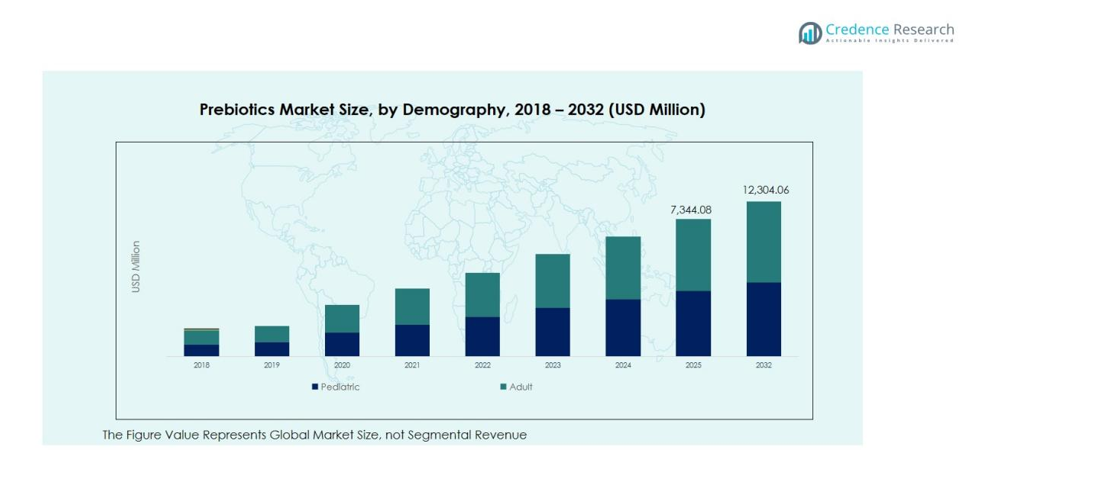
CHAPTER NO. 10 : PREBIOTICS MARKET – BY DEMOGRAPHY SEGMENT ANALYSIS
10.1. Prebiotics Market Overview by Demography Segment
10.1.1. Prebiotics Market Revenue Share By Demography
10.2. Pediatric
10.3. Adult
10.4. Geriatric
CHAPTER NO. 11 : PREBIOTICS MARKET – BY DISTRIBUTION CHANNEL SEGMENT ANALYSIS
11.1. Prebiotics Market Overview by Distribution Channel Segment
11.1.1. Prebiotics Market Revenue Share By Distribution Channel
11.2. Hypermarkets/Supermarkets
11.3. Pharmacies and Drug Stores
11.4. Specialty Stores
11.5. Online Sales
11.6. Others
CHAPTER NO. 12 : PREBIOTICS MARKET – REGIONAL ANALYSIS
12.1. Prebiotics Market Overview by Region Segment
12.1.1. Global Prebiotics Market Revenue Share By Region
12.1.2. Regions
12.1.3. Global Prebiotics Market Revenue By Region
12.1.4. Product
12.1.5. Global Prebiotics Market Revenue By Product
12.1.6. Disease Type
12.1.7. Global Prebiotics Market Revenue By Disease Type
12.1.8. Demography
12.1.9. Global Prebiotics Market Revenue By Demography
12.1.10. Distribution Channel
12.1.11. Global Prebiotics Market Revenue By Distribution Channel
CHAPTER NO. 13 : NORTH AMERICA PREBIOTICS MARKET – COUNTRY ANALYSIS
13.1. North America Prebiotics Market Overview by Country Segment
13.1.1. North America Prebiotics Market Revenue Share By Regi
13.2. North America
13.2.1. North America Prebiotics Market Revenue By Country
13.2.2. Product
13.2.3. North America Prebiotics Market Revenue By Product
13.2.4. Disease Type
13.2.5. North America Prebiotics Market Revenue By Disease Type
13.2.6. Demography
13.2.7. North America Prebiotics Market Revenue By Demography
13.2.8. Distribution Channel
13.2.9. North America Prebiotics Market Revenue By Distribution Channel
13.3. U.S.
13.4. Canada
13.5. Mexico
CHAPTER NO. 14 : EUROPE PREBIOTICS MARKET – COUNTRY ANALYSIS
14.1. Europe Prebiotics Market Overview by Country Segment
14.1.1. Europe Prebiotics Market Revenue Share By Region
14.2. Europe
14.2.1. Europe Prebiotics Market Revenue By Country
14.2.2. Product
14.2.3. Europe Prebiotics Market Revenue By Product
14.2.4. Disease Type
14.2.5. Europe Prebiotics Market Revenue By Disease Type
14.2.6. Demography
14.2.7. Europe Prebiotics Market Revenue By Demography
14.2.8. Distribution Channel
14.2.9. Europe Prebiotics Market Revenue By Distribution Channel
14.3. UK
14.4. France
14.5. Germany
14.6. Italy
14.7. Spain
14.8. Russia
14.9. Rest of Europe
CHAPTER NO. 15 : ASIA PACIFIC PREBIOTICS MARKET – COUNTRY ANALYSIS
15.1. Asia Pacific Prebiotics Market Overview by Country Segment
15.1.1. Asia Pacific Prebiotics Market Revenue Share By Region
15.2. Asia Pacific
15.2.1. Asia Pacific Prebiotics Market Revenue By Country
15.2.2. Product
15.2.3. Asia Pacific Prebiotics Market Revenue By Product
15.2.4. Disease Type
15.2.5. Asia Pacific Prebiotics Market Revenue By Industry Vertica
15.2.6. Demography
15.2.7. Asia Pacific Prebiotics Market Revenue By Demography
15.2.8. Distribution Channel
15.2.9. Asia Pacific Prebiotics Market Revenue By Distribution Channel
15.3. China
15.4. Japan
15.5. South Korea
15.6. India
15.7. Australia
15.8. Southeast Asia
15.9. Rest of Asia Pacific
CHAPTER NO. 16 : LATIN AMERICA PREBIOTICS MARKET – COUNTRY ANALYSIS
16.1. Latin America Prebiotics Market Overview by Country Segment
16.1.1. Latin America Prebiotics Market Revenue Share By Region
16.2. Latin America
16.2.1. Latin America Prebiotics Market Revenue By Country
16.2.2. Product
16.2.3. Latin America Prebiotics Market Revenue By Product
16.2.4. Disease Type
16.2.5. Latin America Prebiotics Market Revenue By Disease Type
16.2.6. Demography
16.2.7. Latin America Prebiotics Market Revenue By Demography
16.2.8. Distribution Channel
16.2.9. Latin America Prebiotics Market Revenue By Distribution Channel
16.3. Brazil
16.4. Argentina
16.5. Rest of Latin America
CHAPTER NO. 17 : MIDDLE EAST PREBIOTICS MARKET – COUNTRY ANALYSIS
17.1. Middle East Prebiotics Market Overview by Country Segment
17.1.1. Middle East Prebiotics Market Revenue Share By Region
17.2. Middle East
17.2.1. Middle East Prebiotics Market Revenue By Country
17.2.2. Product
17.2.3. Middle East Prebiotics Market Revenue By Product
17.2.4. Disease Type
17.2.5. Middle East Prebiotics Market Revenue By Disease Type
17.2.6. Demography
17.2.7. Middle East Prebiotics Market Revenue By Demography
17.2.8. Distribution Channel
17.2.9. Middle East Prebiotics Market Revenue By Distribution Channel
17.3. GCC Countries
17.4. Israel
17.5. Turkey
17.6. Rest of Middle East
CHAPTER NO. 18 : AFRICA PREBIOTICS MARKET – COUNTRY ANALYSIS
18.1. Africa Prebiotics Market Overview by Country Segment
18.1.1. Africa Prebiotics Market Revenue Share By Region
18.2. Africa
18.2.1. Africa Prebiotics Market Revenue By Country
18.2.2. Product
18.2.3. Africa Prebiotics Market Revenue By Product
18.2.4. Disease Type
18.2.5. Africa Prebiotics Market Revenue By Disease Type
18.2.6. Demography
18.2.7. Africa Prebiotics Market Revenue By Demography
18.2.8. Distribution Channel
18.2.9. Africa Prebiotics Market Revenue By Distribution Channel
18.3. South Africa
18.4. Egypt
18.5. Rest of Africa
CHAPTER NO. 19 : COMPANY PROFILES
19.1. Abbott Laboratories
19.1.1. Company Overview
19.1.2. Product Portfolio
19.1.3. Financial Overview
19.1.4. Recent Developments
19.1.5. Growth Strategy
19.1.6. SWOT Analysis
19.2. Archer Daniels Midland Company
19.3. BASF SE
19.4. Beghin Meiji
19.5. BENEO GmbH
19.6. Biopolis Life Sciences Private Limited
19.7. ciranda, Inc.
19.8. Clasado Limited
19.9. Cosucra Groupe Warcoing SA
19.10. DuPont de Nemours, Inc.
19.11 Galam Group
19.12. Ingredion Incorporated
19.13. Kerry Group
19.14. Nestlé S.A.
19.15. Parmalat S.p.A.
19.16. Roquette Frères
19.17. Sensus B.V.
19.18. Tereos Group
19.19. The Kraft Heinz Company
19.20. Yakult Honsha Co. Ltd.