Market Overview
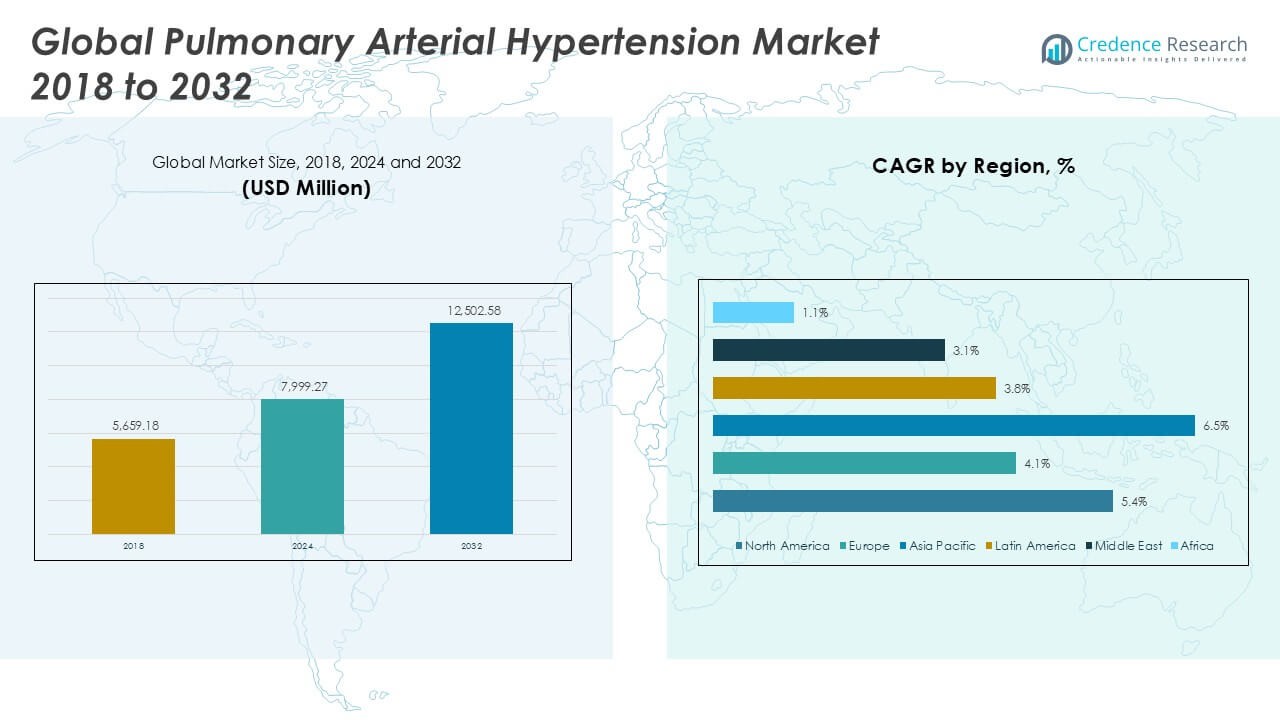
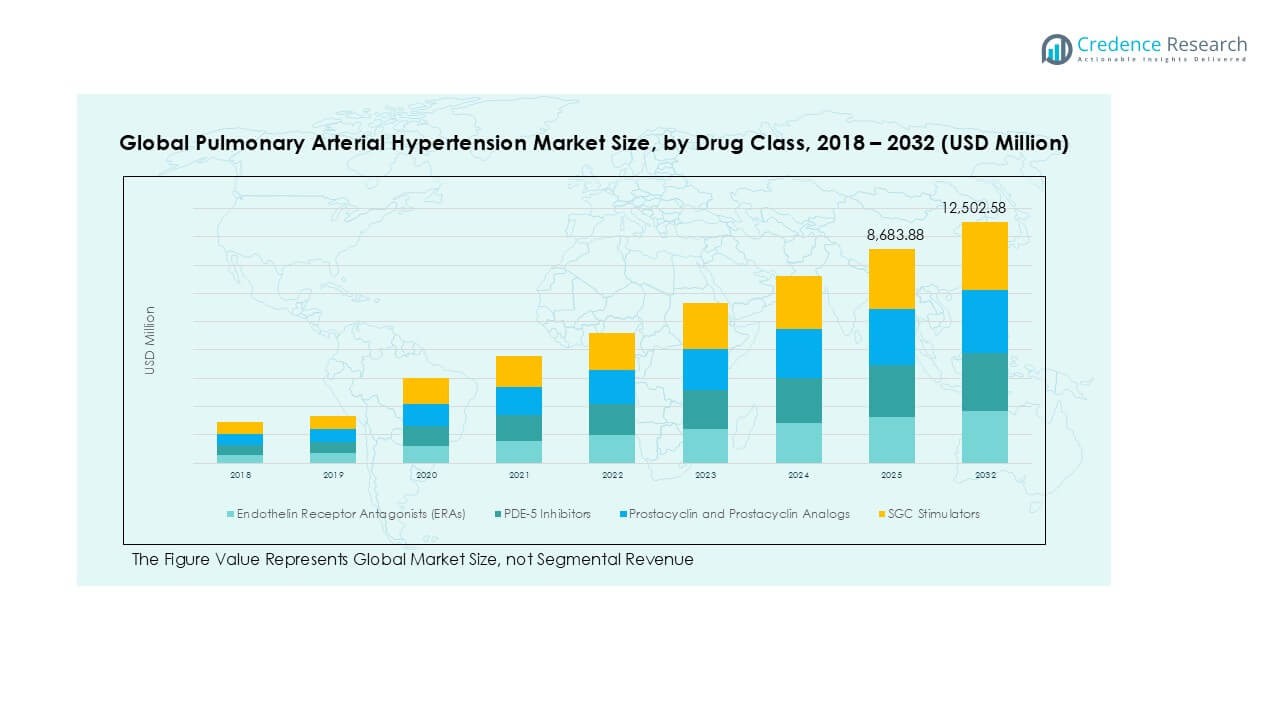
The Pulmonary Arterial Hypertension market size was valued at USD 5,659.18 million in 2018, increased to USD 7,999.27 million in 2024, and is anticipated to reach USD 12,502.58 million by 2032, at a CAGR of 5.34% during the forecast period.
| REPORT ATTRIBUTE |
DETAILS |
| Historical Period |
2020-2024 |
| Base Year |
2024 |
| Forecast Period |
2025-2032 |
| Pulmonary Arterial Hypertension Market Size 2024 |
USD 7,999.27 Million |
| Pulmonary Arterial Hypertension Market, CAGR |
5.34% |
| Pulmonary Arterial Hypertension Market Size 2032 |
USD 12,502.58 Million |
The Pulmonary Arterial Hypertension (PAH) market is led by key players such as Gilead Sciences, Johnson & Johnson, United Therapeutics Corporation, Bayer, and GlaxoSmithKline, each contributing significantly through innovative drug development and strong global distribution networks. These companies dominate due to their extensive product portfolios, strategic collaborations, and consistent investment in research and development. North America stands as the leading region in the PAH market, accounting for approximately 43.2% of the global share in 2024. This dominance is driven by advanced healthcare infrastructure, early diagnosis rates, and high adoption of combination therapies. Europe and Asia Pacific follow, supported by favorable regulatory frameworks and expanding treatment access.
Access crucial information at unmatched prices!
Request your sample report today & start making informed decisions powered by Credence Research Inc.!
Download Sample
Market Insights
- The Pulmonary Arterial Hypertension (PAH) market was valued at USD 5,659.18 million in 2018, reached USD 7,999.27 million in 2024, and is projected to grow to USD 12,502.58 million by 2032, at a CAGR of 5.34% during the forecast period.
- Market growth is driven by the rising prevalence of PAH, increasing awareness, and advancements in targeted drug therapies, particularly Endothelin Receptor Antagonists, which held the largest segment share in 2024.
- A key trend is the growing preference for combination therapies and oral formulations that enhance patient compliance and treatment outcomes across all disease stages.
- The competitive landscape is shaped by major players such as Gilead Sciences, Johnson & Johnson, United Therapeutics, and Bayer, focusing on innovation, pipeline development, and strategic collaborations.
- North America dominated the market with a 43.2% share in 2024, followed by Asia Pacific at 30.7%, driven by healthcare infrastructure and rising diagnosis rates, respectively.
Market Segmentation Analysis:
By Drug Class
Endothelin Receptor Antagonists (ERAs) held the largest market share in the Pulmonary Arterial Hypertension (PAH) market in 2024, driven by their established efficacy in reducing pulmonary vascular resistance and improving exercise capacity. These agents, including bosentan and ambrisentan, remain the cornerstone of PAH treatment due to their long-term safety profiles and broad physician acceptance. PDE-5 inhibitors also witnessed significant adoption owing to their cost-effectiveness and oral availability. However, the Prostacyclin and Prostacyclin Analogs segment is rapidly expanding, supported by advancements in infusion technologies and improved patient outcomes in advanced PAH stages. SGC stimulators are gaining momentum in combination therapies, enhancing vasodilation response.
- For instance, United Therapeutics has demonstrated consistent growth in prostacyclin analog delivery with over 6,000 patients using its Remodulin® (treprostinil) therapy via subcutaneous or intravenous infusion as of 2023.
By Type:
Branded drugs dominate the PAH market, accounting for the majority of revenue in 2024, supported by the continued preference for patented formulations with proven clinical efficacy and the absence of widespread generic substitutes for complex molecules. High development costs, regulatory exclusivity, and innovative delivery mechanisms have sustained branded drug demand. Generics are gradually gaining traction, especially in emerging markets, due to increasing cost-containment initiatives by healthcare providers and payers. However, their growth remains limited in developed regions where physicians often prioritize treatment continuity and established branded therapies for optimal disease management.
- For instance, Johnson & Johnson’s Janssen division reported over 12,000 prescriptions in the U.S. for its branded therapy Opsumit® (macitentan) in 2023, reflecting strong physician loyalty to branded options.
By Route of Administration:
Oral administration emerged as the leading route in 2024, holding the highest market share due to improved patient compliance, ease of use, and the availability of multiple first-line oral therapies such as ERAs and PDE-5 inhibitors. This route is particularly favored in early-stage PAH treatment. Intravenous and subcutaneous routes remain essential for severe cases requiring prostacyclin therapies, despite their complexity and need for specialized care. The inhalational route, although niche, is expanding with the development of targeted pulmonary delivery systems aimed at minimizing systemic side effects while enhancing localized vasodilation efficacy.
Key Growth Drivers
Rising Prevalence of Pulmonary Arterial Hypertension
The global increase in the incidence of pulmonary arterial hypertension (PAH), particularly among women and the elderly, significantly drives market growth. Contributing factors include genetic predisposition, connective tissue disorders, and lifestyle-related conditions such as obesity and smoking. Enhanced disease awareness and improved diagnostic capabilities have also led to earlier identification and treatment of PAH. As the patient population expands, healthcare systems are prioritizing PAH management, creating a favorable environment for pharmaceutical advancements and broadening the market’s revenue potential.
- For instance, Bayer’s PHusion clinical research program enrolled over 1,400 patients globally by 2023 to track PAH prevalence patterns and identify patient subsets for early therapeutic intervention.
Advancements in Targeted Therapies
Continuous innovation in targeted drug therapies is a key driver for the PAH market. The development of new drug classes, combination regimens, and novel delivery methods have improved treatment efficacy and patient outcomes. Agents such as SGC stimulators and next-generation prostacyclin analogs offer tailored approaches for different disease stages. These advancements support personalized treatment protocols, increase therapeutic adherence, and reduce hospitalization rates. With ongoing clinical trials and regulatory approvals, pharmaceutical companies are reinforcing the therapeutic landscape, attracting investment and expanding global market reach.
- For instance, Merck’s VERQUVO® (vericiguat), an SGC stimulator, was evaluated in over 5,050 patients during the VICTORIA trial, which provided valuable data on targeted vasodilator mechanisms relevant to PAH.
Government and Institutional Support
Supportive government policies and increasing healthcare investments contribute significantly to PAH market expansion. Initiatives focused on rare disease management, drug pricing reforms, and reimbursement policies have enhanced patient access to costly therapies. In addition, orphan drug designations by regulatory bodies provide market exclusivity and incentives for manufacturers. Research grants and public-private partnerships are fostering drug development pipelines. These institutional efforts are instrumental in encouraging innovation while reducing financial barriers for patients, thereby propelling sustained market growth.
Key Trends & Opportunities
Shift Toward Combination Therapies
A notable trend in the PAH market is the growing adoption of combination therapies, which improve hemodynamic parameters and slow disease progression more effectively than monotherapy. Physicians increasingly recommend dual or triple drug regimens involving ERAs, PDE-5 inhibitors, and prostacyclins for patients with moderate to severe symptoms. This trend has spurred pharmaceutical companies to invest in fixed-dose combination products that enhance convenience and adherence. The shift presents opportunities for innovation in formulation science and strategic collaborations, shaping the future of PAH treatment protocols.
- For instance, Gilead Sciences conducted a real-world study with over 3,200 PAH patients to evaluate outcomes from triple therapy involving Letairis® (ambrisentan), Adcirca® (tadalafil), and Veletri® (epoprostenol), demonstrating enhanced efficacy metrics.
Emerging Markets and Untapped Patient Pools
Emerging economies in Asia Pacific, Latin America, and the Middle East present substantial opportunities for PAH market growth. These regions are witnessing rising healthcare infrastructure investments and increasing disease awareness. While access to advanced treatments remains limited, policy reforms and global health initiatives are improving affordability and diagnosis. Pharmaceutical companies are expanding their footprint in these areas through partnerships, patient assistance programs, and localized manufacturing. Unlocking these untapped patient pools could generate significant revenue streams and strengthen global market presence.
- For instance, Lupin Pharmaceuticals launched a dedicated PAH therapy access program across 85 Indian cities in 2023, enrolling over 7,800 patients within its first year.
Key Challenges
High Treatment Costs and Limited Affordability
The high cost of PAH therapies remains a significant barrier, particularly in low- and middle-income regions. Most advanced drugs are expensive due to the complexity of their development, orphan drug status, and extended treatment durations. Even in developed markets, out-of-pocket expenses and insurance limitations can hinder patient adherence. This financial burden restricts access to optimal care, underscoring the need for pricing reforms, broader insurance coverage, and increased availability of cost-effective generic alternatives to improve affordability.
Delayed Diagnosis and Disease Awareness Gaps
PAH often presents with non-specific symptoms such as fatigue and shortness of breath, leading to misdiagnosis or delayed detection. Many patients are diagnosed at an advanced stage, which limits treatment efficacy and increases mortality risk. The lack of awareness among primary care providers and the general population contributes to these delays. Strengthening education and training for healthcare professionals, along with targeted awareness campaigns, is essential to facilitate early diagnosis and timely intervention.
Regulatory Hurdles and Clinical Development Challenges
Bringing new PAH treatments to market involves navigating complex regulatory frameworks and stringent clinical trial requirements. Due to the rarity and heterogeneity of the disease, recruiting sufficient trial participants is difficult, prolonging study timelines and increasing costs. Moreover, regulatory bodies demand robust evidence of efficacy and long-term safety, particularly for combination regimens. These challenges slow innovation and increase the risk for pharmaceutical companies, making it harder to sustain a steady pipeline of new therapies.
Regional Analysis
North America
North America dominated the global Pulmonary Arterial Hypertension (PAH) market in 2024, accounting for the largest regional share of approximately 43.2%, with a market value rising from USD 2,469.33 million in 2018 to USD 3,454.13 million in 2024, and projected to reach USD 5,413.68 million by 2032 at a CAGR of 5.4%. The region benefits from a highly developed healthcare infrastructure, early diagnosis, and strong adoption of advanced therapies. Supportive reimbursement policies and continuous drug innovations further support growth. The presence of key pharmaceutical players also contributes to sustained leadership in the global PAH market.
Europe
Europe held a market share of around 17.4% in the global PAH market in 2024, with market size increasing from USD 1,042.59 million in 2018 to USD 1,391.89 million in 2024, and expected to reach USD 1,975.44 million by 2032, growing at a CAGR of 4.1%. Growth in this region is driven by rising awareness of rare diseases, the availability of specialized treatment centers, and favorable regulatory initiatives for orphan drug development. However, budgetary constraints in some countries and pricing pressures slightly temper the growth compared to North America and Asia Pacific.
Asia Pacific
Asia Pacific is emerging as the fastest-growing region in the PAH market, registering a CAGR of 6.5% and expanding from USD 1,648.15 million in 2018 to USD 2,458.73 million in 2024, with projections reaching USD 4,188.48 million by 2032. The region held a 30.7% share of the global market in 2024. Growth is fueled by improving healthcare access, rising disease awareness, and expanding diagnostic capabilities across countries like China, India, and Japan. Increased government investments and the entry of global pharmaceutical companies through strategic collaborations further bolster market expansion in the region.
Latin America
Latin America accounted for approximately 4.8% of the global PAH market in 2024, with the market size growing from USD 278.00 million in 2018 to USD 388.25 million in 2024, and forecast to reach USD 539.81 million by 2032 at a CAGR of 3.8%. The region’s growth is supported by rising healthcare expenditure, increasing urbanization, and improving diagnosis of cardiovascular and pulmonary diseases. However, limited access to advanced therapies and uneven healthcare infrastructure across countries such as Brazil, Argentina, and Mexico present moderate challenges to achieving higher growth rates.
Middle East
The Middle East represented 2.6% of the global PAH market in 2024, with its size increasing from USD 159.15 million in 2018 to USD 205.71 million in 2024, and projected to reach USD 271.51 million by 2032, growing at a CAGR of 3.1%. The market growth is driven by gradual improvements in healthcare services, increased awareness of rare diseases, and rising government initiatives in specialized treatment access. However, political instability and disparities in healthcare accessibility across the region limit the speed of market expansion, particularly in lower-income countries.
Africa
Africa held the smallest share of the global PAH market in 2024, accounting for just 1.3%, with the market size rising from USD 61.97 million in 2018 to USD 100.56 million in 2024, and anticipated to reach USD 113.66 million by 2032 at a CAGR of 1.1%. Limited access to healthcare infrastructure, lack of disease awareness, and minimal availability of advanced PAH therapies hinder growth in the region. However, international health initiatives and investment in healthcare capacity-building offer modest opportunities for market development over the forecast period.
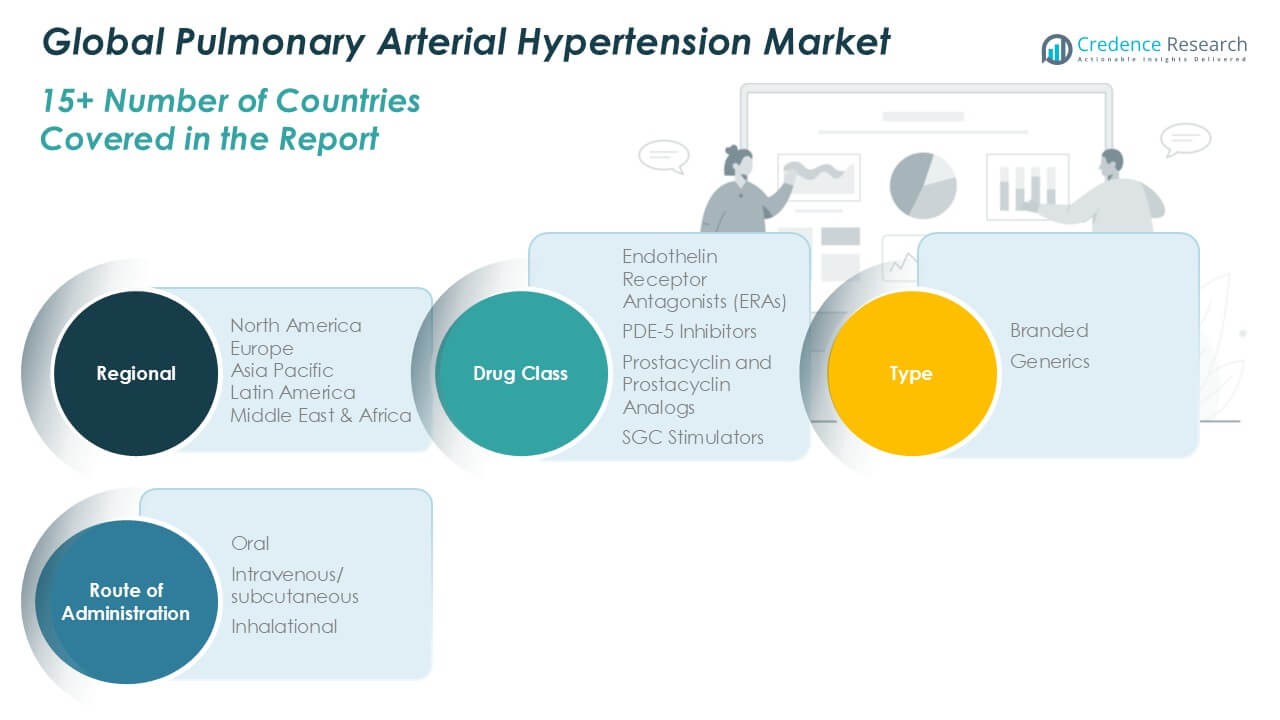
Market Segmentations:
By Drug Class:
- Endothelin Receptor Antagonists (ERAs)
- PDE-5 Inhibitors
- Prostacyclin and Prostacyclin Analogs
- SGC Stimulators
By Type:
By Route of Administration:
- Oral
- Intravenous/Subcutaneous
- Inhalational
By Geography
- North America
- Europe
- Germany
- France
- U.K.
- Italy
- Spain
- Rest of Europe
- Asia Pacific
- China
- Japan
- India
- South Korea
- South-east Asia
- Rest of Asia Pacific
- Latin America
- Brazil
- Argentina
- Rest of Latin America
- Middle East & Africa
- GCC Countries
- South Africa
- Rest of the Middle East and Africa
Competitive Landscape
The competitive landscape of the Pulmonary Arterial Hypertension (PAH) market is characterized by the presence of several major pharmaceutical players actively investing in product innovation, strategic partnerships, and market expansion to strengthen their position. Companies such as Gilead Sciences, Johnson & Johnson, United Therapeutics, and Bayer dominate the market through robust product portfolios and ongoing research in targeted therapies. These firms are focused on expanding indications for existing drugs, developing combination therapies, and enhancing drug delivery technologies to improve treatment efficacy and patient adherence. Additionally, emerging players and generic manufacturers like Viatris, Lupin, and Sandoz are intensifying competition by offering cost-effective alternatives, particularly in price-sensitive markets. Mergers, acquisitions, and licensing agreements remain key strategies for gaining access to new markets and accelerating clinical pipelines. As the demand for effective PAH treatments rises, the competitive dynamics continue to shift, fostering innovation while emphasizing affordability and global reach.
Shape Your Report to Specific Countries or Regions & Enjoy 30% Off!
Key Player Analysis
- Gilead Sciences, Inc.
- Johnson & Johnson
- Viatris Inc.
- United Therapeutics Corporation
- Bayer
- GlaxoSmithKline
- Sandoz Inc.
- Lupin Pharmaceuticals, Inc.
- Sun Pharmaceutical Industries, Inc.
- Teva Pharmaceutical Industries Ltd.
Recent Developments
- In January 2025, United Therapeutics Corporation a public benefit corporation, reported that five posters from its commercial and development pipeline in pulmonary hypertension (PH) will be presented at the Pulmonary Vascular Research Institute (PVRI) 2025 Annual Congress, which is set to be held from January 29, 2025 to February 1, 2025, in Rio de Janeiro.
- In March 2024, Johnson & Johnson announced that the U.S. Food and Drug Administration (FDA) has approved OPSYNVI, a single-tablet combination of macitentan (an endothelin receptor antagonist, ERA) and tadalafil (a phosphodiesterase 5, PDE5, inhibitor). OPSYNVI is approved for the chronic treatment of adults with pulmonary arterial hypertension (PAH) that falls under World Health Organization (WHO) Group I and WHO functional class (FC) II-III.
- In August 2023, Keros Therapeutics held a conference to present positive results for its KER-012 phase 2 clinical trial which is being conducted for investigating efficacy of the drug for treatment of pulmonary arterial hypertension.
- In May 2023, Janssen Pharmaceutical Companies submitted new drug application to FDA for approval for its combination therapy of tadalafil 40mg and macitentan 10mg for the treatment of pulmonary arterial hypertension.
- In April 2023, Mochida Pharmaceutical Co., Ltd. announced launch of its Treprost inhalation solution for the treatment of pulmonary arterial hypertension. The company introduced drug in Japan market.
Market Concentration & Characteristics
The Pulmonary Arterial Hypertension Market exhibits a moderately concentrated structure, with a handful of global pharmaceutical companies holding a significant share. Key players such as Gilead Sciences, United Therapeutics, Johnson & Johnson, and Bayer maintain dominance through strong patent portfolios, established brand presence, and strategic collaborations. It reflects characteristics of a specialty pharmaceutical market, with high entry barriers due to complex drug development, regulatory requirements, and the rarity of the disease. Innovation remains central, as companies invest heavily in R&D to enhance treatment efficacy, improve patient outcomes, and address unmet medical needs. Market dynamics are shaped by branded drug dominance, particularly in developed regions, while generics are slowly expanding in cost-sensitive markets. The market sees a clear trend toward oral therapies and combination regimens, which drive demand for convenience and better adherence. Strong regulatory support for orphan drugs and focused healthcare policies contribute to sustained growth, while limited patient pools and high treatment costs keep competition targeted and strategic.
Report Coverage
The research report offers an in-depth analysis based on Drug Class, Type, Route of Administration and Geography. It details leading market players, providing an overview of their business, product offerings, investments, revenue streams, and key applications. Additionally, the report includes insights into the competitive environment, SWOT analysis, current market trends, as well as the primary drivers and constraints. Furthermore, it discusses various factors that have driven market expansion in recent years. The report also explores market dynamics, regulatory scenarios, and technological advancements that are shaping the industry. It assesses the impact of external factors and global economic changes on market growth. Lastly, it provides strategic recommendations for new entrants and established companies to navigate the complexities of the market.
Future Outlook
- The Pulmonary Arterial Hypertension market is expected to grow steadily driven by increased disease awareness and early diagnosis initiatives.
- The adoption of combination therapies will continue to rise as they demonstrate improved clinical outcomes in moderate to severe PAH cases.
- Oral drugs will remain the preferred mode of administration due to enhanced patient compliance and convenience.
- Pharmaceutical companies will invest more in the development of novel targeted therapies with improved safety and efficacy profiles.
- Emerging markets in Asia Pacific and Latin America will offer significant growth opportunities due to improving healthcare infrastructure.
- Strategic collaborations, mergers, and acquisitions will play a key role in expanding treatment portfolios and market access.
- Generic drug penetration is expected to increase in cost-sensitive regions, especially following patent expirations of key therapies.
- Regulatory incentives for orphan drug development will continue to support innovation and new treatment approvals.
- Increased investment in precision medicine and biomarker-based therapies will shape future treatment strategies.
- Digital health tools and telemedicine may enhance disease monitoring and treatment adherence in PAH patients.


