Market Overview:
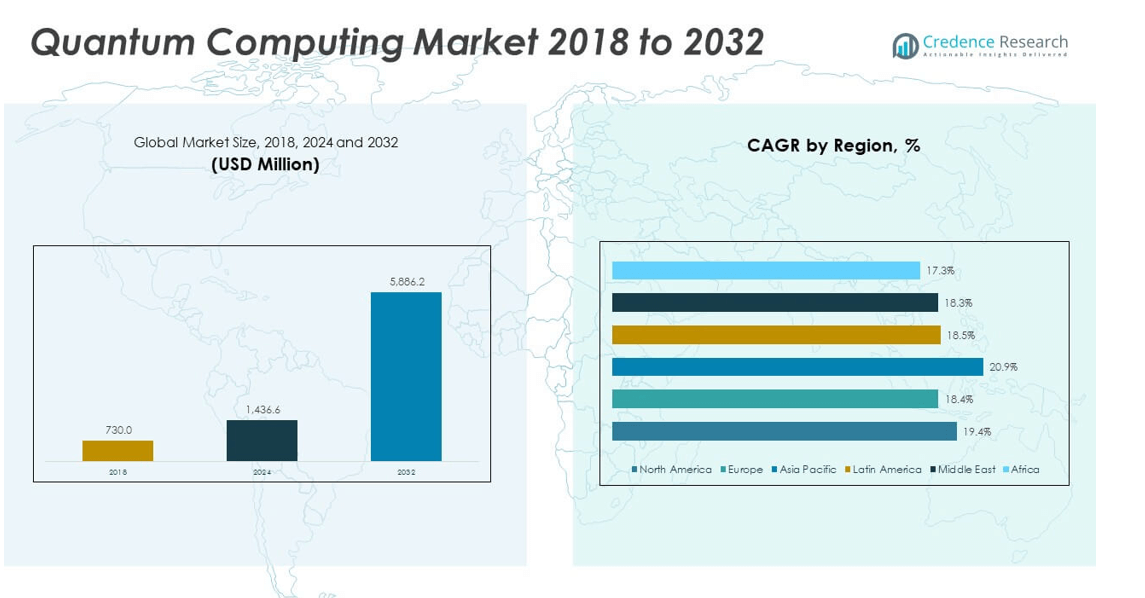
The Global Quantum Computing Market size was valued at USD 730.0 million in 2018 to USD 1,436.6 million in 2024 and is anticipated to reach USD 5,886.2 million by 2032, at a CAGR of 19.40% during the forecast period.
| REPORT ATTRIBUTE |
DETAILS |
| Historical Period |
2020-2023 |
| Base Year |
2024 |
| Forecast Period |
2025-2032 |
| Quantum Computing Market Size 2024 |
USD 1,436.6 million |
| Quantum Computing Market, CAGR |
19.40% |
| Quantum Computing Market Size 2032 |
USD 5,886.2 million |
The market growth is driven by rapid advancements in quantum hardware, software, and algorithms, supported by increased investments from governments and private enterprises. Rising demand for high-performance computing in sectors such as finance, healthcare, logistics, and cybersecurity is propelling adoption. The technology’s ability to process complex datasets at unprecedented speeds enables breakthroughs in optimization, molecular modeling, and cryptography. Collaborations between technology providers, research institutes, and industrial players are accelerating commercialization and expanding practical applications.
Regionally, North America leads due to strong R&D funding, the presence of key quantum technology companies, and active government initiatives. Europe follows closely with significant investments in research programs and industrial adoption. The Asia-Pacific region is emerging as a major growth hub, fueled by expanding tech ecosystems in China, Japan, and South Korea, alongside government-backed quantum computing initiatives. This regional diversity is fostering global competition and driving innovation in the market.
Market Insights:
- The Global Quantum Computing Market was valued at USD 730.0 million in 2018, reached USD 1,436.6 million in 2024, and is projected to hit USD 5,886.2 million by 2032, growing at a CAGR of 19.40%.
- Advancements in quantum hardware, algorithms, and error correction are accelerating adoption across multiple industries.
- Rising demand for high-performance computing in finance, healthcare, logistics, and material science is driving market growth.
- High development costs, technical complexities, and scalability challenges are restraining rapid commercialization.
- North America leads the market due to strong R&D funding and the presence of key quantum technology players.
- Europe maintains a significant position with robust research programs and industrial adoption in various sectors.
- Asia-Pacific is emerging as a high-growth region, driven by government-backed initiatives in China, Japan, and South Korea.
Access crucial information at unmatched prices!
Request your sample report today & start making informed decisions powered by Credence Research Inc.!
Download Sample
Market Drivers:
Rapid Technological Advancements Enhancing Computational Capabilities:
The Global Quantum Computing Market is witnessing strong growth due to rapid innovations in quantum hardware, algorithms, and error-correction methods. Technology providers are introducing more stable qubits and scalable architectures, improving computation speed and accuracy. The market benefits from breakthroughs in superconducting circuits, trapped ions, and photonic systems. Continuous improvements in quantum algorithms are enabling faster problem-solving across complex domains. It is driving adoption in industries such as finance, pharmaceuticals, and aerospace. Government-backed quantum initiatives are accelerating progress through funding and infrastructure development. Cloud-based quantum access is making the technology more accessible to businesses. This momentum is positioning quantum computing as a transformative force in high-performance computing.
- For instance, Notably, Fujitsu and RIKEN announced a 256-qubit superconducting quantum computer in April 2025—quadrupling their 2023 system size—and targeting a 1,000-qubit machine by 2026 to tackle complex molecular simulations and advanced error correction.
Growing Demand for High-Performance Computing Across Industries:
The demand for quantum computing solutions is increasing across industries facing complex computational challenges. Financial services firms are leveraging quantum models for risk analysis, fraud detection, and portfolio optimization. In healthcare, it is enabling advanced drug discovery and protein folding simulations. Logistics and supply chain sectors are utilizing quantum systems for route optimization and inventory management. Automotive and aerospace companies are applying quantum capabilities in material science and aerodynamic modeling. Rising cybersecurity threats are driving interest in quantum-resistant encryption. The integration of quantum computing with artificial intelligence is creating powerful hybrid solutions. This cross-industry applicability is a major driver for sustained market expansion.
- For example, IonQ demonstrated a ~12% speed improvement in medical-device simulation on its 36-qubit trapped-ion computer compared to classical high-performance computing platforms in March 2025.
Substantial Public and Private Investments in Quantum Research:
Significant funding from both public and private sectors is fueling the expansion of the Global Quantum Computing Market. Governments in North America, Europe, and Asia-Pacific are launching large-scale national programs to build competitive quantum capabilities. Tech giants and startups are securing multi-million-dollar investments to accelerate product development. Venture capital interest is strong, focusing on scalable architectures and commercial applications. Collaborative research programs are uniting academia, industry, and government agencies. It is leading to faster innovation cycles and accelerated commercialization. Strategic acquisitions are enabling companies to enhance technological portfolios. The funding momentum is ensuring long-term market growth potential.
Expansion of Quantum Computing as a Service (QCaaS) Platforms:
Quantum Computing as a Service (QCaaS) is becoming a significant driver, allowing enterprises to access quantum processing power via cloud platforms. This approach eliminates the need for costly in-house infrastructure. Leading cloud providers are integrating quantum services into their platforms, increasing adoption rates. Businesses can experiment with quantum algorithms without large capital investment. QCaaS models are enabling startups and research institutions to explore new applications. The pay-per-use model offers flexibility and scalability for diverse users. It is also fostering innovation through developer-friendly quantum SDKs and simulation environments. This trend is opening the market to a broader base of users worldwide.
Market Trends:
Integration of Quantum Computing with Artificial Intelligence and Machine Learning:
A prominent trend in the Global Quantum Computing Market is the integration of quantum computing with AI and ML models. Quantum algorithms are accelerating machine learning training and improving pattern recognition accuracy. This synergy is enabling faster processing of massive datasets in sectors such as finance, healthcare, and climate modeling. Companies are developing hybrid quantum-classical solutions to solve problems beyond the reach of traditional systems. It is boosting interest in AI-driven quantum analytics for predictive modeling. The approach is enhancing optimization in industrial automation and energy management. Continuous innovation is expanding the scope of AI-quantum convergence. This trend is shaping the next generation of intelligent computing systems.
- For instance, Quantinuum promotes AI-driven quantum analytics with its trapped-ion architecture, achieving quantum volumes over two million on its 56-qubit Apollo system and 12 logical qubits with “three 9s” (99.9%) two-qubit gate fidelity, a critical metric for scalable quantum machine learning.
Emergence of Industry-Specific Quantum Applications:
Quantum computing is moving toward industry-specific solutions tailored to unique operational challenges. Pharmaceutical companies are adopting quantum systems for molecular modeling and drug interaction analysis. The energy sector is leveraging quantum algorithms for optimizing power grid management. Automotive manufacturers are using quantum simulations for lightweight material development. The financial industry is deploying quantum risk models to improve portfolio resilience. It is enabling targeted adoption strategies based on measurable ROI. Industry-focused quantum software startups are gaining traction. This trend is creating specialized ecosystems for sector-specific quantum solutions.
- For instance, For pharmaceuticals, companies rely on quantum molecular modeling and interaction simulations to accelerate drug development cycles. Energy firms use quantum algorithms for optimizing power grid operations and renewable energy integration, improving system efficiency.
Advances in Quantum Networking and Communication Systems:
The development of quantum networks is emerging as a key trend, enabling secure data transmission based on quantum key distribution (QKD). Quantum communication promises ultra-secure channels resistant to hacking. Governments and research institutions are building pilot quantum internet infrastructures. It is enhancing national security, financial transactions, and confidential communications. Satellite-based quantum communication projects are advancing cross-border data security. Quantum repeaters are being developed to extend communication distances. This progress is laying the foundation for global quantum communication networks. The trend is attracting strong interest from cybersecurity and defense sectors.
Growth of Open-Source Quantum Software Ecosystems:
Open-source quantum software platforms are fostering collaborative innovation across the industry. Developers and researchers can access, modify, and share quantum algorithms freely. It is accelerating experimentation and shortening development cycles. Companies are contributing to open frameworks to expand their developer communities. Quantum SDKs are integrating with popular programming languages to widen accessibility. Educational institutions are adopting these platforms for training future quantum professionals. The approach is lowering entry barriers for startups and small enterprises. This trend is creating a vibrant global community driving quantum software advancements.
Market Challenges Analysis:
Technical Complexity and Scalability Limitations in Quantum Hardware:
The Global Quantum Computing Market faces significant challenges related to technical complexity and scalability. Building stable qubits that maintain coherence for extended periods remains a major hurdle. Environmental noise and error rates hinder reliable computations. Scaling quantum systems to thousands or millions of qubits requires breakthroughs in fabrication and error correction. It is a capital-intensive process demanding specialized materials and infrastructure. Integration with classical systems also poses architectural challenges. The lack of standardized hardware interfaces slows interoperability. Overcoming these issues will be critical for achieving commercially viable large-scale quantum systems.
High Development Costs and Limited Skilled Workforce Availability:
Developing quantum computing solutions requires substantial financial and human resources. High R&D expenses make it difficult for smaller companies to compete with industry leaders. Specialized expertise in quantum physics, cryogenics, and quantum algorithms is in short supply. The talent gap is delaying project timelines and limiting innovation speed. It is further compounded by the rapid evolution of the technology, requiring continuous upskilling. Educational programs are expanding but cannot yet meet industry demand. Long-term investments in workforce development and training are necessary. These factors collectively slow down widespread adoption and commercialization.
Market Opportunities:
Rising Demand for Quantum Solutions in Emerging Economies:
The Global Quantum Computing Market is poised to benefit from increasing adoption in emerging economies. Governments in Asia-Pacific, Latin America, and the Middle East are investing in national quantum programs. Local industries are exploring applications in logistics, energy, and agriculture. It is opening pathways for technology providers to expand into new markets. Partnerships with regional research institutions can accelerate localized innovation. The adoption curve is expected to steepen as infrastructure improves. Vendors offering affordable QCaaS models can capture a larger share in these regions.
Development of Quantum-Enhanced Cybersecurity Solutions:
Cybersecurity is emerging as a high-potential application area for quantum computing. Quantum key distribution and post-quantum cryptography offer enhanced protection against evolving threats. Financial institutions, defense agencies, and critical infrastructure providers are key target customers. It is driving collaborations between quantum hardware developers and cybersecurity firms. Governments are prioritizing secure communication networks using quantum technologies. Commercial rollout of quantum encryption services presents a lucrative growth opportunity. Vendors focusing on security-specific quantum applications can gain a competitive edge in the market.
Market Segmentation Analysis:
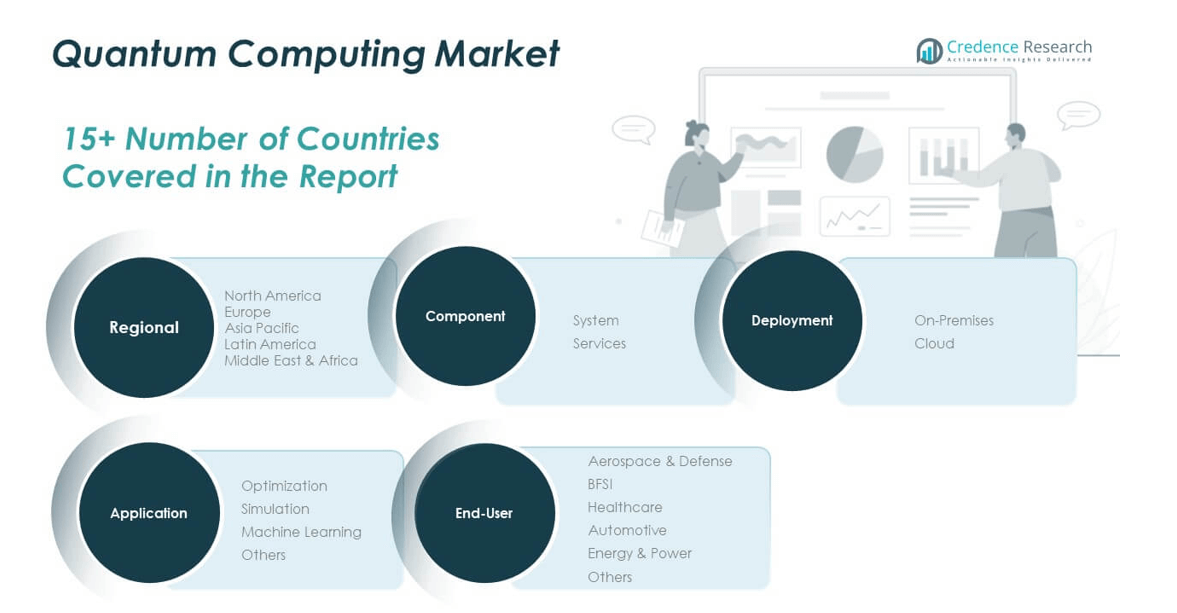
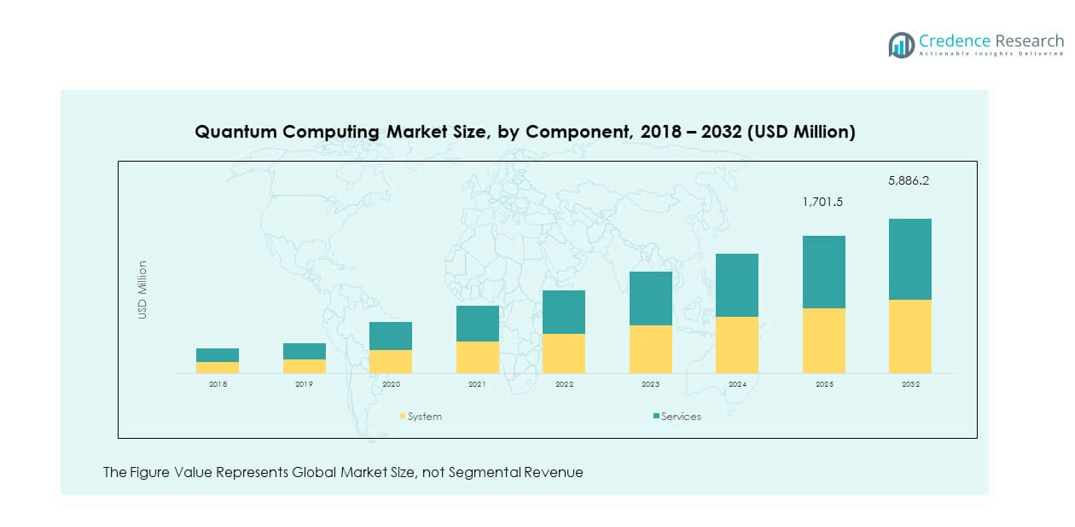
By Component
The Global Quantum Computing Market is segmented into systems and services. Systems hold the largest share due to the high cost and complexity of quantum hardware, supported by continuous advancements in qubit stability and error correction. Services are growing at a fast pace, driven by consulting, integration, and managed service offerings that enable enterprises to adopt quantum capabilities without heavy infrastructure investments.
- For instance, Dominated by advanced hardware with complex architectures like Fujitsu/RIKEN’s 256-qubit superconducting system and IBM’s modular fault-tolerant machines, offering unmatched computational power for scientific and industrial applications.
By Deployment
The market is divided into on-premises and cloud deployments. On-premises solutions cater to organizations prioritizing full control over infrastructure and security, often in sensitive sectors such as defense and finance. Cloud deployment, led by Quantum Computing as a Service (QCaaS), is rapidly expanding due to its scalability, cost efficiency, and ease of access for research institutions, startups, and enterprises exploring quantum applications.
By Application
Key applications include optimization, simulation, machine learning, and others. Optimization dominates usage, enabling industries to solve complex logistical, operational, and resource allocation problems. Simulation supports breakthroughs in pharmaceuticals, materials science, and environmental modeling. Machine learning applications are expanding as quantum algorithms enhance AI model training and predictive analytics. Other applications include cryptography, financial modeling, and advanced engineering designs.
By End-User
Major end-users include aerospace and defense, BFSI, healthcare, automotive, energy and power, and others. Aerospace and defense lead adoption for advanced research, secure communications, and mission planning. BFSI uses quantum systems for fraud detection, risk assessment, and portfolio optimization. Healthcare leverages quantum computing in drug discovery and genomics, while automotive applies it to material design and autonomous driving algorithms. The energy and power sector uses it for grid optimization, renewable integration, and demand forecasting, with other industries exploring specialized applications.\
Segmentation:
By Component
By Deployment
By Application
- Optimization
- Simulation
- Machine Learning
- Others
By End-User
- Aerospace & Defense
- BFSI
- Healthcare
- Automotive
- Energy & Power
- Others
By Region
- North America
- Europe
- UK
- France
- Germany
- Italy
- Spain
- Russia
- Belgium
- Netherlands
- Austria
- Sweden
- Poland
- Denmark
- Switzerland
- Rest of Europe
- Asia Pacific
- China
- Japan
- South Korea
- India
- Australia
- Thailand
- Indonesia
- Vietnam
- Malaysia
- Philippines
- Taiwan
- Rest of Asia Pacific
- Latin America
- Brazil
- Argentina
- Peru
- Chile
- Colombia
- Rest of Latin America
- Middle East
- UAE
- KSA
- Israel
- Turkey
- Iran
- Rest of Middle East
- Africa
- Egypt
- Nigeria
- Algeria
- Morocco
- Rest of Africa
Regional Analysis:
North America
The North America Global Quantum Computing Market size was valued at USD 294.3 million in 2018 to USD 572.9 million in 2024 and is anticipated to reach USD 2,344.0 million by 2032, at a CAGR of 19.4% during the forecast period. North America holds approximately 39.8% of the global market share, driven by strong R&D investment and the presence of leading quantum technology companies. It benefits from active government initiatives, including national quantum programs and defense-related projects. Major tech firms are establishing quantum research labs and commercializing solutions for industries such as finance, aerospace, and healthcare. Academic institutions and research centers are forming collaborations with enterprises to accelerate innovation. Venture capital investment remains robust, fostering a competitive startup ecosystem. The region’s mature cloud infrastructure supports rapid adoption of Quantum Computing as a Service (QCaaS). Strong intellectual property frameworks and talent availability further strengthen North America’s leadership position.
Europe
The Europe Global Quantum Computing Market size was valued at USD 157.7 million in 2018 to USD 295.6 million in 2024 and is anticipated to reach USD 1,128.7 million by 2032, at a CAGR of 18.4% during the forecast period. Europe accounts for around 20.6% of the global market share, supported by substantial EU-funded quantum research initiatives. It has developed a coordinated approach through programs like the Quantum Flagship, which connects academia, industry, and government. Countries such as Germany, the UK, and France lead in hardware and algorithm development. European companies are applying quantum solutions in sectors like manufacturing, energy, and pharmaceuticals. The regulatory environment promotes secure quantum communication through projects in quantum key distribution. Strategic partnerships between quantum startups and industrial leaders are growing. The expansion of educational programs is building a skilled workforce. The region’s commitment to sustainability and innovation supports long-term growth.
Asia Pacific
The Asia Pacific Global Quantum Computing Market size was valued at USD 168.6 million in 2018 to USD 347.4 million in 2024 and is anticipated to reach USD 1,574.1 million by 2032, at a CAGR of 20.9% during the forecast period. Asia Pacific holds about 24.2% of the global market share, emerging as the fastest-growing region. It is experiencing rapid advancements driven by strong government funding and national quantum strategies in China, Japan, and South Korea. China leads in building large-scale quantum communication networks and investing in quantum hardware. Japan focuses on industrial collaborations in automotive and electronics sectors. India is initiating programs to build domestic quantum infrastructure and talent pools. Local startups are entering the market with innovative QCaaS models. Strategic investments from tech giants in the region are boosting commercialization. The region’s growing technology ecosystem supports its rise as a quantum innovation hub.
Latin America
The Latin America Global Quantum Computing Market size was valued at USD 55.3 million in 2018 to USD 108.0 million in 2024 and is anticipated to reach USD 416.0 million by 2032, at a CAGR of 18.5% during the forecast period. Latin America contributes around 6.4% of the global market share, with growth fueled by emerging adoption in sectors such as banking, logistics, and agriculture. Governments are beginning to invest in research collaborations with international quantum technology leaders. Brazil and Mexico are leading regional hubs with growing academic and industry engagement. Cloud-based quantum services are gaining traction due to cost-effectiveness. Multinational companies are partnering with local firms to explore quantum-driven optimization solutions. The region’s universities are offering specialized courses to develop skilled professionals. It is expected that increased funding and policy support will accelerate market penetration. Infrastructure improvements will further enhance adoption across industries.
Middle East
The Middle East Global Quantum Computing Market size was valued at USD 38.2 million in 2018 to USD 71.7 million in 2024 and is anticipated to reach USD 273.2 million by 2032, at a CAGR of 18.3% during the forecast period. The region holds approximately 4.2% of the global market share, with interest growing in government, defense, and energy applications. Countries such as the UAE, Saudi Arabia, and Israel are leading investments in quantum research and technology acquisition. Strategic partnerships with global quantum leaders are bringing expertise and infrastructure to the region. Quantum solutions are being explored for secure communication and oilfield optimization. Universities and research institutes are playing a critical role in skill development. The region is positioning itself as a niche innovation hub for high-security and industrial quantum applications. Investments in smart city initiatives are further expanding the scope for quantum deployment.
Africa
The Africa Global Quantum Computing Market size was valued at USD 15.8 million in 2018 to USD 40.9 million in 2024 and is anticipated to reach USD 150.1 million by 2032, at a CAGR of 17.3% during the forecast period. Africa accounts for roughly 2.3% of the global market share, with growth primarily in early adoption and research collaborations. South Africa leads regional efforts in quantum education and research partnerships with international institutions. The market is at a nascent stage, relying heavily on cloud-based QCaaS access. Quantum applications in agriculture, energy management, and public health are gaining attention. Limited infrastructure and skilled workforce remain challenges. Governments and NGOs are promoting STEM education to build long-term capabilities. International collaborations are essential for accelerating adoption. The region has potential to grow as technology costs decline and accessibility improves.
Shape Your Report to Specific Countries or Regions & Enjoy 30% Off!
Key Player Analysis:
- Accenture Plc.
- D-Wave Systems Inc.
- Google LLC
- IBM Corporation
- Intel Corporation
- Microsoft Corporation
- Quantinuum Ltd.
- Rigetti & Co, Inc.
- Riverlane
- Zapata Computing
Competitive Analysis:
The Global Quantum Computing Market is characterized by intense competition among established technology giants, specialized quantum hardware firms, and emerging startups. Leading players such as IBM, Google, Microsoft, Intel, and D-Wave are investing heavily in R&D to advance qubit performance, error correction, and scalable architectures. It is witnessing increased partnerships between hardware developers, software providers, and end-user industries to accelerate commercialization. Cloud-based Quantum Computing as a Service (QCaaS) offerings are intensifying competition by lowering entry barriers. The market is also shaped by collaborations with academic institutions and government-backed research initiatives. Strategic acquisitions are enabling companies to expand product portfolios and access new technologies.
Recent Developments:
- In January 2025, Accenture made a strategic investment in QuSecure, a leader in post-quantum cybersecurity. This investment aims to provide comprehensive post-quantum cryptographic agility solutions to government agencies and private sector businesses to mitigate emerging quantum risks. QuSecure’s QuProtect software offers a quantum security-as-a-service architecture that integrates zero-trust, quantum-resilient technology, and crypto agility, protecting networks and cloud systems against current cyberattacks and future quantum threats with minimal disruption.
- In May 2025, Accenture acquired Yumemi, a leading Japanese digital services and products company. This acquisition enhances Accenture’s ability to design and launch innovative digital products rapidly at scale. Yumemi’s team of approximately 400 professionals joins Accenture Song, leveraging data analytics and generative AI to help clients evolve their digital products and drive long-term business growth. The deal closed on May 30, 2025.
- In July 2025, Accenture continued its acquisition spree by purchasing Maryville Consulting Group, a U.S.-based technology firm specializing in product-driven growth strategies and digital operations management. This acquisition adds over 100 professionals to Accenture and strengthens its technology consulting and AI capabilities. It aligns with Accenture’s strategy to integrate AI and next-generation computing across its services.
- Earlier in 2025, Accenture through Accenture Ventures also invested in Aliro Quantum, a company specializing in secure quantum networks using entanglement-based quantum cryptography. This investment supports the development of scalable quantum networking technologies integrated into Accenture’s cybersecurity offerings to facilitate secure quantum communications.
Market Concentration & Characteristics:
The Global Quantum Computing Market exhibits moderate to high concentration, with a few major players dominating technological leadership and infrastructure capabilities. It is defined by rapid innovation cycles, high capital requirements, and significant government participation. Barriers to entry are substantial due to the complexity of quantum hardware development and the need for specialized expertise. The market’s competitive landscape is shaped by intellectual property strength, cloud accessibility, and strategic partnerships. Continuous advancements in hardware and algorithms drive differentiation and influence long-term positioning.
Report Coverage:
The research report offers an in-depth analysis based on component, deployment, application, and end-user segments. It details leading market players, providing an overview of their business, product offerings, investments, revenue streams, and key applications. Additionally, the report includes insights into the competitive environment, SWOT analysis, current market trends, as well as the primary drivers and constraints. Furthermore, it discusses various factors that have driven market expansion in recent years. The report also explores market dynamics, regulatory scenarios, and technological advancements that are shaping the industry. It assesses the impact of external factors and global economic changes on market growth. Lastly, it provides strategic recommendations for new entrants and established companies to navigate the complexities of the market.
Future Outlook:
- Expansion of quantum hardware capabilities will drive scalability.
- Growth in QCaaS adoption will widen enterprise accessibility.
- Hybrid quantum-classical solutions will enhance performance.
- Increased investment in post-quantum cryptography will secure communications.
- Industry-specific applications will deepen adoption in key sectors.
- Asia Pacific will emerge as a primary innovation hub.
- Talent development initiatives will address the skills gap.
- Open-source software will accelerate algorithm development.
- Strategic mergers will consolidate market leadership.
- Government funding will remain a critical growth driver.


