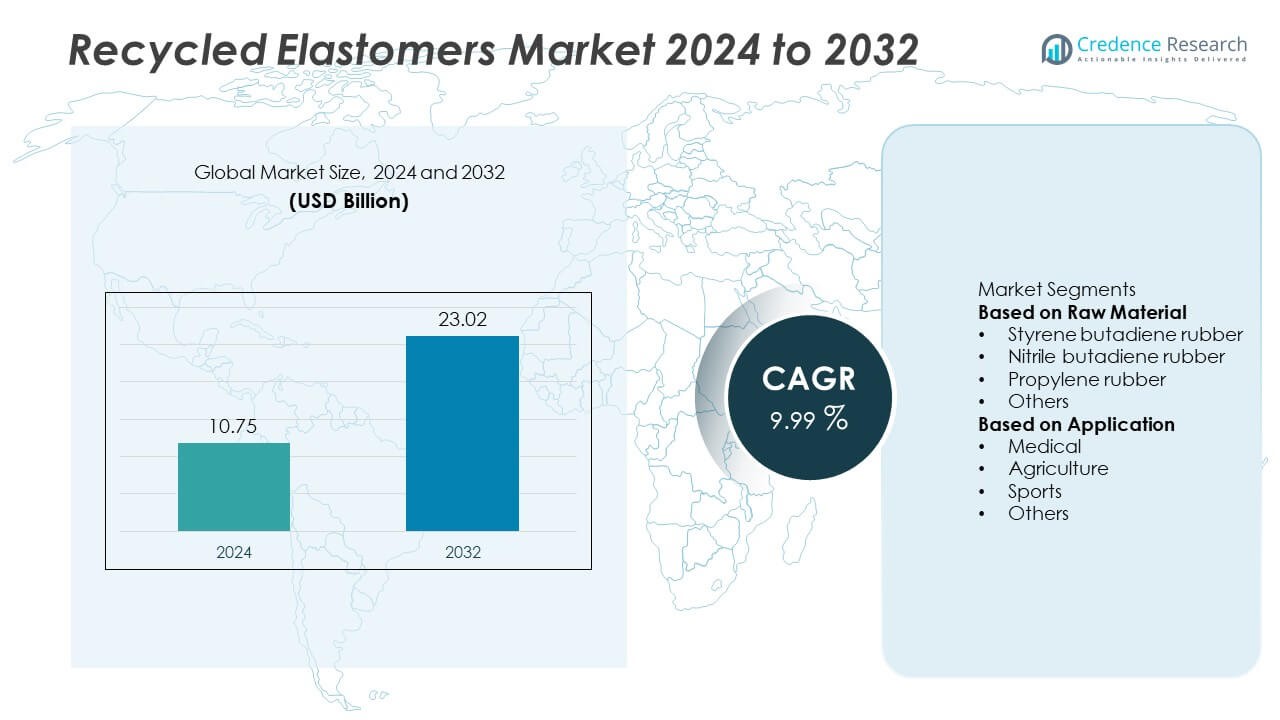
Home » Advanced Materials » Recycled Elastomers Market

Recycled Elastomers Market By Type (Styrene Butadiene Rubber, Nitrile Butadiene Rubber, Propylene Rubber, Chloroprene Rubber, Natural Rubber and Polyurethane Rubber) By Application (Medical, Agriculture, Sports Products, Playground Surfaces, Infrastructure and Home & Garden)-Growth, Future Prospects & Competitive Analysis, 2016 – 2028

Price: $4999

Published: | Report ID: 17936 | Report Format : PDF

Key Highlights of the Report

How are the major segments performing in the Recycled Elastomers market?

  • In 2022 the agricultural sector will have about 10% of the worldwide market share. Products made from recycled elastomer are the best choice for the agricultural industry because of their superior qualities, including affordability, UV resistance, and durability.
  • In 2022, chloroprene rubber accounted for 15% of the world’s recycled elastomers market. Products with qualities like resistance to sunlight and hazardous gases are perfect for use in the infrastructure sector.

What is the Market Size of Recycled Elastomers regarding Value?

The global recycled elastomers market is anticipated to grow at a substantial CAGR of 12.6% in the upcoming years. The global Recycled Elastomers industry was estimated to be worth USD 3.5 billion in 2022 and is expected to be USD 8.1 billion by 2028.

Which region dominated the Recycled Elastomers market?

Asia Pacific controlled the market share for recycled elastomers worldwide. The expansion of the APAC recycling equipment and machinery business is fuelled by several infrastructure and building projects in developing nations. Due to its affordable labor and land availability, the Asia Pacific area is where most foreign direct investment is concentrated in the industrial sectors.

Design Element 2

Access crucial information at unmatched prices!

Request your free sample report today & start making informed decisions powered by Credence Research!

Download Free Sample
CTA Design Element 3

Which are the key countries in the recycled elastomers market?

Population expansion and increased government investment have boosted India’s infrastructure sector, which will support the growth of the recycled elastomers market throughout the foreseeable future. The country with the quickest growth was India. This is owing to the building and infrastructure sector’s robust performance, as highway construction in India has doubled.

Using the product as an asphalt binder will increase the market for recycled elastomers shortly as more motorway and highway projects are approved in the US. The government’s structural changes to increase agricultural productivity led to an increase in farmer income. The need for recycled rubber will be significantly increased as a result since it is used to shield livestock and crops from bad weather.

REPORT ATTRIBUTE DETAILS
Recycled Elastomers Market by Volume Yes
Recycled Elastomers Market by Value Yes
Recycled Elastomers Market, Tornado Analysis Yes
Recycled Elastomers Market, STAR Analysis Yes
Recycled Elastomers Market, SRC Analysis Yes
Recycled Elastomers Market, Import-Export Data Yes (On Demand)
Recycled Elastomers Market Pricing Analysis Yes (On Demand)
Recycled Elastomers Market Segment Analysis By Type (Styrene Butadiene Rubber, Nitrile Butadiene Rubber, Propylene Rubber, Chloroprene Rubber, Natural Rubber and Polyurethane Rubber)

By Application (Medical, Agriculture, Sports Products, Playground Surfaces, Infrastructure and Home & Garden)

Recycled Elastomers Market, Regional Analysis North America (US, Canada, Mexico)

Europe (Germany, UK, Spain, France, Italy, and Rest of Europe)

Asia Pacific (China, Japan, India, South Korea, South East Asia, and Rest of Asia Pacific)

Latin America (Brazil, Argentina, and Rest of Latin America)

Middle East and Africa (South Africa, GCC Countries, and Rest of Middle East and Africa)

Recycled Elastomers Market Key Companies GRP Ltd, Liberty Tire Recycling, American Tire Recycling, West Coast Rubber Recycling, Monmouth Rubber & Plastics Corp, J. Allcock & Sons Limited, RubberForm Recycled Products LLC, American Recycling Center, Green Rubber One Sdn. Bsd., Austin Rubber Company LLC, Klean Industries and Genan Holding
Recycled Elastomers Market Competitive Landscape Market Share Analysis

Competitive Benchmarking

Key Players Market Positioning

Geographical Presence Analysis

Major Strategies Adopted

How is the economy impacting global recycled elastomers’ growth?

Rising inflation rates have impacted markets in many nations. Additionally, market liquidity can diminish. The Russia-Ukraine War caused losses for businesses that purchased items from Russia and Ukraine. The Covid-19 commercial release impacted large businesses’ capital investments. The government-imposed lockout and limits on cross-border mobility have significantly impacted the supply chain for raw materials in the stream mop sector, raising prices and, as a result, companies’ raw material costs.

What is the competitive environment of the recycled elastomers market?

Few regional and a variety of international vendors make up the market, and regional suppliers would find it increasingly challenging to compete with multinational competitors, particularly in terms of quality and technology. In the not-too-distant future, industrial competition is anticipated to rise. Because of numerous variables, including cost, availability, cheap labor, etc., many players are anticipated to increase their presence globally, particularly in the APAC region’s rapidly developing countries, to increase their share of the recycled elastomers market.

Executive Summary

What are the key trends in the Recycled Elastomers market?

  • Two of the most major factors influencing the rise and expansion of the global market for recycled elastomers are the rise in the global population and the rise in government spending on infrastructure development in most places of the world.
  • The agricultural industries employ the goods and services available on the global market for recycled elastomers to safeguard livestock and crops from unfavorable weather and climate conditions.

What is the market understanding of the Recycled Elastomers Market?

The products on the global market for recycled elastomers are mostly utilized as asphalt binders in the infrastructure sector to increase the resilience of public facilities like highways. When used on roads, these recycled elastomers market solutions also help lessen traffic and automobile noise. In addition to infrastructure, the goods and services offered by the global market for recycled elastomers have various uses in various sectors, including agriculture, playground surfacing, healthcare, houses, and gardens. Based on the raw materials used in their manufacture, the products in the global recycled elastomers market may be divided into nitrile butadiene rubber, chloroprene rubber, polyurethane rubber, styrene-butadiene rubber, propylene rubber, and natural rubber.

Recycled Elastomers Market

What are the key investments by the recycled elastomers market players?

Many companies are implementing organic growth tactics like plant capacity expansion and new product launches to obtain a competitive edge and seize the market’s growth prospects. For instance, Genan Holdings introduced Genan safe rubber pellets as a new product in November 2016. The product has greater performance and a lower bulk density, making it ideal for use as playground base layers.

Some major players in the recycled elastomers market are GRP Ltd, Liberty Tire Recycling, American Tire Recycling, West Coast Rubber Recycling, Monmouth Rubber & Plastics Corp, J. Allcock & Sons Limited, RubberForm Recycled Products LLC, American Recycling Center, Green Rubber One Sdn. Bsd., Austin Rubber Company LLC, Klean Industries and Genan Holding.

What are the Major Driving Factors for the Recycled Elastomers Market?

Recycling elastomers is a key component in offering solutions in many industries. Traditional recycling techniques aid in size reduction into manageable parts that can be recombined. More sustainable production is achieved by producing more recycled goods than new resin goods. It is much more sturdy, less expensive, and flexible and can last. People’s knowledge of the value of recycled materials grows along with the demand for manufacturers and companies to engage in sustainable processing practices. Nevertheless, there are crucial financial and behavioral considerations to switch to an eco-friendly elastomer. Such factors are stimulating the market for recycled elastomers.

What are the Major Risks for the Recycled Elastomers Market?

To lower the usage cost in various applications, recycled elastomers are utilized instead of primary elastomers. There are numerous applications for products, including rubber goods, tires, butyl, nitrile, EPDM, and recovered rubber. However, the cost of recycled elastomers is directly related to the cost of primary elastomers, which is inversely related to the price of oil. In addition to the expense of gathering, processing elastomers is challenging due to complex technology. Technological difficulties and harmful compounds in elastomer waste further constrain the market for recovered elastomers.

Which is the key application in the recycled elastomers market?

Numerous industries use recycled elastomers, but the agricultural industry accounts for roughly 10% of the global market. The agricultural sector finds superior products useful as windbreakers, bumpers, feeders, cattle mats, and vegetation guards because of their affordability, UV resistance, and durability. These aid in boosting agricultural productivity and effectiveness. India, China, and Southeast Asian nations like Indonesia and Thailand are among the nations in the Asia Pacific region with agricultural economies. Given the push to boost agricultural output brought on by the region’s population boom, agriculture is one of the main contributors to their GDP. By 2030, this will greatly accelerate the growth of the recycled rubber market by driving product demand in the agricultural sector.

How is the recycled elastomers market performing in regions?

Asia Pacific dominated the recycled elastomer market share globally. Numerous construction and infrastructure projects in developing countries are driving the growth of the APAC recycling equipment and machines market. The Asia Pacific region is where most foreign direct investment is concentrated in the industrial sectors due to its accessible workers and inexpensive land costs. Government involvement in the elastomer business is growing, which benefits the recycling sector. The market for recycled elastomers is boosted by rising machinery and equipment use, which is also influenced by economic stability and government support.

Shape Your Report to Specific Countries or Regions & Enjoy 30% Off!

What are the major players planning for the future of the recycled elastomers market?

Manufacturing thermoplastic elastomers is the focus of manufacturers. Thermoplastic elastomers are a particularly dependable source of plastic since they can be recycled by oxidation and devaluation processes, which are used in several industries and applications. The use of thermoplastics is increasing due to rising environmental concerns since they are more dependable than thermoset elastomers.

Segmentation of Global Recycled Elastomers Market-

Global Recycled Elastomers Market – By Type

  • Styrene Butadiene Rubber
  • Nitrile Butadiene Rubber
  • Propylene Rubber
  • Chloroprene Rubber
  • Natural Rubber
  • Polyurethane Rubber

Global Recycled Elastomers Market – By Application

  • Medical
  • Agriculture
  • Sports Product
  • Playground Surfaces
  • Infrastructure
  • Home & Garden

Global Recycled Elastomers Market – By Region

  • North America
    • The US.
    • Canada
    • Mexico
  • Europe
    • Germany
    • France
    • The UK.
    • Italy
    • Spain
    • Rest of Europe
  • Asia Pacific
    • China
    • Japan
    • India
    • South Korea
    • South-east Asia
    • Rest of Asia Pacific
  • Latin America
    • Brazil
    • Argentina
    • Rest of Latin America
  • Middle East & Africa
    • GCC Countries
    • South Africa
    • Rest of the Middle East and Africa

1. Preface
1.1. Report Description
1.1.1. Purpose of the Report
1.1.2. Target Audience
1.1.3. USP and Key Offerings
1.2. Research Scope
1.3. Research Methodology
1.3.1. Phase I – Secondary Research
1.3.2. Phase II – Data Modelling
1.3.2.1. Company Share Analysis Model
1.3.2.2. Revenue Based Modelling
1.3.3. Phase III – Primary Research
1.3.4. Research Limitations
1.3.5. Assumptions
1.4. Market Introduction
1.5. Market Research Scope

2. Executive Summary
2.1. Market Snapshot: Global Recycled Elastomers Market
2.2. Global Recycled Elastomers Market, By Type
2.3. Global Recycled Elastomers Market, By Application
2.4. Global Recycled Elastomers Market, By Region

3. Market Dynamics & Factors Analysis
3.1. Introduction
3.1.1. Global Recycled Elastomers Market Value, 2017-2030, (US$ Bn)
3.1.2. Y-o-Y Growth Trend Analysis
3.2. Market Dynamics
3.2.1. Market Drivers
3.2.1.1. Driver 1
3.2.1.2. Driver 2
3.2.1.3. Driver 3
3.2.2. Market Restraints
3.2.2.1. Restraint 1
3.2.2.2. Restraint 2
3.2.3. Market Opportunities
3.2.3.1. Opportunity 1
3.2.3.2. Opportunity 2
3.2.4. Major Industry Challenges
3.2.4.1. Challenge 1
3.2.4.2. Challenge 2
3.3. Growth and Development Patterns
3.4. Investment Feasibility Analysis
3.5. Market Opportunity Analysis
3.5.1. Type
3.5.2. Application
3.5.3. Geography

4. Premium Insights
4.1. STAR (Situation, Task, Action, Results) Analysis
4.2. Porter’s Five Forces Analysis
4.2.1. Threat of New Entrants
4.2.2. Bargaining Power of Buyers/Consumers
4.2.3. Bargaining Power of Suppliers
4.2.4. Threat of Substitute Types
4.2.5. Intensity of Competitive Rivalry
4.3. Key Market Trends
4.3.1. Demand Side Trends
4.3.2. Supply Side Trends
4.4. Value Chain Analysis
4.5. Technology Analysis
4.6. Analysis and Recommendations
4.7. Marketing Strategy Analysis
4.7.1. Direct Marketing
4.7.2. Indirect Marketing
4.7.3. Marketing Channel Development Trend

5. Market Positioning of Key Players, 2022
5.1. Company market share of key players, 2022
5.2. Competitive Benchmarking
5.3. Market Positioning of Key Vendors
5.4. Geographical Presence Analysis
5.5. Major Strategies Adopted by Key Players
5.5.1. Key Strategies Analysis
5.5.2. Mergers and Acquisitions
5.5.3. Partnerships
5.5.4. Product Launch
5.5.5. Geographical Expansion
5.5.6. Others

6. Economic Impact Analysis
6.1. Recession Impact
6.1.1. North America
6.1.2. Europe
6.1.3. Asia Pacific
6.1.4. Latin America
6.1.5. Middle East and Africa
6.2. Ukraine-Russia War Impact
6.2.1. North America
6.2.2. Europe
6.2.3. Asia Pacific
6.2.4. Latin America
6.2.5. Middle East and Africa
6.3. COVID-19 Impact Analysis
6.3.1. North America
6.3.2. Europe
6.3.3. Asia Pacific
6.3.4. Latin America
6.3.5. Middle East and Africa

7. Global Recycled Elastomers Market, By Type
7.1. Global Recycled Elastomers Market Overview, By Type
7.1.1. Global Recycled Elastomers Market Revenue Share, By Type, 2022 Vs 2030 (in %)
7.2. Styrene Butadiene Rubber
7.2.1. Global Recycled Elastomers Market, By Region, 2017-2030 (US$ Bn)
7.3. Nitrile Butadiene Rubber
7.3.1. Global Recycled Elastomers Market, By Region, 2017-2030 (US$ Bn)
7.4. Propylene Rubber
7.4.1. Global Recycled Elastomers Market, By Region, 2017-2030 (US$ Bn)
7.5. Chloroprene Rubber
7.5.1. Global Recycled Elastomers Market, By Region, 2017-2030 (US$ Bn)
7.6. Natural Rubber
7.6.1. Global Recycled Elastomers Market, By Region, 2017-2030 (US$ Bn)
7.7. Polyurethane Rubber
7.7.1. Global Recycled Elastomers Market, By Region, 2017-2030 (US$ Bn)

8. Global Recycled Elastomers Market, by Application, 2017-2030 (US$ Bn)
8.1. Global Recycled Elastomers Market Overview, by Application
8.1.1. Global Recycled Elastomers Market, By Application, 2022 vs 2030 (in%)
8.2. Medical
8.2.1. Global Recycled Elastomers Market, By Region, 2017-2030 (US$ Bn)
8.3. Agriculture
8.3.1. Global Recycled Elastomers Market, By Region, 2017-2030 (US$ Bn)
8.4. Sports Product
8.4.1. Global Recycled Elastomers Market, By Region, 2017-2030 (US$ Bn)
8.5. Playground Surfaces
8.5.1. Global Recycled Elastomers Market, By Region, 2017-2030 (US$ Bn)
8.6. Infrastructure
8.6.1. Global Recycled Elastomers Market, By Region, 2017-2030 (US$ Bn)
8.7. Home & Garden
8.7.1. Global Recycled Elastomers Market, By Region, 2017-2030 (US$ Bn)

9. Global Recycled Elastomers Market, By Region
9.1. Global Recycled Elastomers Market Overview, by Region
9.1.1. Global Recycled Elastomers Market, By Region, 2022 vs 2030 (in%)
9.2. Type
9.2.1. Global Recycled Elastomers Market, By Type, 2017-2030 (US$ Bn)
9.3. Application
9.3.1. Global Recycled Elastomers Market, By Application, 2017-2030 (US$ Bn)

10. North America Recycled Elastomers Market Analysis
10.1. North America Recycled Elastomers Market, By Type, 2017-2030(US$ Bn)
10.1.1. Overview
10.1.2. SRC Analysis
10.2. North America Recycled Elastomers Market, by Application, 2017-2030(US$ Bn)
10.2.1. Overview
10.2.2. SRC Analysis
10.3. North America Recycled Elastomers Market, by Country, 2017-2030 (US$ Bn)
10.3.1. North America Recycled Elastomers Market, by Country, 2022 Vs 2030 (in%)
10.3.2. U.S.
10.3.2.1. U.S. Recycled Elastomers Market Estimates and Forecast, 2017-2030 (US$ Bn)
10.3.2.2. U.S. Recycled Elastomers, By Type, 2017-2030 (US$ Bn)
10.3.2.3. U.S. Recycled Elastomers, By Application, 2017-2030 (US$ Bn)
10.3.3. Canada
10.3.3.1. Canada Recycled Elastomers Market Estimates and Forecast, 2017-2030 (US$ Bn)
10.3.3.2. Canada Recycled Elastomers, By Type, 2017-2030 (US$ Bn)
10.3.3.3. Canada Recycled Elastomers, By Application, 2017-2030 (US$ Bn)
10.3.4. Mexico
10.3.4.1. Mexico Recycled Elastomers Market Estimates and Forecast, 2017-2030 (US$ Bn)
10.3.4.2. Mexico Recycled Elastomers, By Type, 2017-2030 (US$ Bn)
10.3.4.3. Mexico Recycled Elastomers, By Application, 2017-2030 (US$ Bn)

11. Europe Recycled Elastomers Market Analysis
11.1. Europe Recycled Elastomers Market, By Type, 2017-2030(US$ Bn)
11.1.1. Overview
11.1.2. SRC Analysis
11.2. Europe Recycled Elastomers Market, by Application, 2017-2030(US$ Bn)
11.2.1. Overview
11.2.2. SRC Analysis
11.3. Europe Recycled Elastomers Market, by Country, 2017-2030 (US$ Bn)
11.3.1. Europe Recycled Elastomers Market, by Country, 2022 Vs 2030 (in%)
11.3.2. Germany
11.3.2.1. Germany Recycled Elastomers Market Estimates and Forecast, 2017-2030 (US$ Bn)
11.3.2.2. Germany Recycled Elastomers, By Type, 2017-2030 (US$ Bn)
11.3.2.3. Germany Recycled Elastomers, By Application, 2017-2030 (US$ Bn)
11.3.3. France
11.3.3.1. France Recycled Elastomers Market Estimates and Forecast, 2017-2030 (US$ Bn)
11.3.3.2. France Recycled Elastomers, By Type, 2017-2030 (US$ Bn)
11.3.3.3. France Recycled Elastomers, By Application, 2017-2030 (US$ Bn)
11.3.4. UK
11.3.4.1. UK Recycled Elastomers Market Estimates and Forecast, 2017-2030 (US$ Bn)
11.3.4.2. UK Recycled Elastomers, By Type, 2017-2030 (US$ Bn)
11.3.4.3. UK Recycled Elastomers, By Application, 2017-2030 (US$ Bn)
11.3.5. Italy
11.3.5.1. Italy Recycled Elastomers Market Estimates and Forecast, 2017-2030 (US$ Bn)
11.3.5.2. Italy Recycled Elastomers, By Type, 2017-2030 (US$ Bn)
11.3.5.3. Italy Recycled Elastomers, By Application, 2017-2030 (US$ Bn)
11.3.6. Spain
11.3.6.1. Spain Recycled Elastomers Market Estimates and Forecast, 2017-2030 (US$ Bn)
11.3.6.2. Spain Recycled Elastomers, By Type, 2017-2030 (US$ Bn)
11.3.6.3. Spain Recycled Elastomers, By Application, 2017-2030 (US$ Bn)
11.3.7. Rest of Europe
11.3.7.1. Rest of Europe Recycled Elastomers Market Estimates and Forecast, 2017-2030 (US$ Bn)
11.3.7.2. Rest of Europe Recycled Elastomers, By Type, 2017-2030 (US$ Bn)
11.3.7.3. Rest of Europe Recycled Elastomers, By Application, 2017-2030 (US$ Bn)

12. Asia Pacific Recycled Elastomers Market Analysis
12.1. Asia Pacific Recycled Elastomers Market, By Type, 2017-2030(US$ Bn)
12.1.1. Overview
12.1.2. SRC Analysis
12.2. Asia Pacific Recycled Elastomers Market, by Application, 2017-2030(US$ Bn)
12.2.1. Overview
12.2.2. SRC Analysis
12.3. Asia Pacific Recycled Elastomers Market, by Country, 2017-2030 (US$ Bn)
12.3.1. Asia Pacific Recycled Elastomers Market, by Country, 2022 Vs 2030 (in%)
12.3.2. China
12.3.2.1. China Recycled Elastomers Market Estimates and Forecast, 2017-2030 (US$ Bn)
12.3.2.2. China Recycled Elastomers, By Type, 2017-2030 (US$ Bn)
12.3.2.3. China Recycled Elastomers, By Application, 2017-2030 (US$ Bn)
12.3.3. Japan
12.3.3.1. Japan Recycled Elastomers Market Estimates and Forecast, 2017-2030 (US$ Bn)
12.3.3.2. Japan Recycled Elastomers, By Type, 2017-2030 (US$ Bn)
12.3.3.3. Japan Recycled Elastomers, By Application, 2017-2030 (US$ Bn)
12.3.4. India
12.3.4.1. India Recycled Elastomers Market Estimates and Forecast, 2017-2030 (US$ Bn)
12.3.4.2. India Recycled Elastomers, By Type, 2017-2030 (US$ Bn)
12.3.4.3. India Recycled Elastomers, By Application, 2017-2030 (US$ Bn)
12.3.5. South Korea
12.3.5.1. South Korea Recycled Elastomers Market Estimates and Forecast, 2017-2030 (US$ Bn)
12.3.5.2. South Korea Recycled Elastomers, By Type, 2017-2030 (US$ Bn)
12.3.5.3. South Korea Recycled Elastomers, By Application, 2017-2030 (US$ Bn)
12.3.6. South-East Asia
12.3.6.1. South-East Asia Recycled Elastomers Market Estimates and Forecast, 2017-2030 (US$ Bn)
12.3.6.2. South-East Asia Recycled Elastomers, By Type, 2017-2030 (US$ Bn)
12.3.6.3. South-East Asia Recycled Elastomers, By Application, 2017-2030 (US$ Bn)
12.3.7. Rest of Asia Pacific
12.3.7.1. Rest of Asia Pacific Recycled Elastomers Market Estimates and Forecast, 2017-2030 (US$ Bn)
12.3.7.2. Rest of Asia Pacific Recycled Elastomers, By Type, 2017-2030 (US$ Bn)
12.3.7.3. Rest of Asia Pacific Recycled Elastomers, By Application, 2017-2030 (US$ Bn)

13. Latin America Recycled Elastomers Market Analysis
13.1. Latin America Recycled Elastomers Market, By Type, 2017-2030(US$ Bn)
13.1.1. Overview
13.1.2. SRC Analysis
13.2. Latin America Recycled Elastomers Market, by Application, 2017-2030(US$ Bn)
13.2.1. Overview
13.2.2. SRC Analysis
13.3. Latin America Recycled Elastomers Market, by Country, 2017-2030 (US$ Bn)
13.3.1. Latin America Recycled Elastomers Market, by Country, 2022 Vs 2030 (in%)
13.3.2. Brazil
13.3.2.1. Brazil Recycled Elastomers Market Estimates and Forecast, 2017-2030 (US$ Bn)
13.3.2.2. Brazil Recycled Elastomers, By Type, 2017-2030 (US$ Bn)
13.3.2.3. Brazil Recycled Elastomers, By Application, 2017-2030 (US$ Bn)
13.3.3. Argentina
13.3.3.1. Argentina Recycled Elastomers Market Estimates and Forecast, 2017-2030 (US$ Bn)
13.3.3.2. Argentina Recycled Elastomers, By Type, 2017-2030 (US$ Bn)
13.3.3.3. Argentina Recycled Elastomers, By Application, 2017-2030 (US$ Bn)
13.3.4. Rest of Latin America
13.3.4.1. Rest of Latin America Recycled Elastomers Market Estimates and Forecast, 2017-2030 (US$ Bn)
13.3.4.2. Rest of Latin America Recycled Elastomers, By Type, 2017-2030 (US$ Bn)
13.3.4.3. Rest of Latin America Recycled Elastomers, By Application, 2017-2030 (US$ Bn)

14. Middle East and Africa Recycled Elastomers Market Analysis
14.1. Middle East and Africa Recycled Elastomers Market, By Type, 2017-2030(US$ Bn)
14.1.1. Overview
14.1.2. SRC Analysis
14.2. Middle East and Africa Recycled Elastomers Market, by Application, 2017-2030(US$ Bn)
14.2.1. Overview
14.2.2. SRC Analysis
14.3. Middle East and Africa Recycled Elastomers Market, by Country, 2017-2030 (US$ Bn)
14.3.1. Middle East and Africa Recycled Elastomers Market, by Country, 2022 Vs 2030 (in%)
14.3.2. GCC Countries
14.3.2.1. GCC Countries Recycled Elastomers Market Estimates and Forecast, 2017-2030 (US$ Bn)
14.3.2.2. GCC Countries Recycled Elastomers, By Type, 2017-2030 (US$ Bn)
14.3.2.3. GCC Countries Recycled Elastomers, By Application, 2017-2030 (US$ Bn)
14.3.3. South Africa
14.3.3.1. South Africa Recycled Elastomers Market Estimates and Forecast, 2017-2030 (US$ Bn)
14.3.3.2. South Africa Recycled Elastomers, By Type, 2017-2030 (US$ Bn)
14.3.3.3. South Africa Recycled Elastomers, By Application, 2017-2030 (US$ Bn)
14.3.4. Rest of Middle East and Africa
14.3.4.1. Rest of Middle East and Africa Recycled Elastomers Market Estimates and Forecast, 2017-2030 (US$ Bn)
14.3.4.2. Rest of Middle East and Africa Recycled Elastomers, By Type, 2017-2030 (US$ Bn)
14.3.4.3. Rest of Middle East and Africa Recycled Elastomers, By Application, 2017-2030 (US$ Bn)

15. Company Profiles
15.1. GRP Ltd
15.1.1. Company Overview
15.1.2. Products/Services Portfolio
15.1.3. Geographical Presence
15.1.4. Financial Summary
15.1.4.1. Market Revenue and Net Profit (2019-2022)
15.1.4.2. Business Segment Revenue Analysis
15.1.4.3. Geographical Revenue Analysis
15.2. Liberty Tire Recycling
15.3. American Tire Recycling
15.4. West Coast Rubber Recycling
15.5. Monmouth Rubber & Plastics Corp
15.6. J. Allcock & Sons Limited
15.7. RubberForm Recycled Products LLC
15.8. American Recycling Center
15.9. Green Rubber One Sdn. Bsd.
15.10. Austin Rubber Company LLC
15.11. Klean Industries
15.12. Genan Holding
15.13. Rubbergreen
15.14. Entech Inc
15.15. Emanuel Tire Co
15.16. Tire Disposal & Recycling Inc
15.17. Global Tire Recycling Inc

List of Figures
FIG. 1 Global Recycled Elastomers Market: Research Methodology
FIG. 2 Market Size Estimation – Top Down & Bottom up Approach
FIG. 3 Global Recycled Elastomers Market Segmentation
FIG. 4 Global Recycled Elastomers Market, By Type, 2022 (US$ Bn)
FIG. 5 Global Recycled Elastomers Market, by Application, 2022 (US$ Bn)
FIG. 6 Global Recycled Elastomers Market, by Geography, 2022 (US$ Bn)
FIG. 7 Attractive Investment Proposition, By Type, 2022
FIG. 8 Attractive Investment Proposition, by Application, 2022
FIG. 9 Attractive Investment Proposition, by Geography, 2022
FIG. 10 Global Market Share Analysis of Key Recycled Elastomers Market Manufacturers, 2022
FIG. 11 Global Market Positioning of Key Recycled Elastomers Market Manufacturers, 2022
FIG. 12 Global Recycled Elastomers Market Value Contribution, By Type, 2022 & 2030 (Value %)
FIG. 13 Global Recycled Elastomers Market, by Styrene Butadiene Rubber, Value, 2017-2030 (US$ Bn)
FIG. 14 Global Recycled Elastomers Market, by Nitrile Butadiene Rubber, Value, 2017-2030 (US$ Bn)
FIG. 15 Global Recycled Elastomers Market, by Propylene Rubber, Value, 2017-2030 (US$ Bn)
FIG. 16 Global Recycled Elastomers Market, by Chloroprene Rubber, Value, 2017-2030 (US$ Bn)
FIG. 17 Global Recycled Elastomers Market, by Natural Rubber, Value, 2017-2030 (US$ Bn)
FIG. 18 Global Recycled Elastomers Market, by Polyurethane Rubber, Value, 2017-2030 (US$ Bn)
FIG. 19 Global Recycled Elastomers Market Value Contribution, By Application, 2022 & 2030 (Value %)
FIG. 20 Global Recycled Elastomers Market, by Medical, Value, 2017-2030 (US$ Bn)
FIG. 21 Global Recycled Elastomers Market, by Agriculture, 2017-2030 (US$ Bn)
FIG. 22 Global Recycled Elastomers Market, by Sports Product, 2017-2030 (US$ Bn)
FIG. 23 Global Recycled Elastomers Market, by Playground Surfaces, 2017-2030 (US$ Bn)
FIG. 24 Global Recycled Elastomers Market, by Infrastructure, 2017-2030 (US$ Bn)
FIG. 25 Global Recycled Elastomers Market, by Home & Garden, 2017-2030 (US$ Bn)
FIG. 26 North America Recycled Elastomers Market, 2017-2030 (US$ Bn)
FIG. 27 U.S. Recycled Elastomers Market, 2017-2030 (US$ Bn)
FIG. 28 Canada Recycled Elastomers Market, 2017-2030 (US$ Bn)
FIG. 29 Europe Recycled Elastomers Market, 2017-2030 (US$ Bn)
FIG. 30 Germany Recycled Elastomers Market, 2017-2030 (US$ Bn)
FIG. 31 France Recycled Elastomers Market, 2017-2030 (US$ Bn)
FIG. 32 U.K. Recycled Elastomers Market, 2017-2030 (US$ Bn)
FIG. 33 Italy Recycled Elastomers Market, 2017-2030 (US$ Bn)
FIG. 34 Spain Recycled Elastomers Market, 2017-2030 (US$ Bn)
FIG. 35 Rest of Europe Recycled Elastomers Market, 2017-2030 (US$ Bn)
FIG. 36 Asia Pacific Recycled Elastomers Market, 2017-2030 (US$ Bn)
FIG. 37 China Recycled Elastomers Market, 2017-2030 (US$ Bn)
FIG. 38 Japan Recycled Elastomers Market, 2017-2030 (US$ Bn)
FIG. 39 India Recycled Elastomers Market, 2017-2030 (US$ Bn)
FIG. 40 South Korea Recycled Elastomers Market, 2017-2030 (US$ Bn)
FIG. 41 South-East Asia Recycled Elastomers Market, 2017-2030 (US$ Bn)
FIG. 42 Rest of Asia Pacific Recycled Elastomers Market, 2017-2030 (US$ Bn)
FIG. 43 Latin America Recycled Elastomers Market, 2017-2030 (US$ Bn)
FIG. 44 Brazil Recycled Elastomers Market, 2017-2030 (US$ Bn)
FIG. 45 Mexico Recycled Elastomers Market, 2017-2030 (US$ Bn)
FIG. 46 Rest of Latin America Recycled Elastomers Market, 2017-2030 (US$ Bn)
FIG. 47 Middle East & Africa Recycled Elastomers Market, 2017-2030 (US$ Bn)
FIG. 48 GCC Countries Recycled Elastomers Market, 2017-2030 (US$ Bn)
FIG. 49 South Africa Recycled Elastomers Market, 2017-2030 (US$ Bn)
FIG. 50 Rest of Middle East and Africa Recycled Elastomers Market, 2017-2030 (US$ Bn)

List of Tables
TABLE 1 Market Snapshot: Global Recycled Elastomers Market
TABLE 2 Global Recycled Elastomers Market: Market Drivers Impact Analysis
TABLE 3 Global Recycled Elastomers Market: Market Restraints Impact Analysis
TABLE 4 Global Recycled Elastomers Market, by Competitive Benchmarking, 2022
TABLE 5 Global Recycled Elastomers Market, by Geographical Presence Analysis, 2022
TABLE 6 Global Recycled Elastomers Market, by Key Strategies Analysis, 2022
TABLE 7 Global Recycled Elastomers Market, by Styrene Butadiene Rubber, By Region, 2017-2022 (US$ Bn)
TABLE 8 Global Recycled Elastomers Market, by Styrene Butadiene Rubber, By Region, 2023-2030 (US$ Bn)
TABLE 9 Global Recycled Elastomers Market, by Nitrile Butadiene Rubber, By Region, 2017-2022 (US$ Bn)
TABLE 10 Global Recycled Elastomers Market, by Nitrile Butadiene Rubber, By Region, 2023-2030 (US$ Bn)
TABLE 11 Global Recycled Elastomers Market, by Propylene Rubber, By Region, 2017-2022 (US$ Bn)
TABLE 12 Global Recycled Elastomers Market, by Propylene Rubber, By Region, 2023-2030 (US$ Bn)
TABLE 13 Global Recycled Elastomers Market, by Chloroprene Rubber, By Region, 2017-2022 (US$ Bn)
TABLE 14 Global Recycled Elastomers Market, by Chloroprene Rubber, By Region, 2023-2030 (US$ Bn)
TABLE 15 Global Recycled Elastomers Market, by Natural Rubber, By Region, 2017-2022 (US$ Bn)
TABLE 16 Global Recycled Elastomers Market, by Natural Rubber, By Region, 2023-2030 (US$ Bn)
TABLE 17 Global Recycled Elastomers Market, by Polyurethane Rubber, By Region, 2017-2022 (US$ Bn)
TABLE 18 Global Recycled Elastomers Market, by Polyurethane Rubber, By Region, 2023-2030 (US$ Bn)
TABLE 19 Global Recycled Elastomers Market, by Medical, By Region, 2017-2022 (US$ Bn)
TABLE 20 Global Recycled Elastomers Market, by Medical, By Region, 2023-2030 (US$ Bn)
TABLE 21 Global Recycled Elastomers Market, by Agriculture, By Region, 2017-2022 (US$ Bn)
TABLE 22 Global Recycled Elastomers Market, by Agriculture, By Region, 2023-2030 (US$ Bn)
TABLE 23 Global Recycled Elastomers Market, by Sports Product, By Region, 2017-2022 (US$ Bn)
TABLE 24 Global Recycled Elastomers Market, by Sports Product, By Region, 2023-2030 (US$ Bn)
TABLE 25 Global Recycled Elastomers Market, by Playground Surfaces, By Region, 2017-2022 (US$ Bn)
TABLE 26 Global Recycled Elastomers Market, by Playground Surfaces, By Region, 2023-2030 (US$ Bn)
TABLE 27 Global Recycled Elastomers Market, by Infrastructure, By Region, 2017-2022 (US$ Bn)
TABLE 28 Global Recycled Elastomers Market, by Infrastructure, By Region, 2023-2030 (US$ Bn)
TABLE 29 Global Recycled Elastomers Market, by Home & Garden, By Region, 2017-2022 (US$ Bn)
TABLE 30 Global Recycled Elastomers Market, by Home & Garden, By Region, 2023-2030 (US$ Bn)
TABLE 31 Global Recycled Elastomers Market, By Type, 2017-2022 (US$ Bn)
TABLE 32 Global Recycled Elastomers Market, By Type, 2023-2030 (US$ Bn)
TABLE 33 Global Recycled Elastomers Market, by Application, 2017-2022 (US$ Bn)
TABLE 34 Global Recycled Elastomers Market, by Application, 2023-2030 (US$ Bn)
TABLE 35 Global Recycled Elastomers Market, by Region, 2017-2022 (US$ Bn)
TABLE 36 Global Recycled Elastomers Market, by Region, 2023-2030 (US$ Bn)
TABLE 37 North America Recycled Elastomers Market, By Type, 2017-2022 (US$ Bn)
TABLE 38 North America Recycled Elastomers Market, By Type, 2023-2030 (US$ Bn)
TABLE 39 North America Recycled Elastomers Market, by Application, 2017-2022 (US$ Bn)
TABLE 40 North America Recycled Elastomers Market, by Application, 2023-2030 (US$ Bn)
TABLE 41 North America Recycled Elastomers Market, by Country, 2017-2022 (US$ Bn)
TABLE 42 North America Recycled Elastomers Market, by Country, 2023-2030 (US$ Bn)
TABLE 43 United States Recycled Elastomers Market, By Type, 2017-2022 (US$ Bn)
TABLE 44 United States Recycled Elastomers Market, By Type, 2023-2030 (US$ Bn)
TABLE 45 United States Recycled Elastomers Market, by Application, 2017-2022 (US$ Bn)
TABLE 46 United States Recycled Elastomers Market, by Application, 2023-2030 (US$ Bn)
TABLE 47 Canada Recycled Elastomers Market, By Type, 2017-2022 (US$ Bn)
TABLE 48 Canada Recycled Elastomers Market, By Type, 2023-2030 (US$ Bn)
TABLE 49 Canada Recycled Elastomers Market, by Application, 2017-2022 (US$ Bn)
TABLE 50 Canada Recycled Elastomers Market, by Application, 2023-2030 (US$ Bn)
TABLE 51 Mexico Recycled Elastomers Market, By Type, 2017-2022 (US$ Bn)
TABLE 52 Mexico Recycled Elastomers Market, By Type, 2023-2030 (US$ Bn)
TABLE 53 Mexico Recycled Elastomers Market, by Application, 2017-2022 (US$ Bn)
TABLE 54 Mexico Recycled Elastomers Market, by Application, 2023-2030 (US$ Bn)
TABLE 55 Europe Recycled Elastomers Market, By Type, 2017-2022 (US$ Bn)
TABLE 56 Europe Recycled Elastomers Market, By Type, 2023-2030 (US$ Bn)
TABLE 57 Europe Recycled Elastomers Market, by Application, 2017-2022 (US$ Bn)
TABLE 58 Europe Recycled Elastomers Market, by Application, 2023-2030 (US$ Bn)
TABLE 59 Europe Recycled Elastomers Market, by Country, 2017-2022 (US$ Bn)
TABLE 60 Europe Recycled Elastomers Market, by Country, 2023-2030 (US$ Bn)
TABLE 61 Germany Recycled Elastomers Market, By Type, 2017-2022 (US$ Bn)
TABLE 62 Germany Recycled Elastomers Market, By Type, 2023-2030 (US$ Bn)
TABLE 63 Germany Recycled Elastomers Market, by Application, 2017-2022 (US$ Bn)
TABLE 64 Germany Recycled Elastomers Market, by Application, 2023-2030 (US$ Bn)
TABLE 65 France Recycled Elastomers Market, By Type, 2017-2022 (US$ Bn)
TABLE 66 France Recycled Elastomers Market, By Type, 2023-2030 (US$ Bn)
TABLE 67 France Recycled Elastomers Market, by Application, 2017-2022 (US$ Bn)
TABLE 68 France Recycled Elastomers Market, by Application, 2023-2030 (US$ Bn)
TABLE 69 United Kingdom Recycled Elastomers Market, By Type, 2017-2022 (US$ Bn)
TABLE 70 United Kingdom Recycled Elastomers Market, By Type, 2023-2030 (US$ Bn)
TABLE 71 United Kingdom Recycled Elastomers Market, by Application, 2017-2022 (US$ Bn)
TABLE 72 United Kingdom Recycled Elastomers Market, by Application, 2023-2030 (US$ Bn)
TABLE 73 Italy Recycled Elastomers Market, By Type, 2017-2022 (US$ Bn)
TABLE 74 Italy Recycled Elastomers Market, By Type, 2023-2030 (US$ Bn)
TABLE 75 Italy Recycled Elastomers Market, by Application, 2017-2022 (US$ Bn)
TABLE 76 Italy Recycled Elastomers Market, by Application, 2023-2030 (US$ Bn)
TABLE 77 Spain Recycled Elastomers Market, By Type, 2017-2022 (US$ Bn)
TABLE 78 Spain Recycled Elastomers Market, By Type, 2023-2030 (US$ Bn)
TABLE 79 Spain Recycled Elastomers Market, by Application, 2017-2022 (US$ Bn)
TABLE 80 Spain Recycled Elastomers Market, by Application, 2023-2030 (US$ Bn)
TABLE 81 Rest of Europe Recycled Elastomers Market, By Type, 2017-2022 (US$ Bn)
TABLE 82 Rest of Europe Recycled Elastomers Market, By Type, 2023-2030 (US$ Bn)
TABLE 83 Rest of Europe Recycled Elastomers Market, by Application, 2017-2022 (US$ Bn)
TABLE 84 Rest of Europe Recycled Elastomers Market, by Application, 2023-2030 (US$ Bn)
TABLE 85 Asia Pacific Recycled Elastomers Market, By Type, 2017-2022 (US$ Bn)
TABLE 86 Asia Pacific Recycled Elastomers Market, By Type, 2023-2030 (US$ Bn)
TABLE 87 Asia Pacific Recycled Elastomers Market, by Application, 2017-2022 (US$ Bn)
TABLE 88 Asia Pacific Recycled Elastomers Market, by Application, 2023-2030 (US$ Bn)
TABLE 89 China Recycled Elastomers Market, By Type, 2017-2022 (US$ Bn)
TABLE 90 China Recycled Elastomers Market, By Type, 2023-2030 (US$ Bn)
TABLE 91 China Recycled Elastomers Market, by Application, 2017-2022 (US$ Bn)
TABLE 92 China Recycled Elastomers Market, by Application, 2023-2030 (US$ Bn)
TABLE 93 Japan Recycled Elastomers Market, By Type, 2017-2022 (US$ Bn)
TABLE 94 Japan Recycled Elastomers Market, By Type, 2023-2030 (US$ Bn)
TABLE 95 Japan Recycled Elastomers Market, by Application, 2017-2022 (US$ Bn)
TABLE 96 Japan Recycled Elastomers Market, by Application, 2023-2030 (US$ Bn)
TABLE 97 India Recycled Elastomers Market, By Type, 2017-2022 (US$ Bn)
TABLE 98 India Recycled Elastomers Market, By Type, 2023-2030 (US$ Bn)
TABLE 99 India Recycled Elastomers Market, by Application, 2017-2022 (US$ Bn)
TABLE 100 India Recycled Elastomers Market, by Application, 2023-2030 (US$ Bn)
TABLE 101 South Korea Recycled Elastomers Market, By Type, 2017-2022 (US$ Bn)
TABLE 102 South Korea Recycled Elastomers Market, By Type, 2023-2030 (US$ Bn)
TABLE 103 South Korea Recycled Elastomers Market, by Application, 2017-2022 (US$ Bn)
TABLE 104 South Korea Recycled Elastomers Market, by Application, 2023-2030 (US$ Bn)
TABLE 105 South-East Asia Recycled Elastomers Market, By Type, 2017-2022 (US$ Bn)
TABLE 106 South-East Asia Recycled Elastomers Market, By Type, 2023-2030 (US$ Bn)
TABLE 107 South-East Asia Recycled Elastomers Market, by Application, 2017-2022 (US$ Bn)
TABLE 108 South-East Asia Recycled Elastomers Market, by Application, 2023-2030 (US$ Bn)
TABLE 109 Rest of Asia Pacific Recycled Elastomers Market, By Type, 2017-2022 (US$ Bn)
TABLE 110 Rest of Asia Pacific Recycled Elastomers Market, By Type, 2023-2030 (US$ Bn)
TABLE 111 Rest of Asia Pacific Recycled Elastomers Market, by Application, 2017-2022 (US$ Bn)
TABLE 112 Rest of Asia Pacific Recycled Elastomers Market, by Application, 2023-2030 (US$ Bn)
TABLE 113 Latin America Recycled Elastomers Market, By Type, 2017-2022 (US$ Bn)
TABLE 114 Latin America Recycled Elastomers Market, By Type, 2023-2030 (US$ Bn)
TABLE 115 Latin America Recycled Elastomers Market, by Application, 2017-2022 (US$ Bn)
TABLE 116 Latin America Recycled Elastomers Market, by Application, 2023-2030 (US$ Bn)
TABLE 117 Brazil Recycled Elastomers Market, By Type, 2017-2022 (US$ Bn)
TABLE 118 Brazil Recycled Elastomers Market, By Type, 2023-2030 (US$ Bn)
TABLE 119 Brazil Recycled Elastomers Market, by Application, 2017-2022 (US$ Bn)
TABLE 120 Brazil Recycled Elastomers Market, by Application, 2023-2030 (US$ Bn)
TABLE 121 Argentina Recycled Elastomers Market, By Type, 2017-2022 (US$ Bn)
TABLE 122 Argentina Recycled Elastomers Market, By Type, 2023-2030 (US$ Bn)
TABLE 123 Argentina Recycled Elastomers Market, by Application, 2017-2022 (US$ Bn)
TABLE 124 Argentina Recycled Elastomers Market, by Application, 2023-2030 (US$ Bn)
TABLE 125 Rest of Latin America Recycled Elastomers Market, By Type, 2017-2022 (US$ Bn)
TABLE 126 Rest of Latin America Recycled Elastomers Market, By Type, 2023-2030 (US$ Bn)
TABLE 127 Rest of Latin America Recycled Elastomers Market, by Application, 2017-2022 (US$ Bn)
TABLE 128 Rest of Latin America Recycled Elastomers Market, by Application, 2023-2030 (US$ Bn)
TABLE 129 Middle East and Africa Recycled Elastomers Market, By Type, 2017-2022 (US$ Bn)
TABLE 130 Middle East and Africa Recycled Elastomers Market, By Type, 2023-2030 (US$ Bn)
TABLE 131 Middle East and Africa Recycled Elastomers Market, by Application, 2017-2022 (US$ Bn)
TABLE 132 Middle East and Africa Recycled Elastomers Market, by Application, 2023-2030 (US$ Bn)
TABLE 133 GCC Countries Recycled Elastomers Market, By Type, 2017-2022 (US$ Bn)
TABLE 134 GCC Countries Recycled Elastomers Market, By Type, 2023-2030 (US$ Bn)
TABLE 135 GCC Countries Recycled Elastomers Market, by Application, 2017-2022 (US$ Bn)
TABLE 136 GCC Countries Recycled Elastomers Market, by Application, 2023-2030 (US$ Bn)
TABLE 137 South Africa Recycled Elastomers Market, By Type, 2017-2022 (US$ Bn)
TABLE 138 South Africa Recycled Elastomers Market, By Type, 2023-2030 (US$ Bn)
TABLE 139 South Africa Recycled Elastomers Market, by Application, 2017-2022 (US$ Bn)
TABLE 140 South Africa Recycled Elastomers Market, by Application, 2023-2030 (US$ Bn)
TABLE 141 Rest of Middle East and Africa Recycled Elastomers Market, By Type, 2017-2022 (US$ Bn)
TABLE 142 Rest of Middle East and Africa Recycled Elastomers Market, By Type, 2023-2030 (US$ Bn)
TABLE 143 Rest of Middle East and Africa Recycled Elastomers Market, by Application, 2017-2022 (US$ Bn)
TABLE 144 Rest of Middle East and Africa Recycled Elastomers Market, by Application, 2023-2030 (US$ Bn)

Frequently Asked Questions:

How does COVID-19 Impact the global recycled elastomers market?

COVID-19 has had a major impact on the supply chain of the recycled elastomers market.

Which is the leading region of the recycled elastomers market?

Asia Pacific accounted for the most heightened global recycled elastomers market share.

What are the key drivers for the growth of the recycled elastomers market?

Growing demand in emerging countries is driving market growth.

Which is the major recycled elastomers market segment by type?

The styrene butadiene rubber segment had a major global market share in 2022.

Which is the major recycled elastomers market segment by application?

Agriculture had a major share in the global market.

Geosynthetics Market

Published:
Report ID: 36207

Laminated Veneer Lumber Market

Published:
Report ID: 35834

Radiation Shielding Materials Market

Published:
Report ID: 15703

Thermochromic Materials Market

Published:
Report ID: 11162

Smart Mirrors Market

Published:
Report ID: 10279

3D Printed Nanocellulose Market

Published:
Report ID: 34690

Aerospace Plastics Market

Published:
Report ID: 2684

Fire Protection Materials Market For Construction Market

Published:
Report ID: 33848

Metal Structural Insulation Panels Market

Published:
Report ID: 33811

Luxury Vinyl Tile Flooring Market

Published:
Report ID: 33784

Insulating Glass Window Market

Published:
Report ID: 33781

Nanocrystalline Soft Magnetic Materials Market

Published:
Report ID: 33739

Purchase Options

$2999
Delivery Format: Excel.
$4999
Designed for the individual purchaser.
$6999
Users located at a single corporate site or regional office.
$7999
Allowed for unlimited sharing globally within one company.
Smallform of Sample request

Have a question?

User Profile

Don’t settle for less – trust Mitul to help you find the best solution.

Report delivery within 24 to 48 hours

– Other Info –

What people say?-

User Review

I am very impressed with the information in this report. The author clearly did their research when they came up with this product and it has already given me a lot of ideas.

Jana Schmidt
CEDAR CX Technologies

– Connect with us –

Phone

+91 6232 49 3207


support

24/7 Research Support


sales@credenceresearch.com

– Research Methodology –

Going beyond the basics: advanced techniques in research methodology

– Trusted By –

Pepshi, LG, Nestle
Motorola, Honeywell, Johnson and johnson
LG Chem, SIEMENS, Pfizer
Unilever, Samsonite, QIAGEN