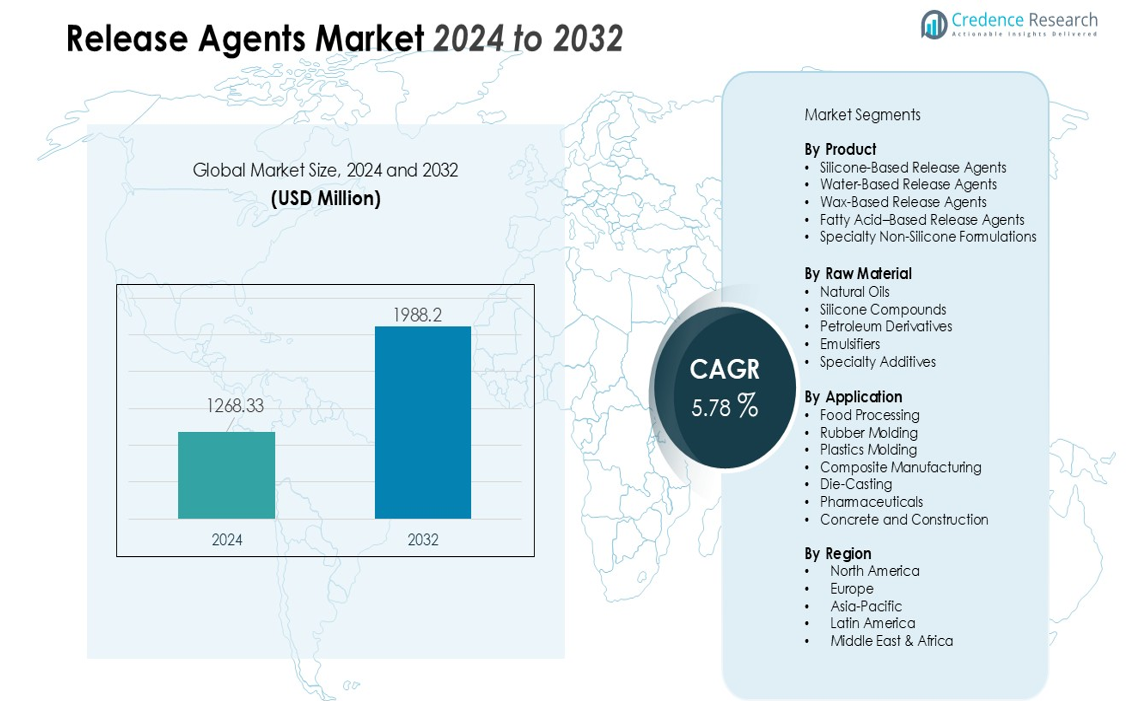
Home » Chemicals » Release Agents Market

Release Agents Market By Form (Solid and Liquid) By Ingredients (Vegetable oils, Emulsifiers, Wax & wax esters and Antioxidants) By Application (Bakery products, Confectionery products and Processed meat)-Growth, Future Prospects & Competitive Analysis, 2016 – 2030

Price: $4999

Published: | Report ID: 9188 | Report Format : PDF

Key Highlights of the Report

How are the major segments performing in the release agents market?

  • In 2022, the liquid segment accounted for the largest share of the market. Liquid-release chemicals are utilized more frequently in convenience foods, processed meat, candy, and baking.
  • In 2022, the vegetable oil segment was anticipated to hold a prominent share of the global release agents market. Vegetable oils are the raw material used to create release agents. Hence the cost of vegetable oils on the market affects the cost of release agent goods.
  • In 2022, the bakery products segment was anticipated to hold a prominent share of the global release agents market. Shorter production cycle times, decreased labor costs related to cleaning trays and pans, and rising consumer demand for baked goods are some of the reasons boosting the market for bakery products.

What is the market size of release agents regarding value?

The global release agents market is anticipated to grow at a substantial CAGR of 2.50% in the upcoming years. The global release agents industry was estimated to be worth USD 670.5 million in 2022 and was expected to be worth USD 805.6 million by 2030.

Design Element 2

Access crucial information at unmatched prices!

Request your free sample report today & start making informed decisions powered by Credence Research!

Download Free Sample
CTA Design Element 3

Which region dominated the release agents market?

In 2022, North America region was anticipated to hold a prominent share in the global release agents market because consuming releasing agents is becoming more popular and people are becoming more aware of its benefits. Rising consumer awareness, health concerns, increased sales of processed foods, and greater demand for natural ingredients are all factors impacting the developments in the North American market for release agents. The desire to snack between meals has increased, as has the demand for bakery and confectionery goods, convenience foods, dairy, and frozen goods.

Which are the key countries in the release agents market?

In 2022, the United States is anticipated to be a leading nation in market growth because of the expansion of the baking and confectionery sectors. Additionally, throughout the projected period, the release agents market in the country would rise due to the change in lifestyles and rising health consciousness in developing nations.

In 2022, China was anticipated to hold a prominent share in the global release agents market due to the significant players present, the increasing demand for baked goods, and the growing knowledge of the advantages of employing release agents. The market for releasing agents may be fueled by the changing lifestyles and rising health consciousness in China, an expanding country. These factors are anticipated to drive the rising consumption of baked goods. Additionally, alterations in lifestyle and greater health consciousness are decisive factors in the rise in consumption of baked products, which might therefore fuel demand in the launch market.

REPORT ATTRIBUTE DETAILS
Release Agents Market by Volume Yes
Release Agents Market by Value Yes
Release Agents Market, Tornado Analysis Yes
Release Agents Market, STAR Analysis Yes
Release Agents Market, SRC Analysis Yes
Release Agents Market, Import-Export Data Yes (On Demand)
Release Agents Market Pricing Analysis Yes (On Demand)
Release Agents Market Segment Analysis By Form (Solid and Liquid)

By Ingredients (Vegetable oils, Emulsifiers, Wax & wax esters and Antioxidants)

By Application (Bakery products, Confectionery products and Processed meat)

Release Agents Market, Regional Analysis North America (US, Canada, Mexico)

Europe (Germany, UK, France, Italy, Spain, and Rest of Europe)

Asia Pacific (China, India, Japan, South Korea, South East Asia, and Rest of Asia Pacific)

·         Latin America (Brazil, Argentina, and Rest of Latin America)

Middle East and Africa (GCC Countries, South Africa, and Rest of Middle East and Africa)

Release Agents Market Key Companies

Archer Daniels Midland Company (US), AAK AB (Sweden), Cargill (US), Dowdupont (US), Avatar Corporation (US), Par-Way Tryson Company (US), Associated British Foods PLC (UK), Mallet & Company, Inc. (US), Lecico GmbH (Germany), Lallemand (Canada)

Release Agents Market Competitive Landscape Market Share Analysis

Competitive Benchmarking

Key Players Market Positioning

Geographical Presence Analysis

Major Strategies Adopted

How is the economy impacting the global release agents growth?

The market was affected by COVID-19 due to the change in consumption patterns and the stockpiling of processed foods. Policies of social exclusion brought about by the epidemic and a decline in the supply of raw materials had a big impact on the market’s supply chain. Because of shifting consumer lives, busy schedules, and global health concerns, consumers are increasingly turning to processed foods for food safety and preservation. When food has been processed, such as when it has been cooked, dried, canned, or frozen, release agents are necessary to aid in the food’s separation from the pan, tray, and other packing materials.

What is the competitive environment of the release agents market?

The release agent market is fragmented because of many foreign and local vendors. The high level of market fragmentation causes strong competition and severe entry hurdles for new firms. The release agent sector is extremely competitive due to the many local and international businesses. Businesses can vary their product offers globally thanks to an advanced distribution network. Furthermore, businesses must innovate regularly to operate and grow in the market because consumer preferences and needs are changing frequently. For instance, ProKote 5022-AO, a water-miscible release agent for organic food processing units produced by Avatar Corp., will be allergen-free and exclusively include components obtained from natural sources starting in September 2020. It can withstand high processing temperatures, is combustible, and has a high flash point.

Executive Summary

What are the key trends in the Release agents market?

  • The bakery sector has changed significantly over the years due to digitization, shifting consumer behavior, and a push for rural growth. The bread and baking industries have recently experienced excessive growth due to the global release agent market. The Release Agent gives the bread a variety of hues, textures, and flavors while still being healthy. Premix bread flour has several benefits for manufacturers, including improved product dependability, lower labor and inventory costs, and a reduced chance of incorrect component weighing when processing bread products.

What effect has rising food consumption had on the market for releasing agents?

Release agents and parting agents, which are substances, separate the product from the mold, belt, or pan in manufacturing facilities. The area where the product will be placed is covered with a release agent to prevent the products from clinging to the surface due to the high heat and chemicals. This component also shields the food from absorbing pollutants from the surfaces it rests on. The increasing demand for release agents in production facilities strongly correlates with consumer convenience foods’ popularity. Convenience food products like spreads, sauces, RTE (Ready To Eat), bread and confectionery foods; additionally, technical advancements and the introduction of new products have made various applications for food release agents in the food and beverage industry conceivable, actively promoting the market growth. Baking aids like release agents are in greater demand because of the increased demand for bread-related products. Release agents are typically employed to prevent the adhesion of extraneous materials to primary products. The market is being driven by factors such as rising consumer awareness of health issues, a preference for components derived from natural sources, and innovation that is fueled by research & development.

Release Agents Market

Which are the key investments by the release agents’ market players?

Due to the rapidly changing consumer expectations and preferences, players need to innovate in order to stay competitive and grow consistently. The important players in the release agent market respond to customer demand by investing in new product launches globally and expanding their product lines to suit new trends.

Some major players in the release agents market are Archer Daniels Midland Company (US), AAK AB (Sweden), Cargill (US), Dowdupont (US), Avatar Corporation (US), Par-Way Tryson Company (US), Associated British Foods PLC (UK), Mallet & Company, Inc. (US), Lecico GmbH (Germany), Lallemand (Canada).

What are the major driving factors for the release agents market?

The market for release agents is developing quickly due to their high physical stability, the convenience of use when sprayed on, and the use of natural or organic agents, both of which are advantageous to release agents and the demand for bakery items. Additionally, as eating habits change and industrial food production rise, the market for release agents is projected to expand. The surge in demand for natural sources of components is another factor projected to fuel market growth for release agents. The innovation-spurring research and development is expected to protect the market for release agents. Furthermore, in the near years, developing nations with significant potential for food release agents will probably offer more opportunities for the market to grow.

What are the Major Risks for the Release Agents Market?

The potential for release agents to react with food or surfaces, adverse effects on the flavor and odor of food, release agent allergies, and strict government health and safety requirements may all hinder the market growth for release agents in the near future. The price of the raw materials used to create releasing agents is unpredictable, which causes uncertainty. The cost of raw materials impacts both the release price and the finished product’s cost. There was a lack of raw materials due to weather fluctuations, which raised prices. Another factor influencing commodity pricing is the fluctuation in crude oil prices on the world market.

Which is the key application in the release agents market?

The bakery release agent dominates the market with various categories, including trough grease, divider oil, pan grease, bread pan oil and specialty release agents. These substances assist in eliminating sticking points, hydrophobizing molds or trays, and forming an unbroken layer between surfaces. In vegetable oils, fatty acids support polymerization and oxidation stability. With the growth of the bakery industry, demand for baking aids such as release agents has increased. Millennials’ rising desire for “on-the-go” meal options has benefited the global bread sector.

How is the release agents market performing in regions?

Throughout the predicted period, it is anticipated that the Asia Pacific region will increase quickly and maintain its dominance due to the growth of the baking and confectionery industries. The changing lifestyles and rising health consciousness in emerging nations were also expected to increase the market for release agents over the forecast period. Additionally, the Asia Pacific region’s growing processed food production and consumer awareness are creating a sizeable market for release agents.

What is the regulatory landscape for the release agents market?

Over the course of the projection period, it is anticipated that the Middle East’s expanding refining capacity will enhance the supply of motor and fuel oils and, as a result, the availability of raw materials for market participants. To increase the nation’s chemical output from 3% in 2014 to 6% in 2020, the Indian government unveiled the Draught National Chemical Policy in September 2013. Throughout the forecast, new market possibilities for manufacturers are anticipated as a result of this regulation change. The Ecoratio Company, based in the United Kingdom, creates environmentally friendly release agents for concrete applications, claiming they work well in various climates and production processes.

Shape Your Report to Specific Countries or Regions & Enjoy 30% Off!

What are the major players planning for the future of the release agents market?

Due to increased research and development, release agents are currently widely employed in the medicines, concrete, personal care, food processing, metal, plastic, and rubber industries. The growing infrastructure will drive the demand for releasing agents in the concrete and asphalt sectors, creating attractive prospects for the releasing agent market. The need for release agents will rise as a result of the food processing business, which will also benefit from the spread of Western culinary culture in Asia, the Middle East, and Africa.

Segmentation of Global Release Agents Market-

Global Release Agents Market – By Form

  • Solid
  • Liquid

Global Release Agents Market – By Ingredients

  • Vegetable oils
  • Emulsifiers
  • Wax & wax esters
  • Antioxidants

Global Release Agents Market – By Application

  • Bakery products
  • Confectionery products
  • Processed meat

Global Release Agents Market – By Region

  • North America
    • U.S
    • Canada
    • Mexico
  • Europe
    • Germany
    • France
    • U.K.
    • Italy
    • Spain
    • Rest of Europe
  • Asia Pacific
    • China
    • Japan
    • India
    • South Korea
    • South-east Asia
    • Rest of Asia Pacific
  • Latin America
    • Brazil
    • Argentina
    • Rest of Latin America
  • Middle East & Africa
    • GCC Countries
    • South Africa
    • Rest of Middle East and Africa

1. Preface
1.1. Report Description
1.1.1. Purpose of the Report
1.1.2. Target Audience
1.1.3. USP and Key Offerings
1.2. Research Scope
1.3. Research Methodology
1.3.1. Phase I – Secondary Research
1.3.2. Phase II – Data Modelling
1.3.2.1. Company Share Analysis Model
1.3.2.2. Revenue Based Modelling
1.3.3. Phase III – Primary Research
1.3.4. Research Limitations
1.3.5. Assumptions
1.4. Market Introduction
1.5. Market Research Scope

2. Executive Summary
2.1. Market Snapshot: Global Release Agents Market
2.2. Global Release Agents Market, By Form
2.3. Global Release Agents Market, By Ingredients
2.4. Global Release Agents Market, By Application
2.5. Global Release Agents Market, By Region

3. Market Dynamics & Factors Analysis
3.1. Introduction
3.1.1. Global Release Agents Market Value, 2017-2030, (US$ Mn)
3.1.2. Global Release Agents Market Volume, 2017-2030, (Kilo Tons)
3.1.3. Y-o-Y Growth Trend Analysis
3.2. Market Dynamics
3.2.1. Market Drivers
3.2.1.1. Driver 1
3.2.1.2. Driver 2
3.2.1.3. Driver 3
3.2.2. Market Restraints
3.2.2.1. Restraint 1
3.2.2.2. Restraint 2
3.2.3. Market Opportunities
3.2.3.1. Opportunity 1
3.2.3.2. Opportunity 2
3.2.4. Major Industry Challenges
3.2.4.1. Challenge 1
3.2.4.2. Challenge 2
3.3. Growth and Development Patterns
3.4. Investment Feasibility Analysis
3.5. Market Opportunity Analysis
3.5.1. Form
3.5.2. Ingredients
3.5.3. Application
3.5.4. Geography

4. Premium Insights
4.1. STAR (Situation, Task, Action, Results) Analysis
4.2. Porter’s Five Forces Analysis
4.2.1. Threat of New Entrants
4.2.2. Bargaining Power of Buyers/Consumers
4.2.3. Bargaining Power of Suppliers
4.2.4. Threat of Substitute Types
4.2.5. Intensity of Competitive Rivalry
4.3. Key Market Trends
4.3.1. Demand Side Trends
4.3.2. Supply Side Trends
4.4. Value Chain Analysis
4.5. Technology Analysis
4.6. Analysis and Recommendations
4.7. Marketing Strategy Analysis
4.7.1. Direct Marketing
4.7.2. Indirect Marketing
4.7.3. Marketing Channel Development Trend

5. Import Export Analysis
5.1. Import Analysis by Region
5.1.1. Global Release Agents Market Import Volume, By Region, 2017-2022 (Kilo Tons)
5.2. Export Analysis by Region
5.2.1. Global Release Agents Market Export Volume, By Region, 2017-2022 (Kilo Tons)

6. Demand-Supply Analysis
6.1. Demand Analysis by Region
6.1.1. Global Release Agents Market Demand Volume, By Region, 2017-2022 (Kilo Tons)
6.2. Supply Analysis by Region
6.2.1. Global Release Agents Market Supply Volume, By Region, 2017-2022 (Kilo Tons)

7. Pricing Analysis
7.1. Average Price of Release Agents by Region, 2017-2022 (USD/Unit)
7.2. Average Price of Release Agents by Region, 2023-2030 (USD/Unit)

8. Market Positioning of Key Players, 2022
8.1. Company market share of key players, 2022
8.2. Competitive Benchmarking
8.3. Market Positioning of Key Vendors
8.4. Geographical Presence Analysis
8.5. Major Strategies Adopted by Key Players
8.5.1. Key Strategies Analysis
8.5.2. Mergers and Acquisitions
8.5.3. Partnerships
8.5.4. Product Launch
8.5.5. Geographical Expansion
8.5.6. Others

9. Economic Impact Analysis
9.1. Recession Impact
9.1.1. North America
9.1.2. Europe
9.1.3. Asia Pacific
9.1.4. Latin America
9.1.5. Middle East and Africa
9.2. Ukraine-Russia War Impact
9.2.1. North America
9.2.2. Europe
9.2.3. Asia Pacific
9.2.4. Latin America
9.2.5. Middle East and Africa
9.3. COVID-19 Impact Analysis
9.3.1. North America
9.3.2. Europe
9.3.3. Asia Pacific
9.3.4. Latin America
9.3.5. Middle East and Africa

10. Global Release Agents Market, By Form
10.1. Global Release Agents Market Overview, by Form
10.1.1. Global Release Agents Market Revenue Share, By Form, 2022 Vs 2030 (in %)
10.1.2. Global Release Agents Market Volume Share, By Form, 2022 Vs 2030 (in %)
10.2. Solid
10.2.1. Global Release Agents Market, By Region, 2017-2030 (US$ Mn)
10.2.2. Global Release Agents Market, By Region, 2017-2030 (Kilo Tons)
10.3. Liquid
10.3.1. Global Release Agents Market, By Region, 2017-2030 (US$ Mn)
10.3.2. Global Release Agents Market, By Region, 2017-2030 (Kilo Tons)

11. Global Release Agents Market, By Ingredients
11.1. Global Release Agents Market Overview, by Ingredients
11.1.1. Global Release Agents Market, By Ingredients, 2022 vs 2030 (in %)
11.2. Vegetable Oils
11.2.1. Global Release Agents Market, By Region, 2017-2030 (US$ Mn)
11.2.2. Global Release Agents Market, By Region, 2017-2030 (Kilo Tons)
11.3. Emulsifiers
11.3.1. Global Release Agents Market, By Region, 2017-2030 (US$ Mn)
11.3.2. Global Release Agents Market, By Region, 2017-2030 (Kilo Tons)
11.4. Wax & Wax Esters
11.4.1. Global Release Agents Market, By Region, 2017-2030 (US$ Mn)
11.4.2. Global Release Agents Market, By Region, 2017-2030 (Kilo Tons)
11.5. Antioxidants
11.5.1. Global Release Agents Market, By Region, 2017-2030 (US$ Mn)
11.5.2. Global Release Agents Market, By Region, 2017-2030 (Kilo Tons)

12. Global Release Agents Market, by Application, 2017-2030 (US$ Mn)
12.1. Global Release Agents Market Overview, by Application
12.1.1. Global Release Agents Market, By Application, 2022 vs 2030 (in%)
12.2. Bakery Products
12.2.1. Global Release Agents Market, By Region, 2017-2030 (US$ Mn)
12.2.2. Global Release Agents Market, By Region, 2017-2030 (Kilo Tons)
12.3. Confectionery Products
12.3.1. Global Release Agents Market, By Region, 2017-2030 (US$ Mn)
12.3.2. Global Release Agents Market, By Region, 2017-2030 (Kilo Tons)
12.4. Processed Meat
12.4.1. Global Release Agents Market, By Region, 2017-2030 (US$ Mn)
12.4.2. Global Release Agents Market, By Region, 2017-2030 (Kilo Tons)

13. Global Release Agents Market, By Region
13.1. Global Release Agents Market Overview, by Region
13.1.1. Global Release Agents Market Revenue, By Region, 2022 vs 2030 (in%)
13.1.2. Global Release Agents Market Volume, By Region, 2022 vs 2030 (in%)
13.2. Form
13.2.1. Global Release Agents Market, By Form, 2017-2030 (US$ Mn)
13.2.2. Global Release Agents Market, By Form, 2017-2030 (Kilo Tons)
13.3. Ingredients
13.3.1. Global Release Agents Market, By Ingredients, 2017-2030 (US$ Mn)
13.3.2. Global Release Agents Market, By Ingredients, 2017-2030 (Kilo Tons)
13.4. Application
13.4.1. Global Release Agents Market, By Application, 2017-2030 (US$ Mn)
13.4.2. Global Release Agents Market, By Application, 2017-2030 (Kilo Tons)

14. North America Release Agents Market Analysis
14.1. North America Release Agents Market, by Form, 2017-2030 (US$ Mn)
14.1.1. Overview
14.1.2. SRC Analysis
14.2. North America Release Agents Market, by Form, 2017-2030(Kilo Tons)
14.2.1. Overview
14.2.2. SRC Analysis
14.3. North America Release Agents Market, by Ingredients, 2017-2030 (US$ Mn)
14.3.1. Overview
14.3.2. SRC Analysis
14.4. North America Release Agents Market, by Ingredients, 2017-2030(Kilo Tons)
14.4.1. Overview
14.4.2. SRC Analysis
14.5. North America Release Agents Market, by Application, 2017-2030 (US$ Mn)
14.5.1. Overview
14.5.2. SRC Analysis
14.6. North America Release Agents Market, by Application, 2017-2030 (Kilo Tons)
14.6.1. Overview
14.6.2. SRC Analysis
14.7. North America Release Agents Market, by Country, 2017-2030 (US$ Mn)
14.7.1. North America Release Agents Market Revenue, by Country, 2022 Vs 2030 (in%)
14.7.2. North America Release Agents Market Volume, by Country, 2022 Vs 2030 (in%)
14.7.3. U.S.
14.7.3.1. U.S. Release Agents Market Estimates and Forecast, 2017-2030 (US$ Mn)
14.7.3.2. U.S. Release Agents Market Estimates and Forecast, 2017-2030 (Kilo Tons)
14.7.3.3. U.S. Release Agents, By Form, 2017-2030 (US$ Mn)
14.7.3.4. U.S. Release Agents, By Form, 2017-2030 (Kilo Tons)
14.7.3.5. U.S. Release Agents, By Ingredients, 2017-2030 (US$ Mn)
14.7.3.6. U.S. Release Agents, By Ingredients, 2017-2030 (Kilo Tons)
14.7.3.7. U.S. Release Agents, By Application, 2017-2030 (US$ Mn)
14.7.3.8. U.S. Release Agents, By Application, 2017-2030 (Kilo Tons)
14.7.4. Canada
14.7.4.1. Canada Release Agents Market Estimates and Forecast, 2017-2030 (US$ Mn)
14.7.4.2. Canada Release Agents Market Estimates and Forecast, 2017-2030 (Kilo Tons)
14.7.4.3. Canada Release Agents, By Form, 2017-2030 (US$ Mn)
14.7.4.4. Canada Release Agents, By Form, 2017-2030 (Kilo Tons)
14.7.4.5. Canada Release Agents, By Ingredients, 2017-2030 (US$ Mn)
14.7.4.6. Canada Release Agents, By Ingredients, 2017-2030 (Kilo Tons)
14.7.4.7. Canada Release Agents, By Application, 2017-2030 (US$ Mn)
14.7.4.8. Canada Release Agents, By Application, 2017-2030 (Kilo Tons)
14.7.5. Mexico
14.7.5.1. Mexico Release Agents Market Estimates and Forecast, 2017-2030 (US$ Mn)
14.7.5.2. Mexico Release Agents Market Estimates and Forecast, 2017-2030 (Kilo Tons)
14.7.5.3. Mexico Release Agents, By Form, 2017-2030 (US$ Mn)
14.7.5.4. Mexico Release Agents, By Form, 2017-2030 (Kilo Tons)
14.7.5.5. Mexico Release Agents, By Ingredients, 2017-2030 (US$ Mn)
14.7.5.6. Mexico Release Agents, By Ingredients, 2017-2030 (Kilo Tons)
14.7.5.7. Mexico Release Agents, By Application, 2017-2030 (US$ Mn)
14.7.5.8. Mexico Release Agents, By Application, 2017-2030 (Kilo Tons)

15. Europe Release Agents Market Analysis
15.1. Europe Release Agents Market, by Form, 2017-2030 (US$ Mn)
15.1.1. Overview
15.1.2. SRC Analysis
15.2. Europe Release Agents Market, by Form, 2017-2030(Kilo Tons)
15.2.1. Overview
15.2.2. SRC Analysis
15.3. Europe Release Agents Market, by Ingredients, 2017-2030 (US$ Mn)
15.3.1. Overview
15.3.2. SRC Analysis
15.4. Europe Release Agents Market, by Ingredients, 2017-2030(Kilo Tons)
15.4.1. Overview
15.4.2. SRC Analysis
15.5. Europe Release Agents Market, by Application, 2017-2030 (US$ Mn)
15.5.1. Overview
15.5.2. SRC Analysis
15.6. Europe Release Agents Market, by Application, 2017-2030(Kilo Tons)
15.6.1. Overview
15.6.2. SRC Analysis
15.7. Europe Release Agents Market, by Country, 2017-2030 (US$ Mn)
15.7.1. Europe Release Agents Market Revenue, by Country, 2022 Vs 2030 (in%)
15.7.2. Europe Release Agents Market Volume, by Country, 2022 Vs 2030 (in%)
15.7.3. Germany
15.7.3.1. Germany Release Agents Market Estimates and Forecast, 2017-2030 (US$ Mn)
15.7.3.2. Germany Release Agents Market Estimates and Forecast, 2017-2030 (Kilo Tons)
15.7.3.3. Germany Release Agents, By Form, 2017-2030 (US$ Mn)
15.7.3.4. Germany Release Agents, By Form, 2017-2030 (Kilo Tons)
15.7.3.5. Germany Release Agents, By Ingredients, 2017-2030 (US$ Mn)
15.7.3.6. Germany Release Agents, By Ingredients, 2017-2030 (Kilo Tons)
15.7.3.7. Germany Release Agents, By Application, 2017-2030 (US$ Mn)
15.7.3.8. Germany Release Agents, By Application, 2017-2030 (Kilo Tons)
15.7.4. France
15.7.4.1. France Release Agents Market Estimates and Forecast, 2017-2030 (US$ Mn)
15.7.4.2. France Release Agents Market Estimates and Forecast, 2017-2030 (Kilo Tons)
15.7.4.3. France Release Agents, By Form, 2017-2030 (US$ Mn)
15.7.4.4. France Release Agents, By Form, 2017-2030 (Kilo Tons)
15.7.4.5. France Release Agents, By Ingredients, 2017-2030 (US$ Mn)
15.7.4.6. France Release Agents, By Ingredients, 2017-2030 (Kilo Tons)
15.7.4.7. France Release Agents, By Application, 2017-2030 (US$ Mn)
15.7.4.8. France Release Agents, By Application, 2017-2030 (Kilo Tons)
15.7.5. U.K.
15.7.5.1. U.K. Release Agents Market Estimates and Forecast, 2017-2030 (US$ Mn)
15.7.5.2. U.K. Release Agents Market Estimates and Forecast, 2017-2030 (Kilo Tons)
15.7.5.3. U.K. Release Agents, By Form, 2017-2030 (US$ Mn)
15.7.5.4. U.K. Release Agents, By Form, 2017-2030 (Kilo Tons)
15.7.5.5. U.K. Release Agents, By Ingredients, 2017-2030 (US$ Mn)
15.7.5.6. U.K. Release Agents, By Ingredients, 2017-2030 (Kilo Tons)
15.7.5.7. U.K. Release Agents, By Application, 2017-2030 (US$ Mn)
15.7.5.8. U.K. Release Agents, By Application, 2017-2030 (Kilo Tons)
15.7.6. Italy
15.7.6.1. Italy Release Agents Market Estimates and Forecast, 2017-2030 (US$ Mn)
15.7.6.2. Italy Release Agents Market Estimates and Forecast, 2017-2030 (Kilo Tons)
15.7.6.3. Italy Release Agents, By Form, 2017-2030 (US$ Mn)
15.7.6.4. Italy Release Agents, By Form, 2017-2030 (Kilo Tons)
15.7.6.5. Italy Release Agents, By Ingredients, 2017-2030 (US$ Mn)
15.7.6.6. Italy Release Agents, By Ingredients, 2017-2030 (Kilo Tons)
15.7.6.7. Italy Release Agents, By Application, 2017-2030 (US$ Mn)
15.7.6.8. Italy Release Agents, By Application, 2017-2030 (Kilo Tons)
15.7.7. Spain
15.7.7.1. Spain Release Agents Market Estimates and Forecast, 2017-2030 (US$ Mn)
15.7.7.2. Spain Release Agents Market Estimates and Forecast, 2017-2030 (Kilo Tons)
15.7.7.3. Spain Release Agents, By Form, 2017-2030 (US$ Mn)
15.7.7.4. Spain Release Agents, By Form, 2017-2030 (Kilo Tons)
15.7.7.5. Spain Release Agents, By Ingredients, 2017-2030 (US$ Mn)
15.7.7.6. Spain Release Agents, By Ingredients, 2017-2030 (Kilo Tons)
15.7.7.7. Spain Release Agents, By Application, 2017-2030 (US$ Mn)
15.7.7.8. Spain Release Agents, By Application, 2017-2030 (Kilo Tons)
15.7.8. Rest of Europe
15.7.8.1. Rest of Europe Release Agents Market Estimates and Forecast, 2017-2030 (US$ Mn)
15.7.8.2. Rest of Europe Release Agents Market Estimates and Forecast, 2017-2030 (Kilo Tons)
15.7.8.3. Rest of Europe Release Agents, By Form, 2017-2030 (US$ Mn)
15.7.8.4. Rest of Europe Release Agents, By Form, 2017-2030 (Kilo Tons)
15.7.8.5. Rest of Europe Release Agents, By Ingredients, 2017-2030 (US$ Mn)
15.7.8.6. Rest of Europe Release Agents, By Ingredients, 2017-2030 (Kilo Tons)
15.7.8.7. Rest of Europe Release Agents, By Application, 2017-2030 (US$ Mn)
15.7.8.8. Rest of Europe Release Agents, By Application, 2017-2030 (Kilo Tons)

16. Asia Pacific Release Agents Market Analysis
16.1. Asia Pacific Release Agents Market, by Form, 2017-2030 (US$ Mn)
16.1.1. Overview
16.1.2. SRC Analysis
16.2. Asia Pacific Release Agents Market, by Form, 2017-2030(Kilo Tons)
16.2.1. Overview
16.2.2. SRC Analysis
16.3. Asia Pacific Release Agents Market, by Ingredients, 2017-2030 (US$ Mn)
16.3.1. Overview
16.3.2. SRC Analysis
16.4. Asia Pacific Release Agents Market, by Ingredients, 2017-2030(Kilo Tons)
16.4.1. Overview
16.4.2. SRC Analysis
16.5. Asia Pacific Release Agents Market, by Application, 2017-2030 (US$ Mn)
16.5.1. Overview
16.5.2. SRC Analysis
16.6. Asia Pacific Release Agents Market, by Application, 2017-2030(Kilo Tons)
16.6.1. Overview
16.6.2. SRC Analysis
16.7. Asia Pacific Release Agents Market, by Country, 2017-2030 (US$ Mn)
16.7.1. Asia Pacific Release Agents Market Revenue, by Country, 2022 Vs 2030 (in%)
16.7.2. Asia Pacific Release Agents Market Volume, by Country, 2022 Vs 2030 (in%)
16.7.3. China
16.7.3.1. China Release Agents Market Estimates and Forecast, 2017-2030 (US$ Mn)
16.7.3.2. China Release Agents Market Estimates and Forecast, 2017-2030 (Kilo Tons)
16.7.3.3. China Release Agents, By Form, 2017-2030 (US$ Mn)
16.7.3.4. China Release Agents, By Form, 2017-2030 (Kilo Tons)
16.7.3.5. China Release Agents, By Ingredients, 2017-2030 (US$ Mn)
16.7.3.6. China Release Agents, By Ingredients, 2017-2030 (Kilo Tons)
16.7.3.7. China Release Agents, By Application, 2017-2030 (US$ Mn)
16.7.3.8. China Release Agents, By Application, 2017-2030 (Kilo Tons)
16.7.4. Japan
16.7.4.1. Japan Release Agents Market Estimates and Forecast, 2017-2030 (US$ Mn)
16.7.4.2. Japan Release Agents Market Estimates and Forecast, 2017-2030 (Kilo Tons)
16.7.4.3. Japan Release Agents, By Form, 2017-2030 (US$ Mn)
16.7.4.4. Japan Release Agents, By Form, 2017-2030 (Kilo Tons)
16.7.4.5. Japan Release Agents, By Ingredients, 2017-2030 (US$ Mn)
16.7.4.6. Japan Release Agents, By Ingredients, 2017-2030 (Kilo Tons)
16.7.4.7. Japan Release Agents, By Application, 2017-2030 (US$ Mn)
16.7.4.8. Japan Release Agents, By Application, 2017-2030 (Kilo Tons)
16.7.5. India
16.7.5.1. India Release Agents Market Estimates and Forecast, 2017-2030 (US$ Mn)
16.7.5.2. India Release Agents Market Estimates and Forecast, 2017-2030 (Kilo Tons)
16.7.5.3. India Release Agents, By Form, 2017-2030 (US$ Mn)
16.7.5.4. India Release Agents, By Form, 2017-2030 (Kilo Tons)
16.7.5.5. India Release Agents, By Ingredients, 2017-2030 (US$ Mn)
16.7.5.6. India Release Agents, By Ingredients, 2017-2030 (Kilo Tons)
16.7.5.7. India Release Agents, By Application, 2017-2030 (US$ Mn)
16.7.5.8. India Release Agents, By Application, 2017-2030 (Kilo Tons)
16.7.6. South Korea
16.7.6.1. South Korea Release Agents Market Estimates and Forecast, 2017-2030 (US$ Mn)
16.7.6.2. South Korea Release Agents Market Estimates and Forecast, 2017-2030 (Kilo Tons)
16.7.6.3. South Korea Release Agents, By Form, 2017-2030 (US$ Mn)
16.7.6.4. South Korea Release Agents, By Form, 2017-2030 (Kilo Tons)
16.7.6.5. South Korea Release Agents, By Ingredients, 2017-2030 (US$ Mn)
16.7.6.6. South Korea Release Agents, By Ingredients, 2017-2030 (Kilo Tons)
16.7.6.7. South Korea Release Agents, By Application, 2017-2030 (US$ Mn)
16.7.6.8. South Korea Release Agents, By Application, 2017-2030 (Kilo Tons)
16.7.7. South-East Asia
16.7.7.1. South-East Asia Release Agents Market Estimates and Forecast, 2017-2030 (US$ Mn)
16.7.7.2. South-East Asia Release Agents Market Estimates and Forecast, 2017-2030 (Kilo Tons)
16.7.7.3. South-East Asia Release Agents, By Form, 2017-2030 (US$ Mn)
16.7.7.4. South-East Asia Release Agents, By Form, 2017-2030 (Kilo Tons)
16.7.7.5. South-East Asia Release Agents, By Ingredients, 2017-2030 (US$ Mn)
16.7.7.6. South-East Asia Release Agents, By Ingredients, 2017-2030 (Kilo Tons)
16.7.7.7. South-East Asia Release Agents, By Application, 2017-2030 (US$ Mn)
16.7.7.8. South-East Asia Release Agents, By Application, 2017-2030 (Kilo Tons)
16.7.8. Rest of Asia Pacific
16.7.8.1. Rest of Asia Pacific Release Agents Market Estimates and Forecast, 2017-2030 (US$ Mn)
16.7.8.2. Rest of Asia Pacific Release Agents Market Estimates and Forecast, 2017-2030 (Kilo Tons)
16.7.8.3. Rest of Asia Pacific Release Agents, By Form, 2017-2030 (US$ Mn)
16.7.8.4. Rest of Asia Pacific Release Agents, By Form, 2017-2030 (Kilo Tons)
16.7.8.5. Rest of Asia Pacific Release Agents, By Ingredients, 2017-2030 (US$ Mn)
16.7.8.6. Rest of Asia Pacific Release Agents, By Ingredients, 2017-2030 (Kilo Tons)
16.7.8.7. Rest of Asia Pacific Release Agents, By Application, 2017-2030 (US$ Mn)
16.7.8.8. Rest of Asia Pacific Release Agents, By Application, 2017-2030 (Kilo Tons)

17. Latin America Release Agents Market Analysis
17.1. Latin America Release Agents Market, by Form, 2017-2030 (US$ Mn)
17.1.1. Overview
17.1.2. SRC Analysis
17.2. Latin America Release Agents Market, by Form, 2017-2030(Kilo Tons)
17.2.1. Overview
17.2.2. SRC Analysis
17.3. Latin America Release Agents Market, by Ingredients, 2017-2030 (US$ Mn)
17.3.1. Overview
17.3.2. SRC Analysis
17.4. Latin America Release Agents Market, by Ingredients, 2017-2030(Kilo Tons)
17.4.1. Overview
17.4.2. SRC Analysis
17.5. Latin America Release Agents Market, by Application, 2017-2030 (US$ Mn)
17.5.1. Overview
17.5.2. SRC Analysis
17.6. Latin America Release Agents Market, by Application, 2017-2030(Kilo Tons)
17.6.1. Overview
17.6.2. SRC Analysis
17.7. Latin America Release Agents Market, by Country, 2017-2030 (US$ Mn)
17.7.1. Latin America Release Agents Market Revenue, by Country, 2022 Vs 2030 (in%)
17.7.2. Latin America Release Agents Market Volume, by Country, 2022 Vs 2030 (in%)
17.7.3. Brazil
17.7.3.1. Brazil Release Agents Market Estimates and Forecast, 2017-2030 (US$ Mn)
17.7.3.2. Brazil Release Agents Market Estimates and Forecast, 2017-2030 (Kilo Tons)
17.7.3.3. Brazil Release Agents, By Form, 2017-2030 (US$ Mn)
17.7.3.4. Brazil Release Agents, By Form, 2017-2030 (Kilo Tons)
17.7.3.5. Brazil Release Agents, By Ingredients, 2017-2030 (US$ Mn)
17.7.3.6. Brazil Release Agents, By Ingredients, 2017-2030 (Kilo Tons)
17.7.3.7. Brazil Release Agents, By Application, 2017-2030 (US$ Mn)
17.7.3.8. Brazil Release Agents, By Application, 2017-2030 (Kilo Tons)
17.7.4. Argentina
17.7.4.1. Argentina Release Agents Market Estimates and Forecast, 2017-2030 (US$ Mn)
17.7.4.2. Argentina Release Agents Market Estimates and Forecast, 2017-2030 (Kilo Tons)
17.7.4.3. Argentina Release Agents, By Form, 2017-2030 (US$ Mn)
17.7.4.4. Argentina Release Agents, By Form, 2017-2030 (Kilo Tons)
17.7.4.5. Argentina Release Agents, By Ingredients, 2017-2030 (US$ Mn)
17.7.4.6. Argentina Release Agents, By Ingredients, 2017-2030 (Kilo Tons)
17.7.4.7. Argentina Release Agents, By Application, 2017-2030 (US$ Mn)
17.7.4.8. Argentina Release Agents, By Application, 2017-2030 (Kilo Tons)
17.7.5. Rest of Latin America
17.7.5.1. Rest of Latin America Release Agents Market Estimates and Forecast, 2017-2030 (US$ Mn)
17.7.5.2. Rest of Latin America Release Agents Market Estimates and Forecast, 2017-2030 (Kilo Tons)
17.7.5.3. Rest of Latin America Release Agents, By Form, 2017-2030 (US$ Mn)
17.7.5.4. Rest of Latin America Release Agents, By Form, 2017-2030 (Kilo Tons)
17.7.5.5. Rest of Latin America Release Agents, By Ingredients, 2017-2030 (US$ Mn)
17.7.5.6. Rest of Latin America Release Agents, By Ingredients, 2017-2030 (Kilo Tons)
17.7.5.7. Rest of Latin America Release Agents, By Application, 2017-2030 (US$ Mn)
17.7.5.8. Rest of Latin America Release Agents, By Application, 2017-2030 (Kilo Tons)

18. Middle East and Africa Release Agents Market Analysis
18.1. Middle East and Africa Release Agents Market, by Form, 2017-2030 (US$ Mn)
18.1.1. Overview
18.1.2. SRC Analysis
18.2. Middle East and Africa Release Agents Market, by Form, 2017-2030(Kilo Tons)
18.2.1. Overview
18.2.2. SRC Analysis
18.3. Middle East and Africa Release Agents Market, by Ingredients, 2017-2030 (US$ Mn)
18.3.1. Overview
18.3.2. SRC Analysis
18.4. Middle East and Africa Release Agents Market, by Ingredients, 2017-2030(Kilo Tons)
18.4.1. Overview
18.4.2. SRC Analysis
18.5. Middle East and Africa Release Agents Market, by Application, 2017-2030 (US$ Mn)
18.5.1. Overview
18.5.2. SRC Analysis
18.6. Middle East and Africa Release Agents Market, by Application, 2017-2030(Kilo Tons)
18.6.1. Overview
18.6.2. SRC Analysis
18.7. Middle East and Africa Release Agents Market, by Country, 2017-2030 (US$ Mn)
18.7.1. Middle East and Africa Release Agents Market Revenue, by Country, 2022 Vs 2030 (in%)
18.7.2. Middle East and Africa Release Agents Market Volume, by Country, 2022 Vs 2030 (in%)
18.7.3. GCC Countries
18.7.3.1. GCC Countries Release Agents Market Estimates and Forecast, 2017-2030 (US$ Mn)
18.7.3.2. GCC Countries Release Agents Market Estimates and Forecast, 2017-2030 (Kilo Tons)
18.7.3.3. GCC Countries Release Agents, By Form, 2017-2030 (US$ Mn)
18.7.3.4. GCC Countries Release Agents, By Form, 2017-2030 (Kilo Tons)
18.7.3.5. GCC Countries Release Agents, By Ingredients, 2017-2030 (US$ Mn)
18.7.3.6. GCC Countries Release Agents, By Ingredients, 2017-2030 (Kilo Tons)
18.7.3.7. GCC Countries Release Agents, By Application, 2017-2030 (US$ Mn)
18.7.3.8. GCC Countries Release Agents, By Application, 2017-2030 (Kilo Tons)
18.7.4. South Africa
18.7.4.1. South Africa Release Agents Market Estimates and Forecast, 2017-2030 (US$ Mn)
18.7.4.2. South Africa Release Agents Market Estimates and Forecast, 2017-2030 (Kilo Tons)
18.7.4.3. South Africa Release Agents, By Form, 2017-2030 (US$ Mn)
18.7.4.4. South Africa Release Agents, By Form, 2017-2030 (Kilo Tons)
18.7.4.5. South Africa Release Agents, By Ingredients, 2017-2030 (US$ Mn)
18.7.4.6. South Africa Release Agents, By Ingredients, 2017-2030 (Kilo Tons)
18.7.4.7. South Africa Release Agents, By Application, 2017-2030 (US$ Mn)
18.7.4.8. South Africa Release Agents, By Application, 2017-2030 (Kilo Tons)
18.7.5. Rest of Middle East and Africa
18.7.5.1. Rest of Middle East and Africa Release Agents Market Estimates and Forecast, 2017-2030 (US$ Mn)
18.7.5.2. Rest of Middle East and Africa Release Agents Market Estimates and Forecast, 2017-2030 (Kilo Tons)
18.7.5.3. Rest of Middle East and Africa Release Agents, By Form, 2017-2030 (US$ Mn)
18.7.5.4. Rest of Middle East and Africa Release Agents, By Form, 2017-2030 (Kilo Tons)
18.7.5.5. Rest of Middle East and Africa Release Agents, By Ingredients, 2017-2030 (US$ Mn)
18.7.5.6. Rest of Middle East and Africa Release Agents, By Ingredients, 2017-2030 (Kilo Tons)
18.7.5.7. Rest of Middle East and Africa Release Agents, By Application, 2017-2030 (US$ Mn)
18.7.5.8. Rest of Middle East and Africa Release Agents, By Application, 2017-2030 (Kilo Tons)

19. Company Profiles
19.1. Archer Daniels Midland Company (US)
19.1.1. Company Overview
19.1.2. Products/Services Portfolio
19.1.3. Geographical Presence
19.1.4. Financial Summary
19.1.4.1. Market Revenue and Net Profit (2019-2022)
19.1.4.2. Business Segment Revenue Analysis
19.1.4.3. Geographical Revenue Analysis
19.2. AAK AB (Sweden)
19.3. Cargill (US)
19.4. Dowdupont (US)
19.5. Avatar Corporation (US)
19.6. Par-Way Tryson Company (US)
19.7. Associated British Foods PLC (UK)
19.8. Mallet & Company, Inc. (US)
19.9. Lecico GmbH (Germany)
19.10. Lallemand (Canada)

List of Figures
FIG. 1 Global Release Agents Market: Research Methodology
FIG. 2 Market Size Estimation – Top Down & Bottom up Approach
FIG. 3 Global Release Agents Market Segmentation
FIG. 4 Global Release Agents Market, by Form, 2022 (US$ Mn) (Kilo Tons)
FIG. 5 Global Release Agents Market, by Ingredients, 2022 (US$ Mn) (Kilo Tons)
FIG. 6 Global Release Agents Market, by Application, 2022 (US$ Mn) (Kilo Tons)
FIG. 7 Global Release Agents Market, by Geography, 2022 (US$ Mn) (Kilo Tons)
FIG. 8 Attractive Investment Proposition, by Form, 2022
FIG. 9 Attractive Investment Proposition, by Ingredients, 2022
FIG. 10 Attractive Investment Proposition, by Application, 2022
FIG. 11 Attractive Investment Proposition, by Geography, 2022
FIG. 12 Global Market Share Analysis of Key Release Agents Market Manufacturers, 2022
FIG. 13 Global Market Positioning of Key Release Agents Market Manufacturers, 2022
FIG. 14 Global Release Agents Market Value Contribution, By Form, 2022 & 2030 (Value %)
FIG. 15 Global Release Agents Market, by Solid, Value, 2017-2030 (US$ Mn) (Kilo Tons)
FIG. 16 Global Release Agents Market, by Liquid, Value, 2017-2030 (US$ Mn) (Kilo Tons)
FIG. 17 Global Release Agents Market Value Contribution, By Ingredients, 2022 & 2030 (Value %)
FIG. 18 Global Release Agents Market, by Vegetable Oils, Value, 2017-2030 (US$ Mn) (Kilo Tons)
FIG. 19 Global Release Agents Market, by Emulsifiers, 2017-2030 (US$ Mn) (Kilo Tons)
FIG. 20 Global Release Agents Market, by Wax and Wax Esters, 2017-2030 (US$ Mn) (Kilo Tons)
FIG. 21 Global Release Agents Market, by Antioxidants, 2017-2030 (US$ Mn) (Kilo Tons)
FIG. 22 Global Release Agents Market Value Contribution, By Application, 2022 & 2030 (Value %)
FIG. 23 Global Release Agents Market, by Bakery Products, Value, 2017-2030 (US$ Mn) (Kilo Tons)
FIG. 24 Global Release Agents Market, by Confectionery Products, 2017-2030 (US$ Mn) (Kilo Tons)
FIG. 25 Global Release Agents Market, by Processed Meat, 2017-2030 (US$ Mn) (Kilo Tons)
FIG. 26 North America Release Agents Market, 2017-2030 (US$ Mn) (Kilo Tons)
FIG. 27 U.S. Release Agents Market, 2017-2030 (US$ Mn) (Kilo Tons)
FIG. 28 Canada Release Agents Market, 2017-2030 (US$ Mn) (Kilo Tons)
FIG. 29 Europe Release Agents Market, 2017-2030 (US$ Mn) (Kilo Tons)
FIG. 30 Germany Release Agents Market, 2017-2030 (US$ Mn) (Kilo Tons)
FIG. 31 France Release Agents Market, 2017-2030 (US$ Mn) (Kilo Tons)
FIG. 32 U.K. Release Agents Market, 2017-2030 (US$ Mn) (Kilo Tons)
FIG. 33 Italy Release Agents Market, 2017-2030 (US$ Mn) (Kilo Tons)
FIG. 34 Spain Release Agents Market, 2017-2030 (US$ Mn) (Kilo Tons)
FIG. 35 Rest of Europe Release Agents Market, 2017-2030 (US$ Mn) (Kilo Tons)
FIG. 36 Asia Pacific Release Agents Market, 2017-2030 (US$ Mn) (Kilo Tons)
FIG. 37 China Release Agents Market, 2017-2030 (US$ Mn) (Kilo Tons)
FIG. 38 Japan Release Agents Market, 2017-2030 (US$ Mn) (Kilo Tons)
FIG. 39 India Release Agents Market, 2017-2030 (US$ Mn) (Kilo Tons)
FIG. 40 South Korea Release Agents Market, 2017-2030 (US$ Mn) (Kilo Tons)
FIG. 41 South-East Asia Release Agents Market, 2017-2030 (US$ Mn) (Kilo Tons)
FIG. 42 Rest of Asia Pacific Release Agents Market, 2017-2030 (US$ Mn) (Kilo Tons)
FIG. 43 Latin America Release Agents Market, 2017-2030 (US$ Mn) (Kilo Tons)
FIG. 44 Brazil Release Agents Market, 2017-2030 (US$ Mn) (Kilo Tons)
FIG. 45 Mexico Release Agents Market, 2017-2030 (US$ Mn) (Kilo Tons)
FIG. 46 Rest of Latin America Release Agents Market, 2017-2030 (US$ Mn) (Kilo Tons)
FIG. 47 Middle East & Africa Release Agents Market, 2017-2030 (US$ Mn) (Kilo Tons)
FIG. 48 GCC Countries Release Agents Market, 2017-2030 (US$ Mn) (Kilo Tons)
FIG. 49 South Africa Release Agents Market, 2017-2030 (US$ Mn) (Kilo Tons)
FIG. 50 Rest of Middle East and Africa Release Agents Market, 2017-2030 (US$ Mn) (Kilo Tons)


List of Tables
TABLE 1 Market Snapshot: Global Release Agents Market
TABLE 2 Global Release Agents Market: Market Drivers Impact Analysis
TABLE 3 Global Release Agents Market: Market Restraints Impact Analysis
TABLE 4 Global Release Agents Market, by Competitive Benchmarking, 2022
TABLE 5 Global Release Agents Market, by Geographical Presence Analysis, 2022
TABLE 6 Global Release Agents Market, by Key Strategies Analysis, 2022
TABLE 7 Global Release Agents Market, by Solid, By Region, 2017-2022 (US$ Mn)
TABLE 8 Global Release Agents Market, by Solid, By Region, 2023-2030 (US$ Mn)
TABLE 9 Global Release Agents Market, by Solid, By Region, 2017-2022 (Kilo Tons)
TABLE 10 Global Release Agents Market, by Solid, By Region, 2023-2030 (Kilo Tons)
TABLE 11 Global Release Agents Market, by Liquid, By Region, 2017-2022 (US$ Mn)
TABLE 12 Global Release Agents Market, by Liquid, By Region, 2023-2030 (US$ Mn)
TABLE 13 Global Release Agents Market, by Liquid, By Region, 2017-2022 (Kilo Tons)
TABLE 14 Global Release Agents Market, by Liquid, By Region, 2023-2030 (Kilo Tons)
TABLE 15 Global Release Agents Market, by Vegetable Oils, By Region, 2017-2022 (US$ Mn)
TABLE 16 Global Release Agents Market, by Vegetable Oils, By Region, 2023-2030 (US$ Mn)
TABLE 17 Global Release Agents Market, by Vegetable Oils, By Region, 2017-2022 (Kilo Tons)
TABLE 18 Global Release Agents Market, by Vegetable Oils, By Region, 2023-2030 (Kilo Tons)
TABLE 19 Global Release Agents Market, by Emulsifiers, By Region, 2017-2022 (US$ Mn)
TABLE 20 Global Release Agents Market, by Emulsifiers, By Region, 2023-2030 (US$ Mn)
TABLE 21 Global Release Agents Market, by Emulsifiers, By Region, 2017-2022 (Kilo Tons)
TABLE 22 Global Release Agents Market, by Emulsifiers, By Region, 2023-2030 (Kilo Tons)
TABLE 23 Global Release Agents Market, by Wax & Wax Esters, By Region, 2017-2022 (US$ Mn)
TABLE 24 Global Release Agents Market, by Wax & Wax Esters, By Region, 2023-2030 (US$ Mn)
TABLE 25 Global Release Agents Market, by Wax & Wax Esters, By Region, 2017-2022 (Kilo Tons)
TABLE 26 Global Release Agents Market, by Wax & Wax Esters, By Region, 2023-2030 (Kilo Tons)
TABLE 27 Global Release Agents Market, by Antioxidants, By Region, 2017-2022 (US$ Mn)
TABLE 28 Global Release Agents Market, by Antioxidants, By Region, 2023-2030 (US$ Mn)
TABLE 29 Global Release Agents Market, by Antioxidants, By Region, 2017-2022 (Kilo Tons)
TABLE 30 Global Release Agents Market, by Antioxidants, By Region, 2023-2030 (Kilo Tons)
TABLE 31 Global Release Agents Market, by Bakery Products, By Region, 2017-2022 (US$ Mn)
TABLE 32 Global Release Agents Market, by Bakery Products, By Region, 2023-2030 (US$ Mn)
TABLE 33 Global Release Agents Market, by Bakery Products, By Region, 2017-2022 (Kilo Tons)
TABLE 34 Global Release Agents Market, by Bakery Products, By Region, 2023-2030 (Kilo Tons)
TABLE 35 Global Release Agents Market, by Confectionery Products, By Region, 2017-2022 (US$ Mn)
TABLE 36 Global Release Agents Market, by Confectionery Products, By Region, 2023-2030 (US$ Mn)
TABLE 37 Global Release Agents Market, by Confectionery Products, By Region, 2017-2022 (Kilo Tons)
TABLE 38 Global Release Agents Market, by Confectionery Products, By Region, 2023-2030 (Kilo Tons)
TABLE 39 Global Release Agents Market, by Processed Meat, By Region, 2017-2022 (US$ Mn)
TABLE 40 Global Release Agents Market, by Processed Meat, By Region, 2023-2030 (US$ Mn)
TABLE 41 Global Release Agents Market, by Processed Meat, By Region, 2017-2022 (Kilo Tons)
TABLE 42 Global Release Agents Market, by Processed Meat, By Region, 2023-2030 (Kilo Tons)
TABLE 43 Global Release Agents Market, by Form, 2017-2022 (US$ Mn)
TABLE 44 Global Release Agents Market, by Form, 2023-2030 (US$ Mn)
TABLE 45 Global Release Agents Market, by Form, 2017-2022 (Kilo Tons)
TABLE 46 Global Release Agents Market, by Form, 2023-2030 (Kilo Tons)
TABLE 47 Global Release Agents Market, by Ingredients, 2017-2022 (US$ Mn)
TABLE 48 Global Release Agents Market, by Ingredients, 2023-2030 (US$ Mn)
TABLE 49 Global Release Agents Market, by Ingredients, 2017-2022 (Kilo Tons)
TABLE 50 Global Release Agents Market, by Ingredients, 2023-2030 (Kilo Tons)
TABLE 51 Global Release Agents Market, by Application, 2017-2022 (US$ Mn)
TABLE 52 Global Release Agents Market, by Application, 2023-2030 (US$ Mn)
TABLE 53 Global Release Agents Market, by Application, 2017-2022 (Kilo Tons)
TABLE 54 Global Release Agents Market, by Application, 2023-2030 (Kilo Tons)
TABLE 55 Global Release Agents Market, by Region, 2017-2022 (US$ Mn)
TABLE 56 Global Release Agents Market, by Region, 2023-2030 (US$ Mn)
TABLE 57 Global Release Agents Market, by Region, 2017-2022 (Kilo Tons)
TABLE 58 Global Release Agents Market, by Region, 2023-2030 (Kilo Tons)
TABLE 59 North America Release Agents Market, by Form, 2017-2022 (US$ Mn)
TABLE 60 North America Release Agents Market, by Form, 2023-2030 (US$ Mn)
TABLE 61 North America Release Agents Market, by Form, 2017-2022 (Kilo Tons)
TABLE 62 North America Release Agents Market, by Form, 2023-2030 (Kilo Tons)
TABLE 63 North America Release Agents Market, by Ingredients, 2017-2022 (US$ Mn)
TABLE 64 North America Release Agents Market, by Ingredients, 2023-2030 (US$ Mn)
TABLE 65 North America Release Agents Market, by Ingredients, 2017-2022 (Kilo Tons)
TABLE 66 North America Release Agents Market, by Ingredients, 2023-2030 (Kilo Tons)
TABLE 67 North America Release Agents Market, by Application, 2017-2022 (US$ Mn)
TABLE 68 North America Release Agents Market, by Application, 2023-2030 (US$ Mn)
TABLE 69 North America Release Agents Market, by Application, 2017-2022 (Kilo Tons)
TABLE 70 North America Release Agents Market, by Application, 2023-2030 (Kilo Tons)
TABLE 71 North America Release Agents Market, by Country, 2017-2022 (US$ Mn)
TABLE 72 North America Release Agents Market, by Country, 2023-2030 (US$ Mn)
TABLE 73 North America Release Agents Market, by Country, 2017-2022 (Kilo Tons)
TABLE 74 North America Release Agents Market, by Country, 2023-2030 (Kilo Tons)
TABLE 75 U.S. Release Agents Market, by Form, 2017-2022 (US$ Mn)
TABLE 76 U.S. Release Agents Market, by Form, 2023-2030 (US$ Mn)
TABLE 77 U.S. Release Agents Market, by Form, 2017-2022 (Kilo Tons)
TABLE 78 U.S. Release Agents Market, by Form, 2023-2030 (Kilo Tons)
TABLE 79 U.S. Release Agents Market, by Ingredients, 2017-2022 (US$ Mn)
TABLE 80 U.S. Release Agents Market, by Ingredients, 2023-2030 (US$ Mn)
TABLE 81 U.S. Release Agents Market, by Ingredients, 2017-2022 (Kilo Tons)
TABLE 82 U.S. Release Agents Market, by Ingredients, 2023-2030 (Kilo Tons)
TABLE 83 U.S. Release Agents Market, by Application, 2017-2022 (US$ Mn)
TABLE 84 U.S. Release Agents Market, by Application, 2023-2030 (US$ Mn)
TABLE 85 U.S. Release Agents Market, by Application, 2017-2022 (Kilo Tons)
TABLE 86 U.S. Release Agents Market, by Application, 2023-2030 (Kilo Tons)
TABLE 87 Canada Release Agents Market, by Form, 2017-2022 (US$ Mn)
TABLE 88 Canada Release Agents Market, by Form, 2023-2030 (US$ Mn)
TABLE 89 Canada Release Agents Market, by Form, 2017-2022 (Kilo Tons)
TABLE 90 Canada Release Agents Market, by Form, 2023-2030 (Kilo Tons)
TABLE 91 Canada Release Agents Market, by Ingredients, 2017-2022 (US$ Mn)
TABLE 92 Canada Release Agents Market, by Ingredients, 2023-2030 (US$ Mn)
TABLE 93 Canada Release Agents Market, by Ingredients, 2017-2022 (Kilo Tons)
TABLE 94 Canada Release Agents Market, by Ingredients, 2023-2030 (Kilo Tons)
TABLE 95 Canada Release Agents Market, by Application, 2017-2022 (US$ Mn)
TABLE 96 Canada Release Agents Market, by Application, 2023-2030 (US$ Mn)
TABLE 97 Canada Release Agents Market, by Application, 2017-2022 (Kilo Tons)
TABLE 98 Canada Release Agents Market, by Application, 2023-2030 (Kilo Tons)
TABLE 99 Mexico Release Agents Market, by Form, 2017-2022 (US$ Mn)
TABLE 100 Mexico Release Agents Market, by Form, 2023-2030 (US$ Mn)
TABLE 101 Mexico Release Agents Market, by Form, 2017-2022 (Kilo Tons)
TABLE 102 Mexico Release Agents Market, by Form, 2023-2030 (Kilo Tons)
TABLE 103 Mexico Release Agents Market, by Ingredients, 2017-2022 (US$ Mn)
TABLE 104 Mexico Release Agents Market, by Ingredients, 2023-2030 (US$ Mn)
TABLE 105 Mexico Release Agents Market, by Ingredients, 2017-2022 (Kilo Tons)
TABLE 106 Mexico Release Agents Market, by Ingredients, 2023-2030 (Kilo Tons)
TABLE 107 Mexico Release Agents Market, by Application, 2017-2022 (US$ Mn)
TABLE 108 Mexico Release Agents Market, by Application, 2023-2030 (US$ Mn)
TABLE 109 Mexico Release Agents Market, by Application, 2017-2022 (Kilo Tons)
TABLE 110 Mexico Release Agents Market, by Application, 2023-2030 (Kilo Tons)
TABLE 111 Europe Release Agents Market, by Form, 2017-2022 (US$ Mn)
TABLE 112 Europe Release Agents Market, by Form, 2023-2030 (US$ Mn)
TABLE 113 Europe Release Agents Market, by Form, 2017-2022 (Kilo Tons)
TABLE 114 Europe Release Agents Market, by Form, 2023-2030 (Kilo Tons)
TABLE 115 Europe Release Agents Market, by Ingredients, 2017-2022 (US$ Mn)
TABLE 116 Europe Release Agents Market, by Ingredients, 2023-2030 (US$ Mn)
TABLE 117 Europe Release Agents Market, by Ingredients, 2017-2022 (Kilo Tons)
TABLE 118 Europe Release Agents Market, by Ingredients, 2023-2030 (Kilo Tons)
TABLE 119 Europe Release Agents Market, by Application, 2017-2022 (US$ Mn)
TABLE 120 Europe Release Agents Market, by Application, 2023-2030 (US$ Mn)
TABLE 121 Europe Release Agents Market, by Application, 2017-2022 (Kilo Tons)
TABLE 122 Europe Release Agents Market, by Application, 2023-2030 (Kilo Tons)
TABLE 123 Germany Release Agents Market, by Form, 2017-2022 (US$ Mn)
TABLE 124 Germany Release Agents Market, by Form, 2023-2030 (US$ Mn)
TABLE 125 Germany Release Agents Market, by Form, 2017-2022 (Kilo Tons)
TABLE 126 Europe Release Agents Market, by Country, 2017-2022 (US$ Mn)
TABLE 127 Europe Release Agents Market, by Country, 2023-2030 (US$ Mn)
TABLE 128 Europe Release Agents Market, by Country, 2017-2022 (Kilo Tons)
TABLE 129 Europe Release Agents Market, by Country, 2023-2030 (Kilo Tons)
TABLE 130 Germany Release Agents Market, by Form, 2023-2030 (Kilo Tons)
TABLE 131 Germany Release Agents Market, by Ingredients, 2017-2022 (US$ Mn)
TABLE 132 Germany Release Agents Market, by Ingredients, 2023-2030 (US$ Mn)
TABLE 133 Germany Release Agents Market, by Ingredients, 2017-2022 (Kilo Tons)
TABLE 134 Germany Release Agents Market, by Ingredients, 2023-2030 (Kilo Tons)
TABLE 135 Germany Release Agents Market, by Application, 2017-2022 (US$ Mn)
TABLE 136 Germany Release Agents Market, by Application, 2023-2030 (US$ Mn)
TABLE 137 Germany Release Agents Market, by Application, 2017-2022 (Kilo Tons)
TABLE 138 Germany Release Agents Market, by Application, 2023-2030 (Kilo Tons)
TABLE 139 France Release Agents Market, by Form, 2017-2022 (US$ Mn)
TABLE 140 France Release Agents Market, by Form, 2023-2030 (US$ Mn)
TABLE 141 France Release Agents Market, by Form, 2017-2022 (Kilo Tons)
TABLE 142 France Release Agents Market, by Form, 2023-2030 (Kilo Tons)
TABLE 143 France Release Agents Market, by Ingredients, 2017-2022 (US$ Mn)
TABLE 144 France Release Agents Market, by Ingredients, 2023-2030 (US$ Mn)
TABLE 145 France Release Agents Market, by Ingredients, 2017-2022 (Kilo Tons)
TABLE 146 France Release Agents Market, by Ingredients, 2023-2030 (Kilo Tons)
TABLE 147 France Release Agents Market, by Application, 2017-2022 (US$ Mn)
TABLE 148 France Release Agents Market, by Application, 2023-2030 (US$ Mn)
TABLE 149 France Release Agents Market, by Application, 2017-2022 (Kilo Tons)
TABLE 150 France Release Agents Market, by Application, 2023-2030 (Kilo Tons)
TABLE 151 U.K. Release Agents Market, by Form, 2017-2022 (US$ Mn)
TABLE 152 U.K. Release Agents Market, by Form, 2023-2030 (US$ Mn)
TABLE 153 U.K. Release Agents Market, by Form, 2017-2022 (Kilo Tons)
TABLE 154 U.K. Release Agents Market, by Form, 2023-2030 (Kilo Tons)
TABLE 155 U.K. Release Agents Market, by Ingredients, 2017-2022 (US$ Mn)
TABLE 156 U.K. Release Agents Market, by Ingredients, 2023-2030 (US$ Mn)
TABLE 157 U.K. Release Agents Market, by Ingredients, 2017-2022 (Kilo Tons)
TABLE 158 U.K. Release Agents Market, by Ingredients, 2023-2030 (Kilo Tons)
TABLE 159 U.K. Release Agents Market, by Application, 2017-2022 (US$ Mn)
TABLE 160 U.K. Release Agents Market, by Application, 2023-2030 (US$ Mn)
TABLE 161 U.K. Release Agents Market, by Application, 2017-2022 (Kilo Tons)
TABLE 162 U.K. Release Agents Market, by Application, 2023-2030 (Kilo Tons)
TABLE 163 Italy Release Agents Market, by Form, 2017-2022 (US$ Mn)
TABLE 164 Italy Release Agents Market, by Form, 2023-2030 (US$ Mn)
TABLE 165 Italy Release Agents Market, by Form, 2017-2022 (Kilo Tons)
TABLE 166 Italy Release Agents Market, by Form, 2023-2030 (Kilo Tons)
TABLE 167 Italy Release Agents Market, by Ingredients, 2017-2022 (US$ Mn)
TABLE 168 Italy Release Agents Market, by Ingredients, 2023-2030 (US$ Mn)
TABLE 169 Italy Release Agents Market, by Ingredients, 2017-2022 (Kilo Tons)
TABLE 170 Italy Release Agents Market, by Ingredients, 2023-2030 (Kilo Tons)
TABLE 171 Italy Release Agents Market, by Application, 2017-2022 (US$ Mn)
TABLE 172 Italy Release Agents Market, by Application, 2023-2030 (US$ Mn)
TABLE 173 Italy Release Agents Market, by Application, 2017-2022 (Kilo Tons)
TABLE 174 Italy Release Agents Market, by Application, 2023-2030 (Kilo Tons)
TABLE 175 Spain Release Agents Market, by Form, 2017-2022 (US$ Mn)
TABLE 176 Spain Release Agents Market, by Form, 2023-2030 (US$ Mn)
TABLE 177 Spain Release Agents Market, by Form, 2017-2022 (Kilo Tons)
TABLE 178 Spain Release Agents Market, by Form, 2023-2030 (Kilo Tons)
TABLE 179 Spain Release Agents Market, by Ingredients, 2017-2022 (US$ Mn)
TABLE 180 Spain Release Agents Market, by Ingredients, 2023-2030 (US$ Mn)
TABLE 181 Spain Release Agents Market, by Ingredients, 2017-2022 (Kilo Tons)
TABLE 182 Spain Release Agents Market, by Ingredients, 2023-2030 (Kilo Tons)
TABLE 183 Spain Release Agents Market, by Application, 2017-2022 (US$ Mn)
TABLE 184 Spain Release Agents Market, by Application, 2023-2030 (US$ Mn)
TABLE 185 Spain Release Agents Market, by Application, 2017-2022 (Kilo Tons)
TABLE 186 Spain Release Agents Market, by Application, 2023-2030 (Kilo Tons)
TABLE 187 Rest of Europe Release Agents Market, by Form, 2017-2022 (US$ Mn)
TABLE 188 Rest of Europe Release Agents Market, by Form, 2023-2030 (US$ Mn)
TABLE 189 Rest of Europe Release Agents Market, by Form, 2017-2022 (Kilo Tons)
TABLE 190 Rest of Europe Release Agents Market, by Form, 2023-2030 (Kilo Tons)
TABLE 191 Rest of Europe Release Agents Market, by Ingredients, 2017-2022 (US$ Mn)
TABLE 192 Rest of Europe Release Agents Market, by Ingredients, 2023-2030 (US$ Mn)
TABLE 193 Rest of Europe Release Agents Market, by Ingredients, 2017-2022 (Kilo Tons)
TABLE 194 Rest of Europe Release Agents Market, by Ingredients, 2023-2030 (Kilo Tons)
TABLE 195 Rest of Europe Release Agents Market, by Application, 2017-2022 (US$ Mn)
TABLE 196 Rest of Europe Release Agents Market, by Application, 2023-2030 (US$ Mn)
TABLE 197 Rest of Europe Release Agents Market, by Application, 2017-2022 (Kilo Tons)
TABLE 198 Rest of Europe Release Agents Market, by Application, 2023-2030 (Kilo Tons)
TABLE 199 Asia Pacific Release Agents Market, by Form, 2017-2022 (US$ Mn)
TABLE 200 Asia Pacific Release Agents Market, by Form, 2023-2030 (US$ Mn)
TABLE 201 Asia Pacific Release Agents Market, by Form, 2017-2022 (Kilo Tons)
TABLE 202 Asia Pacific Release Agents Market, by Form, 2023-2030 (Kilo Tons)
TABLE 203 Asia Pacific Release Agents Market, by Ingredients, 2017-2022 (US$ Mn)
TABLE 204 Asia Pacific Release Agents Market, by Ingredients, 2023-2030 (US$ Mn)
TABLE 205 Asia Pacific Release Agents Market, by Ingredients, 2017-2022 (Kilo Tons)
TABLE 206 Asia Pacific Release Agents Market, by Ingredients, 2023-2030 (Kilo Tons)
TABLE 207 Asia Pacific Release Agents Market, by Application, 2017-2022 (US$ Mn)
TABLE 208 Asia Pacific Release Agents Market, by Application, 2023-2030 (US$ Mn)
TABLE 209 Asia Pacific Release Agents Market, by Application, 2017-2022 (Kilo Tons)
TABLE 210 Asia Pacific Release Agents Market, by Application, 2023-2030 (Kilo Tons)
TABLE 211 Asia Pacific Release Agents Market, by Country, 2017-2022 (US$ Mn)
TABLE 212 Asia Pacific Release Agents Market, by Country, 2023-2030 (US$ Mn)
TABLE 213 Asia Pacific Release Agents Market, by Country, 2017-2022 (Kilo Tons)
TABLE 214 Asia Pacific Release Agents Market, by Country, 2023-2030 (Kilo Tons)
TABLE 215 China Release Agents Market, by Form, 2017-2022 (US$ Mn)
TABLE 216 China Release Agents Market, by Form, 2023-2030 (US$ Mn)
TABLE 217 China Release Agents Market, by Form, 2017-2022 (Kilo Tons)
TABLE 218 China Release Agents Market, by Form, 2023-2030 (Kilo Tons)
TABLE 219 China Release Agents Market, by Ingredients, 2017-2022 (US$ Mn)
TABLE 220 China Release Agents Market, by Ingredients, 2023-2030 (US$ Mn)
TABLE 221 China Release Agents Market, by Ingredients, 2017-2022 (Kilo Tons)
TABLE 222 China Release Agents Market, by Ingredients, 2023-2030 (Kilo Tons)
TABLE 223 China Release Agents Market, by Application, 2017-2022 (US$ Mn)
TABLE 224 China Release Agents Market, by Application, 2023-2030 (US$ Mn)
TABLE 225 China Release Agents Market, by Application, 2017-2022 (Kilo Tons)
TABLE 226 China Release Agents Market, by Application, 2023-2030 (Kilo Tons)
TABLE 227 Japan Release Agents Market, by Form, 2017-2022 (US$ Mn)
TABLE 228 Japan Release Agents Market, by Form, 2023-2030 (US$ Mn)
TABLE 229 Japan Release Agents Market, by Form, 2017-2022 (Kilo Tons)
TABLE 230 Japan Release Agents Market, by Form, 2023-2030 (Kilo Tons)
TABLE 231 Japan Release Agents Market, by Ingredients, 2017-2022 (US$ Mn)
TABLE 232 Japan Release Agents Market, by Ingredients, 2023-2030 (US$ Mn)
TABLE 233 Japan Release Agents Market, by Ingredients, 2017-2022 (Kilo Tons)
TABLE 234 Japan Release Agents Market, by Ingredients, 2023-2030 (Kilo Tons)
TABLE 235 Japan Release Agents Market, by Application, 2017-2022 (US$ Mn)
TABLE 236 Japan Release Agents Market, by Application, 2023-2030 (US$ Mn)
TABLE 237 Japan Release Agents Market, by Application, 2017-2022 (Kilo Tons)
TABLE 238 Japan Release Agents Market, by Application, 2023-2030 (Kilo Tons)
TABLE 239 India Release Agents Market, by Form, 2017-2022 (US$ Mn)
TABLE 240 India Release Agents Market, by Form, 2023-2030 (US$ Mn)
TABLE 241 India Release Agents Market, by Form, 2017-2022 (Kilo Tons)
TABLE 242 India Release Agents Market, by Form, 2023-2030 (Kilo Tons)
TABLE 243 India Release Agents Market, by Ingredients, 2017-2022 (US$ Mn)
TABLE 244 India Release Agents Market, by Ingredients, 2023-2030 (US$ Mn)
TABLE 245 India Release Agents Market, by Ingredients, 2017-2022 (Kilo Tons)
TABLE 246 India Release Agents Market, by Ingredients, 2023-2030 (Kilo Tons)
TABLE 247 India Release Agents Market, by Application, 2017-2022 (US$ Mn)
TABLE 248 India Release Agents Market, by Application, 2023-2030 (US$ Mn)
TABLE 249 India Release Agents Market, by Application, 2017-2022 (Kilo Tons)
TABLE 250 India Release Agents Market, by Application, 2023-2030 (Kilo Tons)
TABLE 251 South Korea Release Agents Market, by Form, 2017-2022 (US$ Mn)
TABLE 252 South Korea Release Agents Market, by Form, 2023-2030 (US$ Mn)
TABLE 253 South Korea Release Agents Market, by Form, 2017-2022 (Kilo Tons)
TABLE 254 South Korea Release Agents Market, by Form, 2023-2030 (Kilo Tons)
TABLE 255 South Korea Release Agents Market, by Ingredients, 2017-2022 (US$ Mn)
TABLE 256 South Korea Release Agents Market, by Ingredients, 2023-2030 (US$ Mn)
TABLE 257 South Korea Release Agents Market, by Ingredients, 2017-2022 (Kilo Tons)
TABLE 258 South Korea Release Agents Market, by Ingredients, 2023-2030 (Kilo Tons)
TABLE 259 South Korea Release Agents Market, by Application, 2017-2022 (US$ Mn)
TABLE 260 South Korea Release Agents Market, by Application, 2023-2030 (US$ Mn)
TABLE 261 South Korea Release Agents Market, by Application, 2017-2022 (Kilo Tons)
TABLE 262 South Korea Release Agents Market, by Application, 2023-2030 (Kilo Tons)
TABLE 263 South-East Asia Release Agents Market, by Form, 2017-2022 (US$ Mn)
TABLE 264 South-East Asia Release Agents Market, by Form, 2023-2030 (US$ Mn)
TABLE 265 South-East Asia Release Agents Market, by Form, 2017-2022 (Kilo Tons)
TABLE 266 South-East Asia Release Agents Market, by Form, 2023-2030 (Kilo Tons)
TABLE 267 South-East Asia Release Agents Market, by Ingredients, 2017-2022 (US$ Mn)
TABLE 268 South-East Asia Release Agents Market, by Ingredients, 2023-2030 (US$ Mn)
TABLE 269 South-East Asia Release Agents Market, by Ingredients, 2017-2022 (Kilo Tons)
TABLE 270 South-East Asia Release Agents Market, by Ingredients, 2023-2030 (Kilo Tons)
TABLE 271 South-East Asia Release Agents Market, by Application, 2017-2022 (US$ Mn)
TABLE 272 South-East Asia Release Agents Market, by Application, 2023-2030 (US$ Mn)
TABLE 273 South-East Asia Release Agents Market, by Application, 2017-2022 (Kilo Tons)
TABLE 274 South-East Asia Release Agents Market, by Application, 2023-2030 (Kilo Tons)
TABLE 275 Rest of Asia Pacific Release Agents Market, by Form, 2017-2022 (US$ Mn)
TABLE 276 Rest of Asia Pacific Release Agents Market, by Form, 2023-2030 (US$ Mn)
TABLE 277 Rest of Asia Pacific Release Agents Market, by Form, 2017-2022 (Kilo Tons)
TABLE 278 Rest of Asia Pacific Release Agents Market, by Form, 2023-2030 (Kilo Tons)
TABLE 279 Rest of Asia Pacific Release Agents Market, by Ingredients, 2017-2022 (US$ Mn)
TABLE 280 Rest of Asia Pacific Release Agents Market, by Ingredients, 2023-2030 (US$ Mn)
TABLE 281 Rest of Asia Pacific Release Agents Market, by Ingredients, 2017-2022 (Kilo Tons)
TABLE 282 Rest of Asia Pacific Release Agents Market, by Ingredients, 2023-2030 (Kilo Tons)
TABLE 283 Rest of Asia Pacific Release Agents Market, by Application, 2017-2022 (US$ Mn)
TABLE 284 Rest of Asia Pacific Release Agents Market, by Application, 2023-2030 (US$ Mn)
TABLE 285 Rest of Asia Pacific Release Agents Market, by Application, 2017-2022 (Kilo Tons)
TABLE 286 Rest of Asia Pacific Release Agents Market, by Application, 2023-2030 (Kilo Tons)
TABLE 287 Latin America Release Agents Market, by Form, 2017-2022 (US$ Mn)
TABLE 288 Latin America Release Agents Market, by Form, 2023-2030 (US$ Mn)
TABLE 289 Latin America Release Agents Market, by Form, 2017-2022 (Kilo Tons)
TABLE 290 Latin America Release Agents Market, by Form, 2023-2030 (Kilo Tons)
TABLE 291 Latin America Release Agents Market, by Ingredients, 2017-2022 (US$ Mn)
TABLE 292 Latin America Release Agents Market, by Ingredients, 2023-2030 (US$ Mn)
TABLE 293 Latin America Release Agents Market, by Ingredients, 2017-2022 (Kilo Tons)
TABLE 294 Latin America Release Agents Market, by Ingredients, 2023-2030 (Kilo Tons)
TABLE 295 Latin America Release Agents Market, by Application, 2017-2022 (US$ Mn)
TABLE 296 Latin America Release Agents Market, by Application, 2023-2030 (US$ Mn)
TABLE 297 Latin America Release Agents Market, by Application, 2017-2022 (Kilo Tons)
TABLE 298 Latin America Release Agents Market, by Application, 2023-2030 (Kilo Tons)
TABLE 299 Latin America Release Agents Market, by Country, 2017-2022 (US$ Mn)
TABLE 300 Latin America Release Agents Market, by Country, 2023-2030 (US$ Mn)
TABLE 301 Latin America Release Agents Market, by Country, 2017-2022 (Kilo Tons)
TABLE 302 Latin America Release Agents Market, by Country, 2023-2030 (Kilo Tons)
TABLE 303 Brazil Release Agents Market, by Form, 2017-2022 (US$ Mn)
TABLE 304 Brazil Release Agents Market, by Form, 2023-2030 (US$ Mn)
TABLE 305 Brazil Release Agents Market, by Form, 2017-2022 (Kilo Tons)
TABLE 306 Brazil Release Agents Market, by Form, 2023-2030 (Kilo Tons)
TABLE 307 Brazil Release Agents Market, by Ingredients, 2017-2022 (US$ Mn)
TABLE 308 Brazil Release Agents Market, by Ingredients, 2023-2030 (US$ Mn)
TABLE 309 Brazil Release Agents Market, by Ingredients, 2017-2022 (Kilo Tons)
TABLE 310 Brazil Release Agents Market, by Ingredients, 2023-2030 (Kilo Tons)
TABLE 311 Brazil Release Agents Market, by Application, 2017-2022 (US$ Mn)
TABLE 312 Brazil Release Agents Market, by Application, 2023-2030 (US$ Mn)
TABLE 313 Brazil Release Agents Market, by Application, 2017-2022 (Kilo Tons)
TABLE 314 Brazil Release Agents Market, by Application, 2023-2030 (Kilo Tons)
TABLE 315 Argentina Release Agents Market, by Form, 2017-2022 (US$ Mn)
TABLE 316 Argentina Release Agents Market, by Form, 2023-2030 (US$ Mn)
TABLE 317 Argentina Release Agents Market, by Form, 2017-2022 (Kilo Tons)
TABLE 318 Argentina Release Agents Market, by Form, 2023-2030 (Kilo Tons)
TABLE 319 Argentina Release Agents Market, by Ingredients, 2017-2022 (US$ Mn)
TABLE 320 Argentina Release Agents Market, by Ingredients, 2023-2030 (US$ Mn)
TABLE 321 Argentina Release Agents Market, by Ingredients, 2017-2022 (Kilo Tons)
TABLE 322 Argentina Release Agents Market, by Ingredients, 2023-2030 (Kilo Tons)
TABLE 323 Argentina Release Agents Market, by Application, 2017-2022 (US$ Mn)
TABLE 324 Argentina Release Agents Market, by Application, 2023-2030 (US$ Mn)
TABLE 325 Argentina Release Agents Market, by Application, 2017-2022 (Kilo Tons)
TABLE 326 Argentina Release Agents Market, by Application, 2023-2030 (Kilo Tons)
TABLE 327 Rest of Latin America Release Agents Market, by Form, 2017-2022 (US$ Mn)
TABLE 328 Rest of Latin America Release Agents Market, by Form, 2023-2030 (US$ Mn)
TABLE 329 Rest of Latin America Release Agents Market, by Form, 2017-2022 (Kilo Tons)
TABLE 330 Rest of Latin America Release Agents Market, by Form, 2023-2030 (Kilo Tons)
TABLE 331 Rest of Latin America Release Agents Market, by Ingredients, 2017-2022 (US$ Mn)
TABLE 332 Rest of Latin America Release Agents Market, by Ingredients, 2023-2030 (US$ Mn)
TABLE 333 Rest of Latin America Release Agents Market, by Ingredients, 2017-2022 (Kilo Tons)
TABLE 334 Rest of Latin America Release Agents Market, by Ingredients, 2023-2030 (Kilo Tons)
TABLE 335 Rest of Latin America Release Agents Market, by Application, 2017-2022 (US$ Mn)
TABLE 336 Rest of Latin America Release Agents Market, by Application, 2023-2030 (US$ Mn)
TABLE 337 Rest of Latin America Release Agents Market, by Application, 2017-2022 (Kilo Tons)
TABLE 338 Rest of Latin America Release Agents Market, by Application, 2023-2030 (Kilo Tons)
TABLE 339 Middle East and Africa Release Agents Market, by Form, 2017-2022 (US$ Mn)
TABLE 340 Middle East and Africa Release Agents Market, by Form, 2023-2030 (US$ Mn)
TABLE 341 Middle East and Africa Release Agents Market, by Form, 2017-2022 (Kilo Tons)
TABLE 342 Middle East and Africa Release Agents Market, by Form, 2023-2030 (Kilo Tons)
TABLE 343 Middle East and Africa Release Agents Market, by Ingredients, 2017-2022 (US$ Mn)
TABLE 344 Middle East and Africa Release Agents Market, by Ingredients, 2023-2030 (US$ Mn)
TABLE 345 Middle East and Africa Release Agents Market, by Ingredients, 2017-2022 (Kilo Tons)
TABLE 346 Middle East and Africa Release Agents Market, by Ingredients, 2023-2030 (Kilo Tons)
TABLE 347 Middle East and Africa Release Agents Market, by Application, 2017-2022 (US$ Mn)
TABLE 348 Middle East and Africa Release Agents Market, by Application, 2023-2030 (US$ Mn)
TABLE 349 Middle East and Africa Release Agents Market, by Application, 2017-2022 (Kilo Tons)
TABLE 350 Middle East and Africa Release Agents Market, by Application, 2023-2030 (Kilo Tons)
TABLE 351 Middle East and Africa Release Agents Market, by Country, 2017-2022 (US$ Mn)
TABLE 352 Middle East and Africa Release Agents Market, by Country, 2023-2030 (US$ Mn)
TABLE 353 Middle East and Africa Release Agents Market, by Country, 2017-2022 (Kilo Tons)
TABLE 354 Middle East and Africa Release Agents Market, by Country, 2023-2030 (Kilo Tons)
TABLE 355 GCC Countries Release Agents Market, by Form, 2017-2022 (US$ Mn)
TABLE 356 GCC Countries Release Agents Market, by Form, 2023-2030 (US$ Mn)
TABLE 357 GCC Countries Release Agents Market, by Form, 2017-2022 (Kilo Tons)
TABLE 358 GCC Countries Release Agents Market, by Form, 2023-2030 (Kilo Tons)
TABLE 359 GCC Countries Release Agents Market, by Ingredients, 2017-2022 (US$ Mn)
TABLE 360 GCC Countries Release Agents Market, by Ingredients, 2023-2030 (US$ Mn)
TABLE 361 GCC Countries Release Agents Market, by Ingredients, 2017-2022 (Kilo Tons)
TABLE 362 GCC Countries Release Agents Market, by Ingredients, 2023-2030 (Kilo Tons)
TABLE 363 GCC Countries Release Agents Market, by Application, 2017-2022 (US$ Mn)
TABLE 364 GCC Countries Release Agents Market, by Application, 2023-2030 (US$ Mn)
TABLE 365 GCC Countries Release Agents Market, by Application, 2017-2022 (Kilo Tons)
TABLE 366 GCC Countries Release Agents Market, by Application, 2023-2030 (Kilo Tons)
TABLE 367 South Africa Release Agents Market, by Form, 2017-2022 (US$ Mn)
TABLE 368 South Africa Release Agents Market, by Form, 2023-2030 (US$ Mn)
TABLE 369 South Africa Release Agents Market, by Form, 2017-2022 (Kilo Tons)
TABLE 370 South Africa Release Agents Market, by Form, 2023-2030 (Kilo Tons)
TABLE 371 South Africa Release Agents Market, by Ingredients, 2017-2022 (US$ Mn)
TABLE 372 South Africa Release Agents Market, by Ingredients, 2023-2030 (US$ Mn)
TABLE 373 South Africa Release Agents Market, by Ingredients, 2017-2022 (Kilo Tons)
TABLE 374 South Africa Release Agents Market, by Ingredients, 2023-2030 (Kilo Tons)
TABLE 375 South Africa Release Agents Market, by Application, 2017-2022 (US$ Mn)
TABLE 376 South Africa Release Agents Market, by Application, 2023-2030 (US$ Mn)
TABLE 377 South Africa Release Agents Market, by Application, 2017-2022 (Kilo Tons)
TABLE 378 South Africa Release Agents Market, by Application, 2023-2030 (Kilo Tons)
TABLE 379 Rest of Middle East and Africa Release Agents Market, by Form, 2017-2022 (US$ Mn)
TABLE 380 Rest of Middle East and Africa Release Agents Market, by Form, 2023-2030 (US$ Mn)
TABLE 381 Rest of Middle East and Africa Release Agents Market, by Form, 2017-2022 (Kilo Tons)
TABLE 382 Rest of Middle East and Africa Release Agents Market, by Form, 2023-2030 (Kilo Tons)
TABLE 383 Rest of Middle East and Africa Release Agents Market, by Ingredients, 2017-2022 (US$ Mn)
TABLE 384 Rest of Middle East and Africa Release Agents Market, by Ingredients, 2023-2030 (US$ Mn)
TABLE 385 Rest of Middle East and Africa Release Agents Market, by Ingredients, 2017-2022 (Kilo Tons)
TABLE 386 Rest of Middle East and Africa Release Agents Market, by Ingredients, 2023-2030 (Kilo Tons)
TABLE 387 Rest of Middle East and Africa Release Agents Market, by Application, 2017-2022 (US$ Mn)
TABLE 388 Rest of Middle East and Africa Release Agents Market, by Application, 2023-2030 (US$ Mn)
TABLE 389 Rest of Middle East and Africa Release Agents Market, by Application, 2017-2022 (Kilo Tons)
TABLE 390 Rest of Middle East and Africa Release Agents Market, by Application, 2023-2030 (Kilo Tons)

Frequently Asked Questions 

How does COVID-19 Impact the global release agents market?

The market was affected by COVID-19 as a result of the change in consumption patterns and the stockpiling of processed foods. Policies of social exclusion brought about by the epidemic and a decline in the supply of raw materials had a big impact on the market’s supply chain.

Which is the leading region of the market for release agents?

North America accounted for the most heightened share in the global release agents market.

What are the key drivers for the growth of the release agents market?

The market for release agents is developing quickly as a result of factors such their high physical stability, convenience of use when sprayed on, and the use of natural or organic agents, both of which are advantageous to release agents and the demand for bakery items.

Which is the major segment in the release agents market by form?

The liquid segment had a major share in the global market in 2022.

Which is the major segment in the release agents market by application?

The bakery products segment had a major share in the global market.

Cosmetic Ingredients Market

Published:
Report ID: 3703

Hydrocolloids Market

Published:
Report ID: 36265

Ion Exchange Resins Market

Published:
Report ID: 36220

Herbal Extract Market

Published:
Report ID: 36211

Fiber Reinforced Polymer (FRP) Composites Market

Published:
Report ID: 36197

Bio-based Polycarbonate Market

Published:
Report ID: 36188

Middle East and Africa Carbon Black Market

Published:
Report ID: 36181

India Thermic Fluids Market

Published:
Report ID: 36178

Europe Green Hydrogen Market

Published:
Report ID: 36175

Dodecanedioic Acid Market

Published:
Report ID: 36167

Asia Pacific Nickel Mining Market

Published:
Report ID: 36084

Asphalt Additives Market

Published:
Report ID: 36074

Purchase Options

$2999
Delivery Format: Excel.
$4999
Designed for the individual purchaser.
$6999
Users located at a single corporate site or regional office.
$7999
Allowed for unlimited sharing globally within one company.
Smallform of Sample request

Have a question?

User Profile

Don’t settle for less – trust Mitul to help you find the best solution.

Report delivery within 24 to 48 hours

– Other Info –

What people say?-

User Review

I am very impressed with the information in this report. The author clearly did their research when they came up with this product and it has already given me a lot of ideas.

Jana Schmidt
CEDAR CX Technologies

– Connect with us –

Phone

+91 6232 49 3207


support

24/7 Research Support


sales@credenceresearch.com

– Research Methodology –

Going beyond the basics: advanced techniques in research methodology

– Trusted By –

Pepshi, LG, Nestle
Motorola, Honeywell, Johnson and johnson
LG Chem, SIEMENS, Pfizer
Unilever, Samsonite, QIAGEN