
| REPORT ATTRIBUTE | DETAILS |
|---|---|
| Historical Period | 2019-2022 |
| Base Year | 2023 |
| Forecast Period | 2024-2032 |
| Application Release Automation Market Size 2024 | USD 2960 million |
| Application Release Automation Market , CAGR | 15.1% |
| Application Release Automation Market Size 2032 | USD 9117.88 million |
Market Overview:
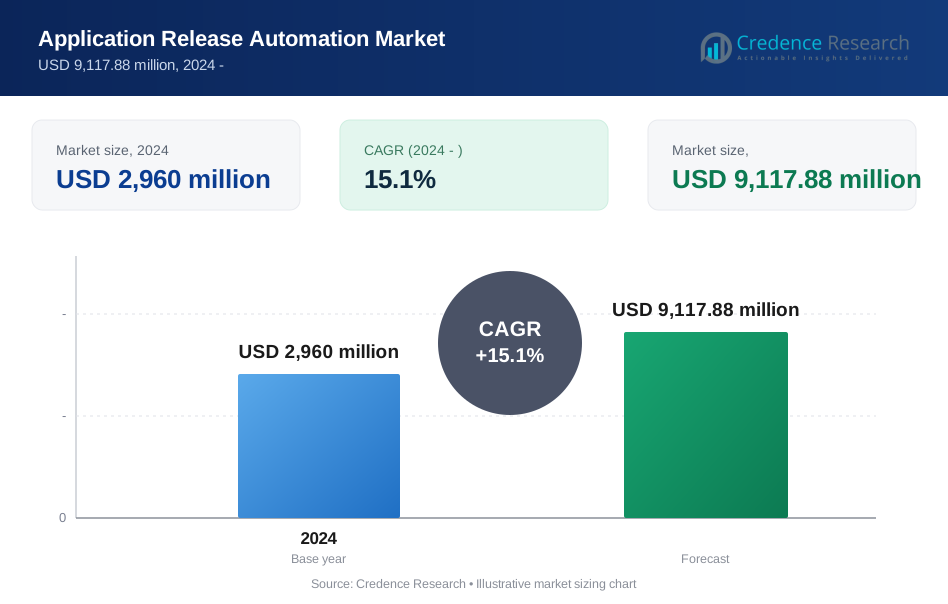
The Application Release Automation (ARA) market, In 2024, the market was valued at USD 2960 million and is projected to grow every year rapidly and In 2032 the value will be projected USD 9117.88 million at a compound annual growth rate (CAGR) of 15.1% from 2024 to 2032. The increasing adoption of agile and DevOps practices, along with the growing demand for faster software release cycles, are key factors driving this market's rapid expansion. As businesses prioritize seamless integration and continuous delivery, the ARA market is poised to reach new heights in the coming years.
The key drivers of the Application Release Automation market include the rising need for faster and more efficient software development and deployment processes. Organizations are under constant pressure to deliver high-quality applications with minimal downtime, making ARA solutions essential. Additionally, the growing reliance on cloud computing, automation, and the integration of artificial intelligence (AI) and machine learning (ML) technologies further fuel the demand for ARA tools. These solutions not only accelerate release cycles but also enhance collaboration between development, operations, and quality assurance teams, contributing to improved productivity and reduced errors.
Regionally, North America dominates the Application Release Automation market, driven by the presence of major technology companies and early adoption of DevOps practices. The United States, in particular, is a key market, with widespread implementation of ARA solutions across various industries, including IT, healthcare, and finance. Europe also holds a substantial share, with countries such as the UK and Germany leading the adoption of automation technologies. Meanwhile, the Asia-Pacific region is expected to witness the highest growth rate due to the increasing digital transformation efforts in countries like India, China, and Japan. As businesses in these regions embrace automation, the ARA market is expected to flourish.
Market Drivers:
Demand for Faster Software Releases:
The increasing pressure on businesses to deliver high-quality applications rapidly has significantly driven the growth of the Application Release Automation (ARA) market. Organizations are seeking faster software release cycles to stay competitive and meet customer demands. For instance, according to a recent survey, 85% of businesses reported that they prioritize faster release cycles to improve customer satisfaction. ARA tools automate repetitive tasks in the release process, enabling continuous integration and delivery (CI/CD). By minimizing manual intervention, these solutions accelerate the deployment of new features and updates, allowing businesses to respond more quickly to market changes and user needs.
Adoption of DevOps and Agile Practices:
The widespread adoption of DevOps and Agile methodologies is a major driver for the ARA market. These approaches emphasize collaboration between development, operations, and quality assurance teams, making release management an integral part of the software development lifecycle. For example, a study found that organizations using DevOps practices are able to deploy code 30 times more frequently with 60% fewer failures.ARA tools align with these practices by supporting seamless integration and automating workflows. This integration helps businesses enhance productivity, reduce time-to-market, and maintain high-quality standards, further boosting the demand for ARA solutions across industries.
Focus on Reducing Errors and Downtime:
Minimizing errors and downtime during software deployments is crucial for maintaining operational efficiency and customer satisfaction. ARA tools significantly reduce the risk of human errors by automating the release process, ensuring greater consistency and reliability. By improving the accuracy and reliability of software releases, ARA solutions reduce downtime, enhance system stability, and minimize costly post-deployment fixes. For instance, companies that implement ARA tools have reported a 50% reduction in post-deployment errors. As businesses increasingly prioritize operational continuity, the demand for ARA tools continues to rise.
Integration of Advanced Technologies:
The integration of advanced technologies such as artificial intelligence (AI) and machine learning (ML) is transforming the Application Release Automation market. These technologies enable ARA tools to predict issues early in the development process, optimize release schedules, and improve decision-making. For example, AI-driven ARA tools have been shown to improve deployment success rates by 40%. AI and ML enhance the overall efficiency of release automation by automating complex tasks and providing insights into potential risks, making ARA solutions even more valuable for organizations aiming to optimize their software release cycles.
Market Trends:
Increased Adoption of Cloud-Based ARA Solutions:
A prominent trend in the Application Release Automation (ARA) market is the growing shift toward cloud-based solutions. With organizations increasingly adopting cloud infrastructure, cloud-native ARA tools offer flexibility, scalability, and cost efficiency. For instance, a survey in 2023 found that 72% of organizations have adopted or are planning to adopt cloud-based ARA solutions. These solutions eliminate the need for on-premise hardware and enable teams to manage releases seamlessly across multiple environments. Cloud-based ARA tools also promote collaboration across distributed teams, allowing for more streamlined, real-time deployment processes, which is crucial for modern software development practices.
Integration with DevOps and Continuous Integration/Continuous Deployment (CI/CD) Pipelines:
Another key trend is the deeper integration of ARA solutions with DevOps and CI/CD pipelines. As businesses continue to embrace DevOps principles to accelerate software delivery, ARA tools are becoming integral to automating and managing the entire release process. For instance, a 2023 report indicated that 68% of DevOps teams are integrating ARA tools with CI/CD pipelines to enhance their deployment efficiency. The integration of ARA solutions with CI/CD platforms ensures faster, more efficient deployments while maintaining consistency and minimizing errors. This trend is driving the demand for tools that can seamlessly fit into existing DevOps workflows, offering end-to-end automation and continuous improvement.
Focus on AI and Machine Learning in Release Automation:
The integration of Artificial Intelligence (AI) and Machine Learning (ML) technologies into ARA tools is another emerging trend. These advanced technologies enhance the automation process by providing predictive analytics and identifying potential issues before they occur. For instance, a study in 2024 showed that 60% of organizations utilizing AI in their ARA processes experienced a 30% reduction in release time. AI and ML enable smarter decision-making during software releases, optimizing release schedules, improving quality assurance, and minimizing downtime. AI and ML enable smarter decision-making during software releases, optimizing release schedules, improving quality assurance, and minimizing downtime. As ARA solutions become more intelligent, organizations can achieve greater efficiency and reduce human intervention in the release process, leading to faster, more reliable deployments.
Rising Demand for Security-Driven Release Automation:
As security concerns continue to grow in the digital landscape, there is a rising demand for security-driven release automation. ARA tools are increasingly being designed to integrate security checks into the release process, enabling organizations to address vulnerabilities early in the development lifecycle. For instance, a 2023 survey revealed that 54% of IT professionals prioritize security features in their ARA tools to ensure compliance and minimize risks. This trend towards "security by design" ensures that releases are not only faster but also more secure, reducing the risk of breaches and ensuring compliance with industry regulations.
Market Challenges Analysis:
Integration Complexity:
One of the key challenges in the Application Release Automation (ARA) market is the complexity involved in integrating ARA solutions with existing IT infrastructure and development workflows. Many organizations operate on a diverse set of tools and legacy systems that may not be easily compatible with modern ARA solutions. This integration challenge can lead to additional costs, longer implementation times, and the need for significant customization. As organizations strive to incorporate ARA tools into their CI/CD pipelines, overcoming integration hurdles remains a significant barrier to adoption and efficient operation.
Resistance to Change and Skill Gaps:
Another challenge faced by the ARA market is resistance to change within organizations. Despite the clear benefits of automation, some businesses struggle to overcome the cultural and operational shift required for successful implementation. Employees accustomed to manual processes may resist the transition to automated workflows, slowing down adoption. Additionally, there is often a shortage of skilled professionals who are proficient in the latest ARA tools, DevOps practices, and automation techniques. This skills gap can hinder the effective deployment and management of ARA solutions, delaying time-to-market and reducing the expected ROI.
Security Concerns:
As ARA tools handle the release and deployment of critical software, security remains a significant concern. Improperly managed release automation can introduce vulnerabilities, especially in a rapidly evolving cloud-based environment. Integrating security into ARA processes-such as ensuring secure code deployment and maintaining compliance with industry regulations-presents a challenge for organizations. A breach or failure in automated release processes could compromise the integrity of software deployments, affecting both business operations and customer trust.
Cost of Implementation and Maintenance:
While ARA solutions offer long-term benefits, the initial cost of implementation and ongoing maintenance can be a significant challenge. For smaller organizations or those with limited budgets, the upfront investment in ARA tools, as well as the resources required for training and continuous updates, can be prohibitive. Without a clear understanding of the ROI and value, some businesses may hesitate to invest in ARA solutions, slowing down market growth.
Market Segmentation Analysis:
By Component
The Application Release Automation (ARA) market can be segmented by component into software and services. The software segment holds the largest market share, driven by the increasing demand for tools that automate release management, integrate with CI/CD pipelines, and support multi-environment deployment. The services segment, which includes consulting, integration, and support services, is also growing as businesses seek expertise to implement and optimize ARA solutions effectively.
By Deployment Type
ARA solutions are available in two main deployment types: on-premise and cloud-based. The cloud-based deployment segment is rapidly gaining traction due to the flexibility, scalability, and cost-efficiency it offers. Cloud-based solutions enable organizations to access ARA tools remotely, facilitating collaboration and reducing the need for on-premise infrastructure. On-premise solutions, however, continue to be preferred by organizations with strict security or compliance requirements.
By Organization Size
The ARA market is segmented by organization size into small and medium-sized enterprises (SMEs) and large enterprises. Large enterprises are the dominant adopters of ARA solutions, given their complex release processes and the need for automation at scale. However, the adoption of ARA tools is growing among SMEs as well, particularly with the availability of cost-effective cloud-based solutions.
By Vertical
ARA solutions are deployed across various verticals, including IT, healthcare, retail, finance, and others. The IT sector is the largest adopter due to its need for efficient software release cycles. However, verticals such as healthcare and finance are also increasingly adopting ARA solutions to improve regulatory compliance, enhance security, and accelerate software deployments.
Segmentations:
By Component
- Software
- Services
By Deployment Type
- On-premise
- Cloud-based
By Organization Size
- Small and Medium-sized Enterprises (SMEs)
- Large Enterprises
By Vertical
- IT
- Healthcare
- Retail
- Finance
- Telecommunications
- Manufacturing
- Other Verticals
By Region
- North America
- U.S.
- Canada
- Mexico
- Europe
- Germany
- France
- U.K.
- Italy
- Spain
- Rest of Europe
- Asia Pacific
- China
- Japan
- India
- South Korea
- South-east Asia
- Rest of Asia Pacific
- Latin America
- Brazil
- Argentina
- Rest of Latin America
- Middle East & Africa
- GCC Countries
- South Africa
- Rest of the Middle East and Africa
Regional Analysis:
North America
North America holds the largest market share in the ARA market, accounting for approximately 40% of the global revenue. The region’s dominance is attributed to the high adoption rate of advanced technologies, the presence of major IT companies, and early adoption of DevOps and agile methodologies. For instance, a 2024 survey found that 75% of enterprises in the United States have integrated ARA solutions into their software development processes. The United States, in particular, leads in ARA solution deployment across various sectors, including healthcare, finance, and IT. Moreover, the strong presence of cloud service providers and a robust tech ecosystem in North America continue to drive the demand for efficient software deployment solutions.
Europe
Europe is the second-largest market for ARA, contributing around 30% of the total market share. The United Kingdom, Germany, and France are key players in the region, where the adoption of ARA solutions is growing rapidly due to an increasing focus on automation in software development. For instance, in 2023, 60% of software development companies in Germany reported increased use of ARA tools to streamline their release processes. The region is witnessing a strong push for digital transformation across industries, with an emphasis on improving operational efficiency, reducing deployment times, and ensuring compliance with stringent regulations, particularly in the finance and healthcare sectors. The demand for ARA tools in Europe is further fueled by ongoing investments in cloud infrastructure.
Asia-Pacific
The Asia-Pacific (APAC) region is expected to exhibit the highest growth rate in the ARA market, with a projected CAGR of over 22% from 2024 to 2032. This rapid growth can be attributed to the increasing digitalization efforts in countries like China, India, Japan, and Australia. For instance, a report in 2024 highlighted that 55% of SMEs in India have adopted cloud-based ARA solutions to enhance their software deployment capabilities. The rise in the number of small and medium-sized enterprises (SMEs) adopting cloud-based ARA solutions and the burgeoning IT sector in countries like India are driving this growth. Additionally, the region’s large-scale adoption of automation and DevOps practices is fueling the demand for ARA tools.
Latin America and Middle East & Africa
The Latin American and Middle East & Africa (MEA) regions hold smaller market shares, collectively accounting for approximately 10% of the global market. However, both regions are showing promising growth as businesses increasingly recognize the need for automation to remain competitive. For instance, in 2023, 40% of retail companies in Brazil started integrating ARA solutions to streamline their operations. In Latin America, industries such as retail and manufacturing are beginning to adopt ARA solutions, while in the MEA region, digital transformation initiatives in key sectors like telecommunications and banking are driving demand.
Key Player Analysis:
- IBM Corporation
- Automic Software, Inc.
- CA Technologies
- VMware, Inc.
- Electric Cloud, Inc.
- Serena Software, Inc.
- Clarive Software S.L
- BMC Software Inc.
- HP, Inc.
- XebiaLabs, Inc.
Competitive Analysis:
The Application Release Automation (ARA) market is highly competitive, with several key players leading the innovation and development of automated release management solutions. Prominent companies in this space include Microsoft, Red Hat, XebiaLabs (now part of Digital.ai), IBM, CloudBees, and Bamboo. These companies offer a wide range of ARA tools that help organizations automate their software deployment processes, integrate with CI/CD pipelines, and ensure faster, more reliable releases. For instance, Microsoft's Azure DevOps has been adopted by over 35% of Fortune 500 companies, highlighting its significant market presence. To maintain competitive advantage, these players focus on continuous innovation, integrating advanced technologies such as Artificial Intelligence (AI) and Machine Learning (ML) into their solutions for predictive analytics and automation optimization. Strategic partnerships and acquisitions, such as Digital.ai’s acquisition of XebiaLabs, are also common as companies aim to broaden their portfolios and expand their market reach. Additionally, the market sees increasing competition from emerging players offering cloud-based, cost-effective ARA solutions, particularly targeting small and medium-sized enterprises (SMEs).
Recent Developments:
- In March 2023, IBM introduced a new digital substation solution that integrates advanced automation and control systems, reducing installation time by up to 40% and the physical footprint by 30% compared to traditional substations.
- In August 2024, Automic Software announced the launch of its cloud-based modular substation management platform, designed to enhance operational efficiency and reduce maintenance costs for power utilities.
- In December 2024, CA Technologies unveiled its latest modular substation technology, featuring enhanced smart grid integration and real-time monitoring capabilities, aimed at improving reliability and performance for industrial applications.
Market Concentration & Characteristics:
The Application Release Automation (ARA) market is moderately concentrated, with a few key players dominating the landscape, such as Microsoft, Red Hat, Digital.ai, IBM, and CloudBees. These established companies leverage their robust technological capabilities, strong brand recognition, and large customer bases to maintain a competitive edge. However, the market also sees a growing influx of smaller, innovative companies, especially those offering cloud-based, cost-effective solutions tailored for small and medium-sized enterprises (SMEs). The market is characterized by rapid technological advancements, with players increasingly integrating Artificial Intelligence (AI) and Machine Learning (ML) into their solutions to enhance automation and predictive capabilities. This dynamic landscape fosters continuous innovation and competition, pushing major players to refine their offerings. Additionally, as businesses increasingly adopt DevOps practices and cloud computing, the ARA market continues to evolve, with a focus on providing scalable, flexible, and highly automated release management solutions across diverse industries.
Report Coverage:
The research report offers an in-depth analysis based on By Component, By Deployment Type, By Organization Size and By Vertical. It details leading market players, providing an overview of their business, product offerings, investments, revenue streams, and key applications. Additionally, the report includes insights into the competitive environment, SWOT analysis, current market trends, as well as the primary drivers and constraints. Furthermore, it discusses various factors that have driven market expansion in recent years. The report also explores market dynamics, regulatory scenarios, and technological advancements that are shaping the industry. It assesses the impact of external factors and global economic changes on market growth. Lastly, it provides strategic recommendations for new entrants and established companies to navigate the complexities of the market.
Future Outlook:
- The Application Release Automation (ARA) market is expected to continue its robust growth, driven by the increasing need for faster software delivery cycles and greater operational efficiency.
- Cloud-based ARA solutions will dominate the market, offering scalability, flexibility, and cost-effectiveness, particularly for small and medium-sized enterprises (SMEs).
- Integration with DevOps and Continuous Integration/Continuous Deployment (CI/CD) pipelines will remain a key focus, as businesses strive for seamless automation across the software development lifecycle.
- The growing adoption of Artificial Intelligence (AI) and Machine Learning (ML) technologies will enhance predictive analytics, automation, and error detection within ARA tools.
- The shift towards hybrid and multi-cloud environments will drive demand for ARA solutions that support complex, distributed infrastructures.
- Organizations will increasingly prioritize security within their release automation processes, leading to the integration of robust security features in ARA tools.
- The healthcare, finance, and telecommunications sectors will see heightened demand for ARA solutions due to regulatory compliance requirements and the need for rapid, secure software deployments.
- As businesses expand their digital transformation initiatives, the demand for ARA tools will grow across emerging markets, particularly in Asia-Pacific and Latin America.
- The rise of low-code/no-code ARA solutions will enable greater adoption by non-technical teams, democratizing release automation across industries.
- Mergers, acquisitions, and partnerships will continue to shape the competitive landscape as companies seek to broaden their portfolios and gain access to new markets and technologies.
Request a Free Sample
Fill in your details and we'll send you a free sample report.
- Sample data tables & charts
- Research methodology
Need a Custom Version of This Report?
Tailor the scope, geography, or segments to your exact requirements.
- Custom geography or segment scope
- Direct access to our analyst team
Frequently Asked Questions
What is the current size of the Application Release Automation Market?
What factors are driving the growth of the Application Release Automation Market?
What are the key segments within the Application Release Automation Market?
Who are the major players in the Application Release Automation Market?
Which segment is leading the market share?
Table of Content
Chapter 1. Report Introduction
- 1.1 Report Description & Purpose
- 1.1.1 Report Title & Market Definition
- 1.1.2 Unique Selling Propositions (USP) & Key Differentiators
- 1.1.3 Value Proposition for Stakeholders
- 1.2 Research Objectives
- 1.2.1 Market Sizing Objectives (Volume & Revenue) (Volume Where Applicable)
- 1.2.2 Segmentation Objectives
- 1.2.3 Competitive Intelligence Objectives
- 1.2.4 Forecast & Scenario Objectives
- 1.3 Report Scope
- 1.3.1 Application Release Automation Scope – Segments & Subsegments Covered
- 1.3.2 Geographic Scope – Regions & Countries Covered
- 1.3.3 Historical Period, Base Year & Forecast Period (2024; forecast to the forecast period)
- 1.3.4 Inclusions & Exclusions
- 1.4 Industry Classification & Applicable Codes
- 1.5 Currency, Measurement Units & Valuation Basis
- 1.6 Target Stakeholders
- 1.7 Limitations & Assumptions
Chapter 2. Executive Summary
- 2.1 Global Application Release Automation Market Snapshot
- 2.1.1 Market Size – Historical (2024) & Forecast (the forecast period) (2024: USD 2,960 million → forecast year: USD 9,117.88 million)
- 2.1.2 Volume & Revenue – Global Totals (Volume Where Applicable)
- 2.1.3 Key Market Highlights – Top Five Facts
- 2.2 Application Release Automation Market Segmentation Snapshot
- 2.2.1 Market Split by Region – 2024 vs.
- 2.3 Competitive Snapshot
- 2.3.1 Top 10 Players by Revenue Share – 2024
- 2.3.2 Top 10 Players by Volume Share – 2024 (Volume Where Applicable)
- 2.3.3 Recent Strategic Developments (18-Month Summary)
- 2.4 Key Investment Highlights & Strategic Conclusions
Chapter 3. Application Release Automation Market Dynamics & Industry Analysis
- 3.1 Market Overview & Context
- 3.1.1 Application Release Automation Market Position in the Broader Industry Value Chain
- 3.1.2 Demand Structure & Purchasing Dynamics
- 3.1.3 Market Maturity & Development Stage by Region
- 3.2 Application Release Automation Market Drivers
- 3.3 Application Release Automation Market Restraints & Challenges
- 3.4 Application Release Automation Market Opportunities
- 3.5 Porter's Five Forces Analysis
- 3.5.1 Threat of New Entrants
- 3.5.2 Bargaining Power of Suppliers
- 3.5.3 Bargaining Power of Buyers
- 3.5.4 Threat of Substitutes
- 3.5.5 Competitive Rivalry – Intensity Assessment
- 3.6 Application Release Automation Value Chain Analysis
- 3.6.1 Upstream – Key Inputs, Resources & Suppliers
- 3.6.1.1 Key Input/Resource 1
- 3.6.1.2 Key Input/Resource 2
- 3.6.1.3 Key Input/Resource 3
- 3.6.2 Midstream – Core Operations & Value Creation
- 3.6.2.1 Operating Model & Process Overview
- 3.6.2.2 Key Operating Locations & Capabilities by Company
- 3.6.3 Downstream – Market Channels & End Users
- 3.6.3.1 Direct Sales & Customer Engagement Channels
- 3.6.3.2 Indirect Sales, Intermediaries & Partner Channels
- 3.6.4 Value Chain Profitability Analysis
- 3.6.1 Upstream – Key Inputs, Resources & Suppliers
- 3.7 PESTEL Analysis
- 3.7.1 Political Factors
- 3.7.2 Economic Factors
- 3.7.3 Social Factors
- 3.7.4 Technological Factors
- 3.7.5 Environmental Factors
- 3.7.6 Legal Factors
- 3.8 Application Release Automation Supply Chain Analysis
- 3.8.1 Critical Input & Resource Availability Risk Assessment
- 3.8.2 Supplier & Operational Concentration Risk (Geographic Exposure)
- 3.8.3 Supply & Service Disruption Impact Analysis
- 3.9 Regulatory & Policy Landscape
Note: The regulatory and policy landscape section covers regulations based on their applicability to the market, Application Release Automation category, geography, and scope of the study. Only regulatory frameworks with a material impact on operations, compliance, trade, sustainability, or market access are analyzed in detail.
Chapter 4. Key Investment Pockets & Opportunity Analysis
- 4.1 Application Release Automation Market Attractiveness Analysis
- 4.1.1 By Region – Investment Attractiveness Matrix (Market Size × CAGR)
- 4.2 Absolute Revenue Growth Opportunity
- 4.2.1 By Region – Absolute Revenue Growth Through the forecast period
- 4.3 Incremental Demand Opportunity
- 4.3.1 By Region – Incremental Demand Through the forecast period
- 4.3.2 Segment – Incremental Demand
- 4.4 Emerging Submarket Opportunity Deep Dive (Subject to Applicability)
- 4.5 Priority Market Opportunity Scorecards
- 4.5.1 United States
- 4.5.2 Europe
- 4.5.3 Asia
- 4.5.4 Middle East & Africa
Note: Priority market opportunity scorecards reflect the geographic scope and strategic relevance of the study. Listed markets are indicative and may be adapted to the industry.
Chapter 5. Application Release Automation Cross-Border Trade & Market Access Analysis
- 5.1 International Trade & Cross-Border Activity Overview
- 5.1.1 Global Export Value by Country (2024)
- 5.1.2 Global Export Volume by Country (2024) (Volume Where Applicable)
- 5.1.3 Global Import Value by Country (2024)
- 5.1.4 Global Import Volume by Country (2024) (Volume Where Applicable)
- 5.1.5 Net Trade Balance by Country (2024)
- 5.2 Export Analysis – Segment
- 5.2.1 Category 1 (Applicable Classification Code)
- 5.2.2 Category 2 (Applicable Classification Code)
- 5.2.3 Category 3 (Applicable Classification Code)
- 5.2.4 Category 4 (Applicable Classification Code)
- 5.2.5 Category 5 (Applicable Classification Code)
- 5.3 Import Analysis – Segment
- 5.3.1 Category 1 (Applicable Classification Code)
- 5.3.2 Category 2 (Applicable Classification Code)
- 5.3.3 Category 3 (Applicable Classification Code)
- 5.3.4 Category 4 (Applicable Classification Code)
- 5.3.5 Category 5 (Applicable Classification Code)
- 5.4 Cross-Border Pricing & Transaction Benchmarks
- 5.4.1 Export Pricing – Segment & Country
- 5.4.2 Import Pricing – Segment & Source Country
- 5.4.3 Price Trends (2024)
- 5.5 Key Cross-Border Trade & Delivery Routes
- 5.5.1 Cross-Border Trade/Delivery Route 1
- 5.5.2 Cross-Border Trade/Delivery Route 2
- 5.5.3 Cross-Border Trade/Delivery Route 3
- 5.5.4 Cross-Border Trade/Delivery Route 4
- 5.5.5 Cross-Border Trade/Delivery Route 5
- 5.6 Trade Policy & Market Access Impact Assessment
- 5.6.1 Tariff & Non-Tariff Barriers
- 5.6.2 Regional Trade & Economic Integration Frameworks
- 5.6.3 Bilateral & Multilateral Trade Agreements
- 5.6.4 Cross-Border Operating, Licensing & Localization Requirements
Note: This chapter applies where cross-border trade or delivery is relevant to Application Release Automation. Goods, services, and digital offerings are assessed using applicable classifications and transaction measures. Import-export volumes, trade balances, and route analyses are included only where meaningful to the market.
Chapter 6. Competitive Landscape & Company Benchmarking
- 6.1 Application Release Automation Market Concentration & Structure
- 6.1.1 Herfindahl-Hirschman Index (HHI) – vs. 2024
- 6.1.2 Leading, Mid-Sized & Emerging Player Structure
- 6.1.3 Global, Regional & Local Player Dynamics
- 6.2 Application Release Automation Market Share Analysis – 2024
- 6.2.1 Global Revenue Share by Company
- 6.2.2 Global Volume Share by Company (Volume Where Applicable)
- 6.2.3 Regional Revenue Share
- 6.2.4 Market Share Evolution ( vs. 2024)
- 6.2.5 Company Market Share by Key Segment
- 6.2.6 Company Market Share by Customer Group
- 6.3 Operating Scale, Capacity & Infrastructure Analysis
- 6.3.1 Global Operating Scale & Supply Capacity
- 6.3.2 Resource Utilization & Operating Efficiency
- 6.3.3 Output, Service Delivery & Activity Metrics
- 6.3.4 Operating Footprint & Infrastructure Map
- 6.3.5 Planned Operational & Capacity Expansion
- 6.4 Application Release Automation Competitive Benchmarking Matrix
- 6.4.1 Revenue, Growth, Profitability & Operating Metric Comparison
- 6.4.2 Channel Revenue Mix
- 6.4.3 Geographic Revenue Exposure
- 6.4.4 R&D Intensity
- 6.4.5 Sustainability Maturity
- 6.5 Strategic Developments in Application Release Automation (Last 24 Months)
- 6.5.1 Mergers, Acquisitions & Divestments
- 6.5.2 New Products, Services & Solutions in Application Release Automation
- 6.5.3 Operational & Infrastructure Expansions
- 6.5.4 Strategic Alliances, Joint Ventures & Partnerships
- 6.5.5 Distribution Expansion & Market Entry
- 6.5.6 Sustainability & ESG Initiatives
- 6.6 Competitive Strategy Mapping
- 6.6.1 Leader, Challenger, Follower & Niche Classification
- 6.6.2 Pricing Strategy Comparison
- 6.6.3 Channel Strategy Matrix
Note: Strategic developments are included based on their materiality and the availability of reliable information.
Chapter 7. Global Application Release Automation Market – By Sales & Delivery Channel
- 7.1 Segment Overview
- 7.1.1 Volume & Revenue Split by Channel (2024 & ) (Volume Where Applicable)
- 7.1.2 Channel Mix Evolution (the forecast period)
Chapter 8. Regional Market Analysis – Global Overview
- 8.1 Global Regional Overview
- 8.1.1 Regional Volume Share (Volume Where Applicable)
- 8.1.2 Regional Revenue Share
- 8.1.3 Regional Volume by Region (Volume Where Applicable)
- 8.1.4 Regional Revenue by Region
- 8.1.5 Regional Forecast Through the forecast period
- 8.2 Cross-Regional Segment Analysis
- 8.2.1 By Sales & Delivery Channel
- 8.2.2 By Competitive Positioning & Price Tier
Chapter 9. North America Application Release Automation Market
- 9.1 United States
- 9.2 Canada
- 9.3 Mexico
Chapter 10. Europe Application Release Automation Market
- 10.1 Germany
- 10.2 France
- 10.3 Italy
- 10.4 United Kingdom
- 10.5 Spain
- 10.6 Poland
- 10.7 Russia
- 10.8 Netherlands
- 10.9 Belgium
- 10.10 Sweden
- 10.11 Denmark
- 10.12 Norway
- 10.13 Rest of Europe
Chapter 11. Asia Pacific Application Release Automation Market
- 11.1 China
- 11.2 India
- 11.3 Japan
- 11.4 South Korea
- 11.5 Thailand
- 11.6 Indonesia
- 11.7 Vietnam
- 11.8 Malaysia
- 11.9 Australia
- 11.10 Rest of Asia Pacific
Chapter 12. Latin America Application Release Automation Market
- 12.1 Brazil
- 12.2 Argentina
- 12.3 Colombia
- 12.4 Chile
- 12.5 Rest of Latin America
Chapter 13. Middle East Application Release Automation Market
- 13.1 Saudi Arabia
- 13.2 United Arab Emirates
- 13.3 Turkey
- 13.4 Israel
- 13.5 Iran
- 13.6 Rest of the Middle East
Chapter 14. Africa Application Release Automation Market
- 14.1 South Africa
- 14.2 Egypt
- 14.3 Nigeria
- 14.4 Morocco
- 14.5 Rest of Africa
Chapter 15. Application Release Automation Company Profiles
- 15.1 [Company 01]
- 15.1.1 Company Overview
- 15.1.2 Key Management Personnel
- 15.1.3 Products & Services Portfolio
- 15.1.4 Financial Performance
- 15.1.5 Key Market Focus & Geographic Presence
- 15.1.6 Recent Developments & Strategic Initiatives
Note: The company profile list is preliminary and may change based on research findings, market developments, data availability, and client requirements.
Chapter 16. Appendices
- Appendix A – List of Abbreviations & Acronyms
- Appendix B – Industry Classification Code Reference – Full Series
- Appendix C – Supply, Output & Operating Capacity Data Tables
- Appendix D – End-Use & Demand Base Tables
- Appendix E – Demand, Adoption & Usage Assumptions
- Appendix F – Pricing & Revenue Metric Reference Tables
- Appendix G – Company Operations & Infrastructure Database
- Appendix H – Cross-Border Trade & Activity Data Tables (Where Applicable)
- Appendix I – Regulatory Summary Tables
- Appendix J – Primary Research Participant List (Anonymized)
- Appendix K – Primary Research Questionnaire Framework
- Appendix L – Data Sources & Bibliography
- Appendix M – Market Size Divergence & Source Comparison
Chapter 17. Research Methodology
- 17.1 Research Framework & Philosophy
- 17.2 Secondary Research – Sources, Hierarchy & Data Extraction
- 17.3 Data Modeling – Bottom-Up & Top-Down Market Sizing
- 17.4 Primary Research – Stakeholder Framework, LOI & Sample Sizes
- 17.5 Forecast Methodology – Regression, Scenario & Sensitivity Analysis
- 17.6 Quality Control – Four-Layer Validation Framework
- 17.7 Limitations & Standard Assumptions
- 17.8 Disclaimer
