Silicon Anode Battery Market By Cell Type (Cylindrical, Prismatic, Pouch), By Capacity (Below 1,500 mAh, 1,500 to 2,500 mAh, Above 2,500 mAh), By Application (Electric Vehicle, Consumer Electronics, Electric Power Grids, Others) – Growth, Future Prospects And Competitive Analysis, 2019 – 2027

Price: $4999

Published: | Report ID: 11027 | Report Format : PDF

Growth in Smartphone and Electric Vehicle Demand to Boost Silicon Anode Battery Market Worldwide

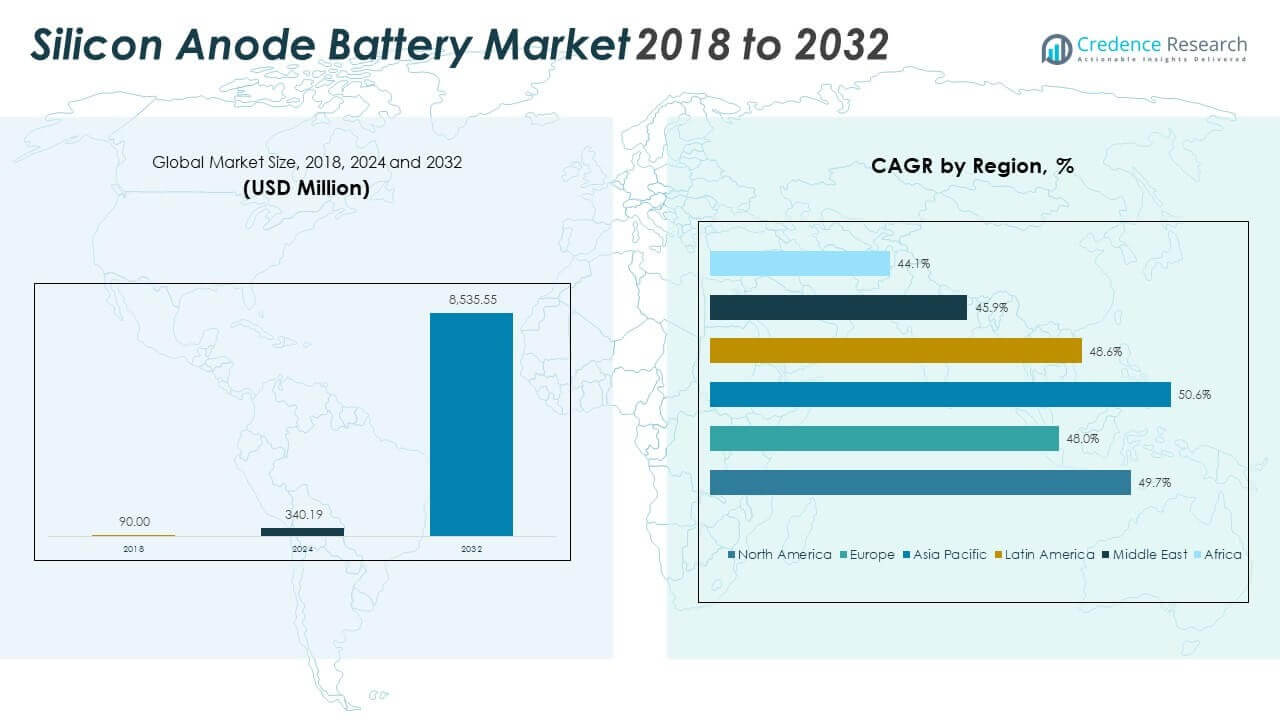
The superior properties of silicon anode batteries give a promising future for battery-operated electronics devices and electric vehicles. Silicon anode batteries have higher energy storage capacity and longer battery life than contemporarily used Li-ion batteries. These features of silicon anode battery made it suitable for its application in smartphones, tablets, laptops, cameras, pacemakers, and electric vehicles. Furthermore, the demand for smart devices will soar with the 5G cellular network technology launch in late 2020. With these dynamics, the silicon anode battery market is estimated to grow with a CAGR of 31.07% during the forecast period.

Moreover, electric vehicles require a battery that can run for long hours, and a silicon anode battery perfectly fits this requirement. In addition, increasing demand for electric vehicles and automotive companies such as Tesla, Nissan, and Audi having fierce competition among them to grab a significant share of the electric vehicle market is further influencing the demand for more durable and lighter silicon anode batteries. Thus, furthering the growth of the global silicon anode battery market.

Though the silicon anode battery market is quite confident about growth, the market contraction of smartphone-driven by highly saturated markets of developed nations and slower churn in some developing economies is expected to continue till 1H2020, until the rollout of the 5G network is expected to depreciate the growth of global silicon anode battery market during the forecast period.

Design Element 2

Access crucial information at unmatched prices!

Request your free sample report today & start making informed decisions powered by Credence Research!

Download Free Sample
CTA Design Element 3

Market Snapshot

Pouch Cell Segment to have Major Market Share

Based on cell type, the pouch segment accounted for nearly 50% of revenue from the global silicon anode battery market in 2018. Pouch cells are lighter, cheaper, and occupy the least space. These features of pouch cells made it the preferred option for use in compact application like smartphones, tablets, and other consumer electronics which requires ultra-thin enclosure. The increasing use of smartphones is the major driver for pouch cells to register the highest growth during the forecast period.

North America remains the Largest Regional Market

North America is one of the primary regions where 5G cellular network technology has been launched. Also, the electronic devices market is highly developed in countries of the region, in particular the U.S. and Canada. As a result, battery manufacturers such as Amprius Technologies, Sila Nanotechnologies Inc., and Nanotek Instruments, Inc. have established their headquarters in the U.S. These players are also getting investment from other players to improve their current battery technology and production rate. This has helped the regional silicon anode battery manufacturers in improving their market share. For instance, in April 2019, OneD Material, LLC, disclosed its patent of a new manufacturing process to produce SiNANOde anode material scaled up to 100 tons annually. Overall, in 2018, North America bagged over 35% share of the global silicon anode battery market.

Increasing Investment in Battery Technology is keeping the Market Competitive.

Major players profiled in the silicon anode battery market include Amprius Technologies, Enovix, Sila Nanotechnologies Inc., Nexeon Ltd., Samsung SDI Co. Ltd., Nanotek Instruments, Inc., OneD Material, LLC, Enevate Corporation, California Lithium Battery, Targray Technology International Inc., and Panasonic Corporation among others.

The overall silicon anode battery market is consolidated, with companies developing strategic partnerships to increase their global market share. However, with the technological innovation and entrants of new players, their investment & funding, and evolving partnership may shift the market towards fragmentation. For instance, in September 2019, WACKER Chemie AG renewed its strategic partnership with Nexeon Ltd. by investing an undisclosed sum and taking a 25% stake in the business. WACKERs’ expertise in silicon chemistry and its production of silicon-based anode material will be helpful to Nexeon Ltd. for scaling up its manufacturing volume of silicon anode material for the next-generation battery. Moreover, in April 2019, an Asian energy company, Bangchak, invested in Enevate Corporation, which has developed a battery from silicon-dominant HD-energy technology. This new investment will boost production volume and accelerate the adoption of electric vehicles worldwide.

Historical & Forecast Period

The research report presents the analysis of each segment from 2017 to 2027, considering 2018 as the base year for the research. In addition, compounded Annual Growth Rate (CAGR) for each respective segment was calculated for the forecast period from 2019 to 2027.

Shape Your Report to Specific Countries or Regions & Enjoy 30% Off!

Report Scope by Segments

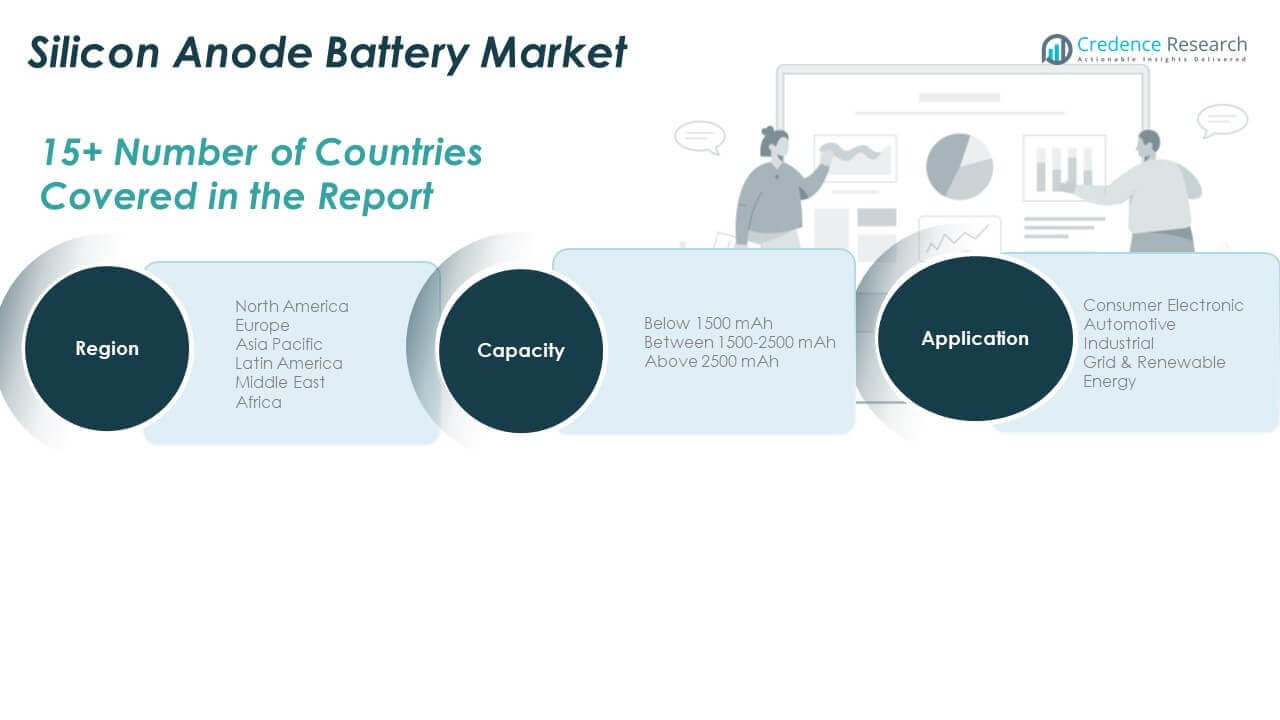
Silicon anode battery market report provides market size and estimates based on market dynamics and key trends observed in the industry. In addition, the report provides a holistic view of the global silicon anode battery market based on cell type, capacity, application, and geography.

1. Preface
1.1. Report Description
1.1.1. Purpose of the Report
1.1.2. Target Audience
1.1.3. USP and Key Offerings
1.2. Research Scope
1.3. Research Methodology
1.3.1. Phase I – Secondary Research
1.3.2. Phase II – Primary Research
1.3.3. Phase III – Expert Panel Review
1.3.4. Approach Adopted
1.3.4.1. Top-Down Approach
1.3.4.2. Bottom-Up Approach
1.3.5. Assumptions
1.4. Market Segmentation

2. Executive Summary
2.1. Market Snapshot: Global SAB Market
2.2. Global SAB Market, by Cell Type, 2018 (US$ Bn)
2.3. Global SAB Market, by Capacity, 2018 (US$ Bn)
2.4. Global SAB Market, by Application, 2018 (US$ Bn)
2.5. Global SAB Market, by Geography, 2018 (US$ Bn)

3. Market Dynamics
3.1. Introduction
3.1.1. Global SAB Market Value, 2017 – 2027, (US$ Bn)
3.2. Market Dynamics
3.2.1. Market Drivers
3.2.2. Market Restraints
3.3. Attractive Investment Proposition, by Geography, 2018
3.4. Market Positioning of Key Players, 2018
3.4.1. Major Strategies Adopted by Key Players

4. Global Silicon Anode Battery (SAB) Market, by Cell Type , 2017 – 2027 (US$ Bn)
4.1. Overview
4.2. Cylindrical
4.3. Prismatic
4.4. Pouch

5. Global Silicon Anode Battery (SAB) Market, by Capacity, 2017 – 2027 (US$ Bn)
5.1. Overview
5.2. Below 1,500 mAh
5.3. 1,500 to 2,500 mAh
5.4. Above 2,500 mAh

6. Global Silicon Anode Battery (SAB) Market, by Application, 2017 – 2027 (US$ Bn)
6.1. Overview
6.2. Electric Vehicle
6.3. Consumer Electronics
6.4. Electric Power Grids
6.5. Others (Drones, Robotics, Medical Devices, etc.)

7. North America Silicon Anode Battery (SAB) Market Analysis, 2017 – 2027 (US$ Bn)
7.1. Overview
7.1.1. North America SAB Market Value and Growth, 2017 – 2027, (US$ Bn)
7.2. North America SAB Market Value, By Type, 2017 – 2027 (US$ Bn)
7.2.1. Market Analysis
7.3. North America SAB Market Value, By Capacity, 2017 – 2027 (US$ Bn)
7.3.1. Market Analysis
7.4. North America SAB Market Value, By Application, 2017 – 2027 (US$ Bn)
7.4.1. Market Analysis
7.5. North America SAB Market Value, By Region/Country, 2017 – 2027 (US$ Bn)
7.5.1. Market Analysis
7.5.2. U.S.
7.5.3. Rest of North America

8. Europe Silicon Anode Battery (SAB) Market Analysis, 2017 – 2027 (US$ Bn)
8.1. Overview
8.1.1. Europe SAB Market Value and Growth, 2017 – 2027, (US$ Bn)
8.2. Europe SAB Market Value, By Type, 2017 – 2027 (US$ Bn)
8.2.1. Market Analysis
8.3. Europe SAB Market Value, By Capacity, 2017 – 2027 (US$ Bn)
8.3.1. Market Analysis
8.4. Europe SAB Market Value, By Application, 2017 – 2027 (US$ Bn)
8.4.1. Market Analysis
8.5. Europe SAB Market Value, By Region/Country, 2017 – 2027 (US$ Bn)
8.5.1. Market Analysis
8.5.2. U.K.
8.5.3. Germany
8.5.4. France
8.5.5. Rest of Europe

9. Asia Pacific Silicon Anode Battery (SAB) Market Analysis, 2017 – 2027 (US$ Bn)
9.1. Overview
9.1.1. Asia Pacific SAB Market Value and Growth, 2017 – 2027, (US$ Bn)
9.2. Asia Pacific SAB Market Value, By Type, 2017 – 2027 (US$ Bn)
9.2.1. Market Analysis
9.3. Asia Pacific SAB Market Value, By Capacity, 2017 – 2027 (US$ Bn)
9.3.1. Market Analysis
9.4. Asia Pacific SAB Market Value, By Application, 2017 – 2027 (US$ Bn)
9.4.1. Market Analysis
9.5. Asia Pacific SAB Market Value, By Region/Country, 2017 – 2027 (US$ Bn)
9.5.1. Market Analysis
9.5.2. Japan
9.5.3. China
9.5.4. India
9.5.5. Rest of Asia Pacific

10. Rest of the World Silicon Anode Battery (SAB) Market Analysis, 2017 – 2027 (US$ Bn)
10.1. Overview
10.1.1. Rest of the World SAB Market Value and Growth, 2017 – 2027, (US$ Bn)
10.2. Rest of the World SAB Market Value, By Type, 2017 – 2027 (US$ Bn)
10.2.1. Market Analysis
10.3. Rest of the World SAB Market Value, By Capacity, 2017 – 2027 (US$ Bn)
10.3.1. Market Analysis
10.4. Rest of the World SAB Market Value, By Application, 2017 – 2027 (US$ Bn)
10.4.1. Market Analysis
10.5. Rest of the World SAB Market Value, By Region, 2017 – 2027 (US$ Bn)
10.5.1. Market Analysis
10.5.2. Middle East & Africa
10.5.3. Latin America

11. Company Profiles
11.1. Amprius Technologies
11.2. Enovix
11.3. Sila Nanotechnologies Inc.
11.4. Nexeon Ltd.
11.5. Samsung SDI Co. Ltd.
11.6. Nanotek Instruments, Inc.
11.7. OneD Material, LLC
11.8. Enevate Corporation
11.9. California Lithium Battery
11.10. Targray Technology International Inc.
11.11. Panasonic Corporation


List of Figures

FIG. 1 Global Silicon Anode Battery (SAB) Market: Research methodology
FIG. 2 Market Size Estimation – Top Down & Bottom up Approach
FIG. 3 Global SAB Market Segmentation
FIG. 4 Global SAB Market, by Cell Type, 2018, (US$ Bn)
FIG. 5 Global SAB Market, by Capacity, 2018, (US$ Bn)
FIG. 6 Global SAB Market, by Application, 2018, (US$ Bn)
FIG. 7 Global SAB Market, by Geography, 2018 (US$ Bn)
FIG. 8 Global SAB Market Value, 2017 – 2027, (US$ Bn)
FIG. 9 Attractive Investment Proposition, by Geography, 2018
FIG. 10 Global Market Positioning of Key SAB Manufacturers, 2018
FIG. 11 Global SAB Market Value Share, by Cell Type, 2018 & 2027 (Value %)
FIG. 12 Global Cylindrical SAB Market Value, 2017 – 2027, (US$ Bn)
FIG. 13 Global Prismatic SAB Market Value, 2017 – 2027, (US$ Bn)
FIG. 14 Global Pouch SAB Market Value, 2017 – 2027, (US$ Bn)
FIG. 15 Global SAB Market Value Share, by Capacity, 2018 & 2027 (Value %)
FIG. 16 Global SAB Market Value for Capacity below 1,500 mAh, 2017 – 2027, (US$ Bn)
FIG. 17 Global SAB Market Value for Capacity 1,500 to 2,500 mAh, 2017 – 2027, (US$ Bn)
FIG. 18 Global SAB Market Value for Capacity above 2,500 mAh, 2017 – 2027, (US$ Bn)
FIG. 19 Global SAB Market Value Share, by Application, 2018 & 2027 (Value %)
FIG. 20 Global SAB Market Value for Electric Vehicle, 2017 – 2027, (US$ Bn)
FIG. 21 Global SAB Market Value for Consumer Electronics, 2017 – 2027, (US$ Bn)
FIG. 22 Global SAB Market Value for Electric Power Grids, 2017 – 2027, (US$ Bn)
FIG. 23 Global SAB Market Value for Others, 2017 – 2027, (US$ Bn)
FIG. 24 North America SAB Market Value, 2017 – 2027, (US$ Bn)
FIG. 25 Europe SAB Market Value, 2017 – 2027, (US$ Bn)
FIG. 26 Asia Pacific SAB Market Value, 2017 – 2027, (US$ Bn)
FIG. 27 Rest of the World SAB Market Value, 2017 – 2027, (US$ Bn)

List of Tables

TABLE 1 Market Snapshot: Global SAB Market Value
TABLE 2 Impact Indicators
TABLE 3 Impact Analysis of Drivers and Restraints
TABLE 4 Global SAB Market, by Cell Type, 2017-2027, (US$ Bn)
TABLE 5 Global SAB Market, by Capacity, 2017 – 2027, (US$ Bn)
TABLE 6 Global SAB Market, by Application, 2017 – 2027, (US$ Bn)
TABLE 7 Global SAB Market Value, by Region/Country, 2017 – 2027, (US$ Bn)
TABLE 8 North America SAB Market, by Cell Type, 2017-2027, (US$ Bn)
TABLE 9 North America SAB Market, by Capacity, 2017 – 2027, (US$ Bn)
TABLE 10 North America SAB Market, by Application, 2017 – 2027, (US$ Bn)
TABLE 11 North America SAB Market Value, by Region/Country, 2017 – 2027, (US$ Bn)
TABLE 12 Europe SAB Market, by Cell Type, 2017-2027, (US$ Bn)
TABLE 13 Europe SAB Market, by Capacity, 2017 – 2027, (US$ Bn)
TABLE 14 Europe SAB Market, by Application, 2017 – 2027, (US$ Bn)
TABLE 15 Europe SAB Market Value, by Region/Country, 2017 – 2027, (US$ Bn)
TABLE 16 Asia Pacific SAB Market, by Cell Type, 2017-2027 (US$ Bn)
TABLE 17 Asia Pacific SAB Market, by Capacity, 2017 – 2027 (US$ Bn)
TABLE 18 Asia Pacific SAB Market, by Application, 2017 – 2027 (US$ Bn)
TABLE 19 Asia Pacific SAB Market Value, by Region/Country, 2017 – 2027, (US$ Bn)
TABLE 20 Rest of the World SAB Market, by Cell Type, 2017 – 2027, (US$ Bn)
TABLE 21 Rest of the World SAB Market, by Capacity, 2017 – 2027, (US$ Bn)
TABLE 22 Rest of the World SAB Market, by Application, 2017 – 2027, (US$ Bn)
TABLE 23 Rest of the World SAB Market Value, by Region, 2017 – 2027, (US$ Bn)
TABLE 24 Amprius Technologies: Company Snapshot (Business Description; Product Portfolio; Financial Information; Business Overview and Recent Development)
TABLE 25 Enovix: Company Snapshot (Business Description; Product Portfolio; Financial Information; Business Overview and Recent Development)
TABLE 26 Sila Nanotechnologies Inc.: Company Snapshot (Business Description; Product Portfolio; Financial Information; Business Overview and Recent Development)
TABLE 27 Nexeon Ltd.: Company Snapshot (Business Description; Product Portfolio; Financial Information; Business Overview and Recent Development)
TABLE 28 Samsung SDI Co. Ltd.: Company Snapshot (Business Description; Product Portfolio; Financial Information; Business Overview and Recent Development)
TABLE 29 Nanotek Instruments, Inc.: Company Snapshot (Business Description; Product Portfolio; Financial Information; Business Overview and Recent Development)
TABLE 30 OneD Material, LLC: Company Snapshot (Business Description; Product Portfolio; Financial Information; Business Overview and Recent Development)
TABLE 31 Enevate Corporation: Company Snapshot (Business Description; Product Portfolio; Financial Information; Business Overview and Recent Development)
TABLE 32 California Lithium Battery: Company Snapshot (Business Description; Product Portfolio; Financial Information; Business Overview and Recent Development)
TABLE 33 Targray Technology International Inc.: Company Snapshot (Business Description; Product Portfolio; Financial Information; Business Overview and Recent Development)
TABLE 34 Panasonic Corporation: Company Snapshot (Business Description; Product Portfolio; Financial Information; Business Overview and Recent Development)

Frequently Asked Questions:

What is the size of Silicon Anode Battery Market?

The market for Silicon Anode Battery is expected to reach US$ XX Bn in 2027.

What is the Silicon Anode Battery Market CAGR?

The Silicon Anode Battery market is expected to see significant CAGR growth over the coming years, at 31.07%.

What is the Forecast period considered for Silicon Anode Battery Market?

The report is forecasted from 2019-2027.

What is the base year considered for Silicon Anode Battery Market?

The base year of this report is 2018.

Who are the major players in this market?

Amprius Technologies, Enovix, Sila Nanotechnologies Inc., Nexeon Ltd., Samsung SDI Co. Ltd., Nanotek Instruments, Inc., OneD Material, LLC, Enevate Corporation are some of the major players in the global market.

Saudi Arabia Managed Security Services Market

Published:
Report ID: 36393

Microwave Oven Market

Published:
Report ID: 36314

Inkjet Coders Market

Published:
Report ID: 6669

Rich Communication Services Market

Published:
Report ID: 35774

Middle East and Africa Real-Time Payments Market

Published:
Report ID: 35770

Vietnam Managed Security Services (MSS) Market

Published:
Report ID: 35766

Middle East and Africa EdTech and Smart Classroom Market

Published:
Report ID: 35756

Digital Business Support System (DBSS) Market

Published:
Report ID: 35732

China Artificial Intelligence (AI) Market

Published:
Report ID: 35729

Asia-Pacific Workforce Management Software Market

Published:
Report ID: 35719

Mobile Wallet Market

Published:
Report ID: 8977

Recirculating Chillers Market

Published:
Report ID: 8862

Purchase Options

$2999
Delivery Format: Excel.
$4999
Designed for the individual purchaser.
$6999
Users located at a single corporate site or regional office.
$7999
Allowed for unlimited sharing globally within one company.
Smallform of Sample request

Have a question?

User Profile

Don’t settle for less – trust Mitul to help you find the best solution.

Report delivery within 24 to 48 hours

– Other Info –

What people say?-

User Review

I am very impressed with the information in this report. The author clearly did their research when they came up with this product and it has already given me a lot of ideas.

Jana Schmidt
CEDAR CX Technologies

– Connect with us –

Phone

+91 6232 49 3207


support

24/7 Research Support


sales@credenceresearch.com

– Research Methodology –

Going beyond the basics: advanced techniques in research methodology

– Trusted By –

Pepshi, LG, Nestle
Motorola, Honeywell, Johnson and johnson
LG Chem, SIEMENS, Pfizer
Unilever, Samsonite, QIAGEN