
MRI wire sets the base while fusion tape adds growth
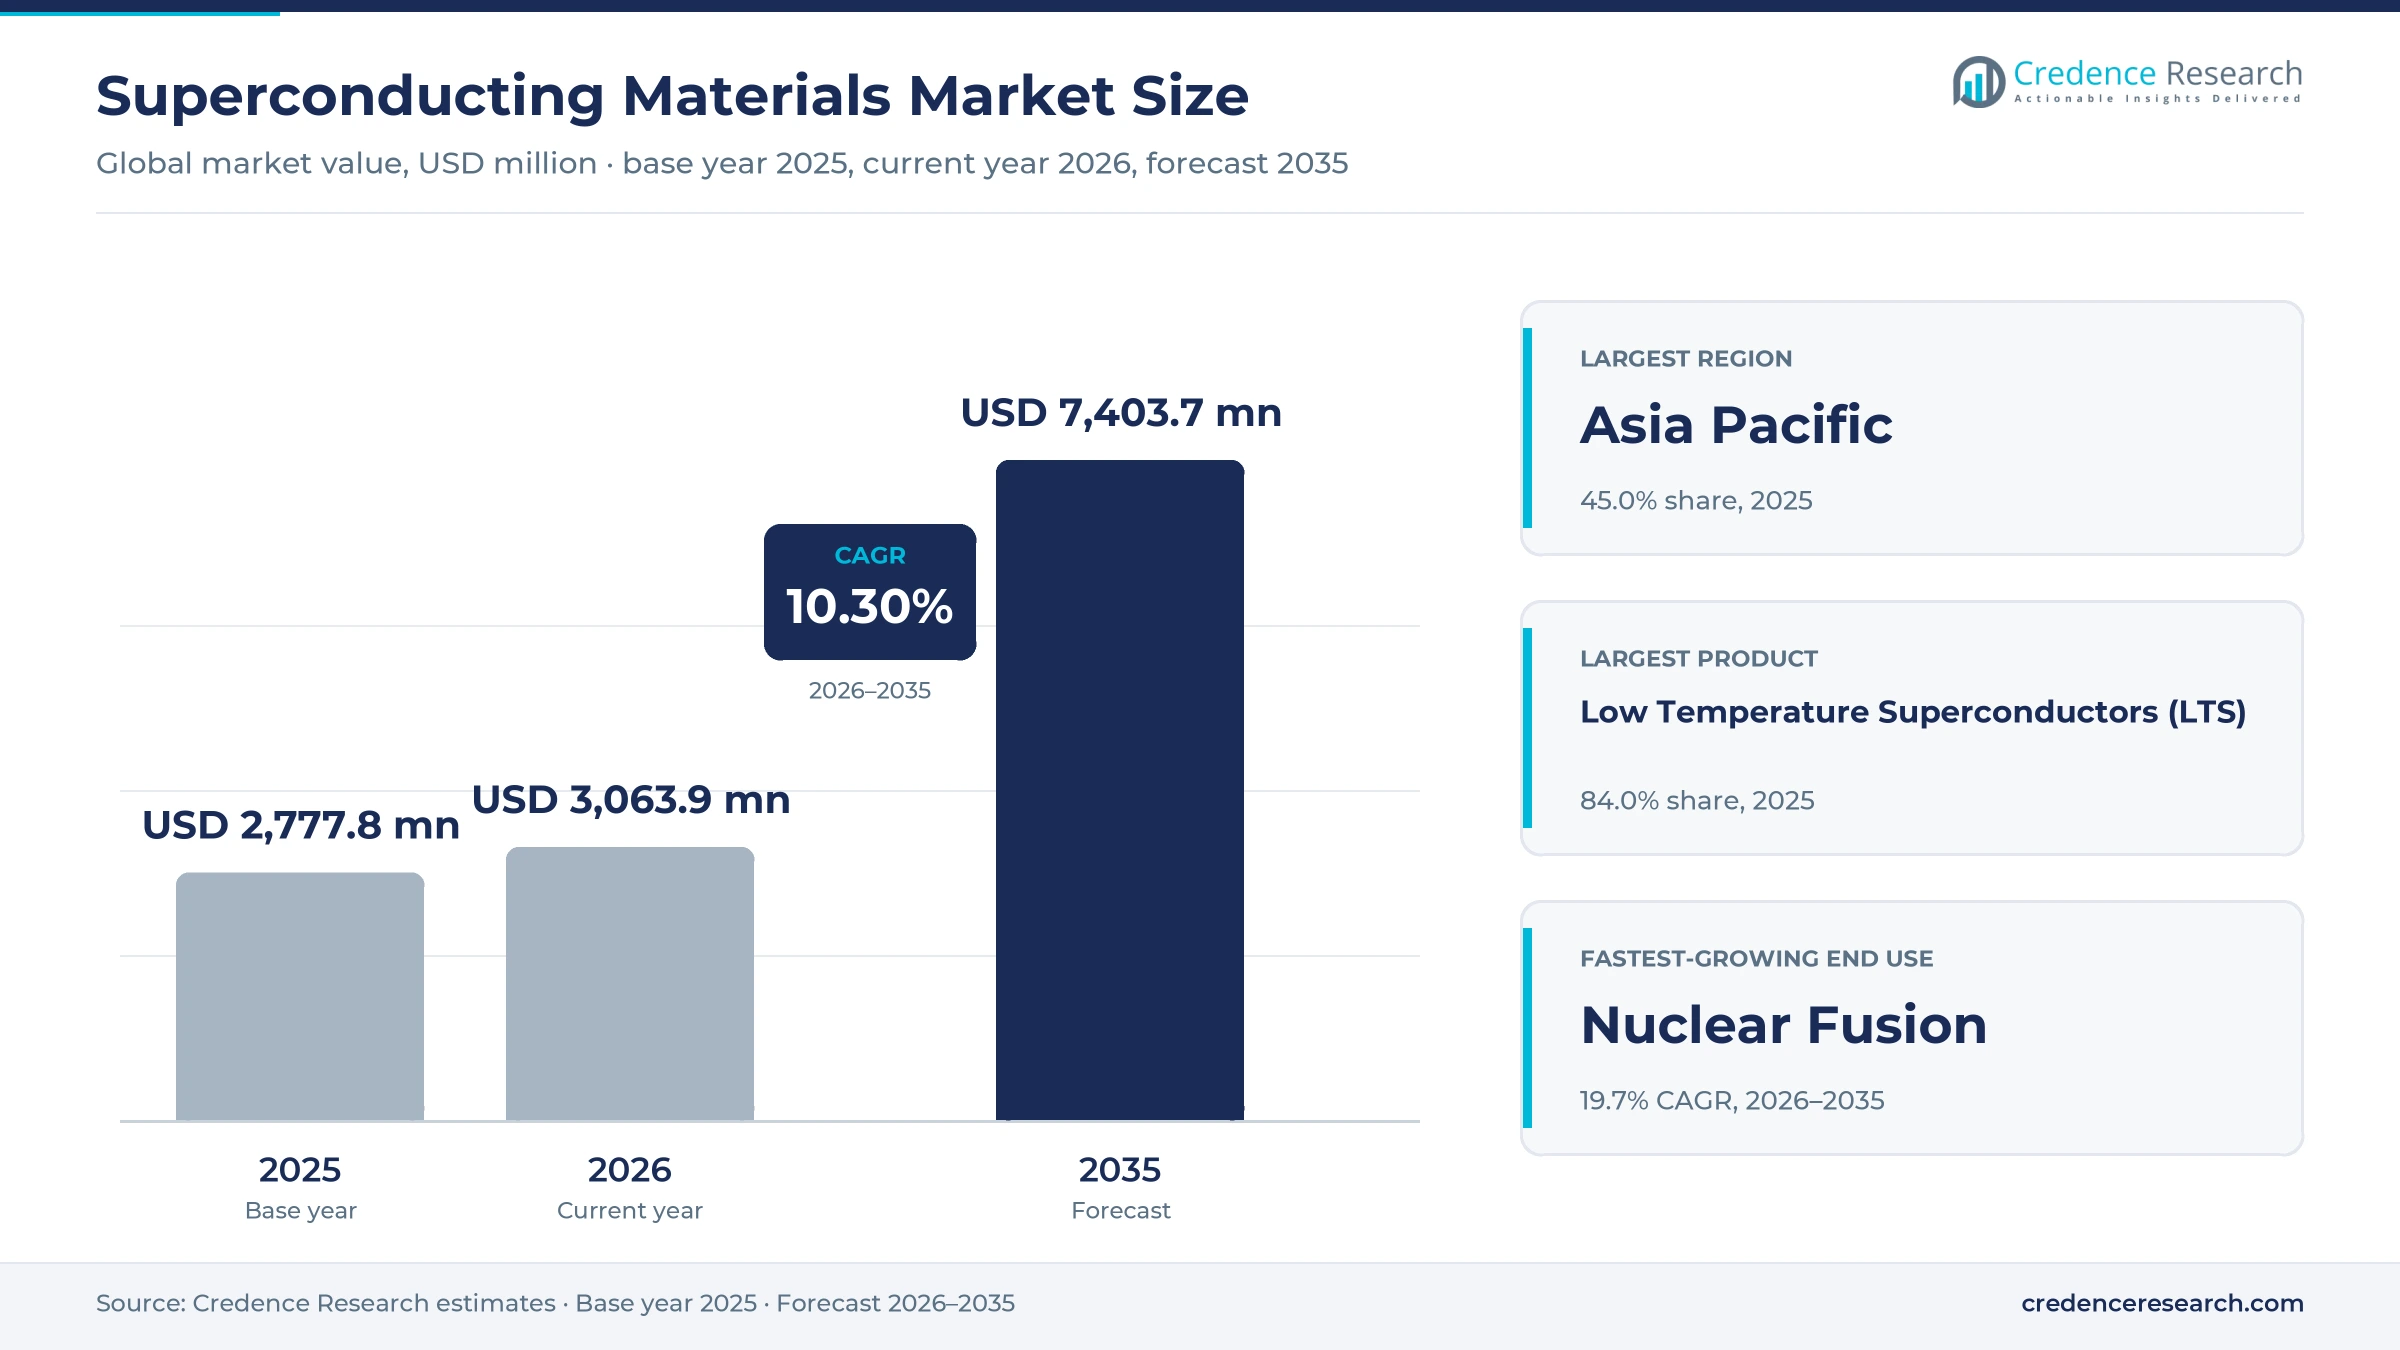
The global superconducting materials market was valued at USD 2.78 billion in 2025 and is projected to increase from USD 3.06 billion in 2026 to USD 7.40 billion by 2035, registering a CAGR of 10.30% during 2026–2035. Demand comes from MRI and NMR magnet makers, from fusion developers that wind high-field coils, from physics laboratories and from utilities testing compact power cables. Asia Pacific held the largest regional share, 45.0% in 2025, because China, Japan and South Korea host most niobium-titanium wire and coated tape production as well as the largest fusion build programs. Asia Pacific is also the fastest-growing region at 11.2% a year. The main commercial change is that fusion developers now buy coated tape in thousands of kilometers per order, which turns a laboratory product into a volume conductor with long-term supply contracts and capacity commitments from Japanese and Chinese producers.
Conductor makers sell wire and tape by length and current
The market counts the value of superconducting conductors sold to magnet, cable and device builders, covering niobium-titanium and niobium-tin wire, magnesium diboride wire, bismuth-based and rare-earth barium copper oxide tapes, bulk superconductors and the cable-in-conduit conductors and cable assemblies made from them. Buyers usually order conductor by length and current rating under multi-year framework agreements tied to a magnet design.
Complete MRI scanners, fusion devices, cryocoolers, cryostats and installation services are excluded, although they set conductor demand. Value sits with wire and tape makers that control alloy billets, deposition lines and quality testing, with suppliers of niobium, rare earths and helium, and with cable makers that turn tape into power links.
Superconducting Materials Market Insights
- The global superconducting materials market was valued at USD 2.78 billion in 2025 and is projected to reach USD 7.40 billion by 2035, growing at a 10.30% CAGR during 2026–2035.
- Asia Pacific held 45.0% of 2025 value, because China, Japan and South Korea host most wire and coated tape output.
- Low temperature superconductors held 84.0% of 2025 value on MRI demand, while nuclear fusion grows fastest at 19.7% a year among end uses.
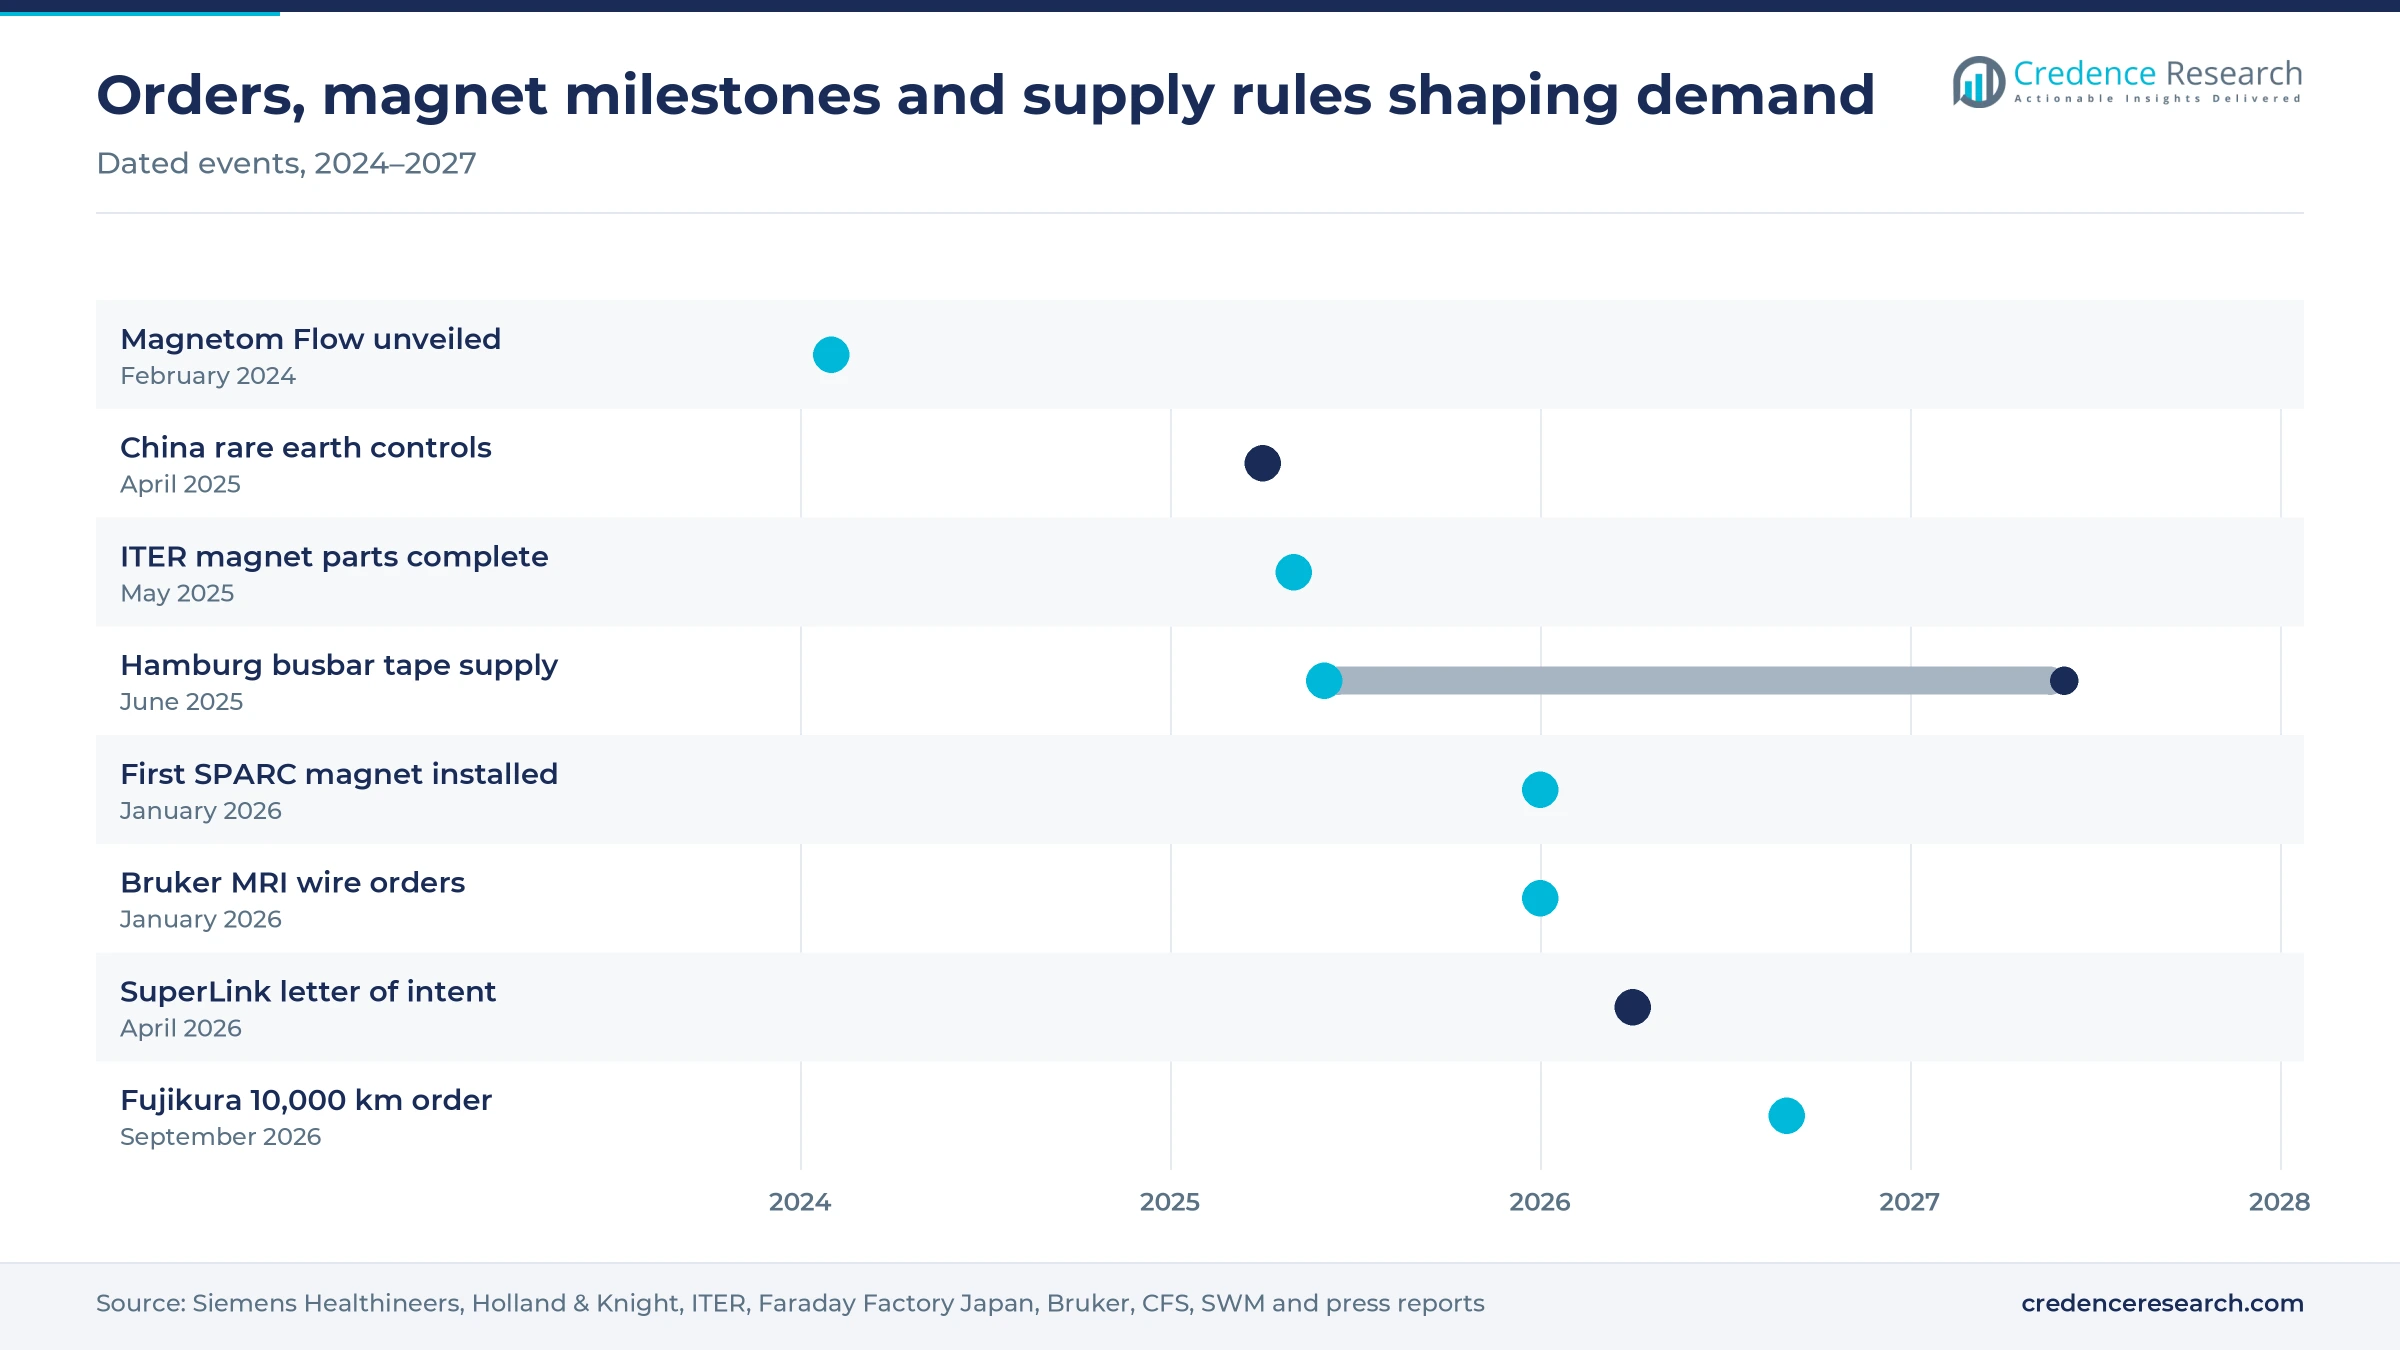
- Commonwealth Fusion Systems placed an order for more than 10,000 km of coated tape with Fujikura, reported in September 2026.
- Bruker announced multi-year MRI conductor supply agreements with two healthcare companies in January 2026, one running up to seven years.
Niobium-titanium leads while coated HTS tape gains fastest
Niobium-titanium MRI wire keeps LTS in the lead
Based on product, the market is categorized into low temperature superconductors (LTS) and high temperature superconductors (HTS). Low Temperature Superconductors (LTS) led with 84.0% of 2025 value because almost every clinical MRI magnet is wound with niobium-titanium wire, and Bruker announced multi-year MRI conductor supply agreements with two healthcare companies in January 2026, one running up to seven years. High Temperature Superconductors (HTS) grow fastest at 22.5% a year as compact fusion magnets need high fields, and Commonwealth Fusion Systems installed the first of 18 tape-wound toroidal field magnets in its SPARC tokamak on Jan. 6, 2026, according to TechCrunch.
Round wire leads as coated tape gains on fusion orders
Based on form, the market is categorized into round wire, coated tape, cable and conductor assemblies, and bulk and others. Round Wire led with 52.0% of 2025 value because MRI, NMR and accelerator magnets use composite niobium-titanium and niobium-tin wire, and ITER sourced more than 100,000 km of strand from nine factories in six countries, according to Nuclear Engineering International in May 2025. Coated Tape grows fastest at 21.2% a year as fusion developers place volume orders, and Faraday Factory Japan has delivered more than 5,000 km of tape to fusion companies, according to Commercial Fusion in June 2025.
Medical imaging leads while fusion magnets grow fastest
Based on end use, the market is categorized into medical, research and development, nuclear fusion, electronics, transportation, energy and power, and others. Medical led with 46.0% of 2025 value because MRI makers renew and expand scanner fleets, and Philips reported more than 2,000 installed BlueSeal 1.5T systems by December 2025, according to Applied Radiology. Nuclear Fusion grows fastest at 19.7% a year as pilot plants move to construction, and the U.K. STEP prototype is expected to use an estimated 30,000 km of tape, according to Tokamak Energy in June 2026.
| Segment Group | Leading Sub-segment | Share, 2025 | Fastest-growing Sub-segment | CAGR, 2026–2035 |
|---|---|---|---|---|
| By Product | Low Temperature Superconductors (LTS) | 84.0% | High Temperature Superconductors (HTS) | 22.5% |
| By Form | Round Wire | 52.0% | Coated Tape | 21.2% |
| By End Use | Medical | 46.0% | Nuclear Fusion | 19.7% |
Tape prices fall with scale while wire prices stay stable
Conductor is priced per meter or per kiloampere-meter at a stated field and temperature, so a buyer compares current-carrying capacity rather than length alone. Coated tape prices have fallen as Chinese and Japanese lines scale up, and a September 2025 review in the journal Superconductivity puts tape made by pulsed laser deposition at about USD 15 to USD 30 per meter, against an industry cost target of USD 50 per kA·m. Niobium-titanium wire prices are steadier, because alloy billets, copper stabilizer and drawing steps are mature. Helium sets part of the cost of running LTS magnets, and lower tape prices therefore favor fusion developers and cable makers while squeezing margins at smaller tape producers.
| Conductor or input | Typical price or fee | Basis |
|---|---|---|
| Coated REBCO tape, Chinese producer average selling price | About RMB 279 per meter (about USD 39) | Shanghai Superconductor prospectus data, 2025 |
| PLD-made REBCO tape, 12 mm | About USD 15 to USD 30 per meter | Superconductivity journal review, September 2025 |
| REBCO cost target for fusion magnets | USD 50 per kA·m near term, USD 10 to USD 20 long term | Superconductivity journal review, September 2025 |
| Niobium-titanium MRI wire | About USD 1 to USD 2 per kA·m | Credence Research estimate from published LTS conductor benchmarks |
| Grade-A helium for LTS magnet cooling | About USD 12 per cubic meter | U.S. Geological Survey, 2025 estimate |
Request a Free Sample
Fill in your details and we'll send you a free sample report.
- Sample data tables & charts
- Research methodology
MRI supply deals, fusion magnets and grid pilots lift demand
Multi-year MRI supply deals anchor LTS wire demand
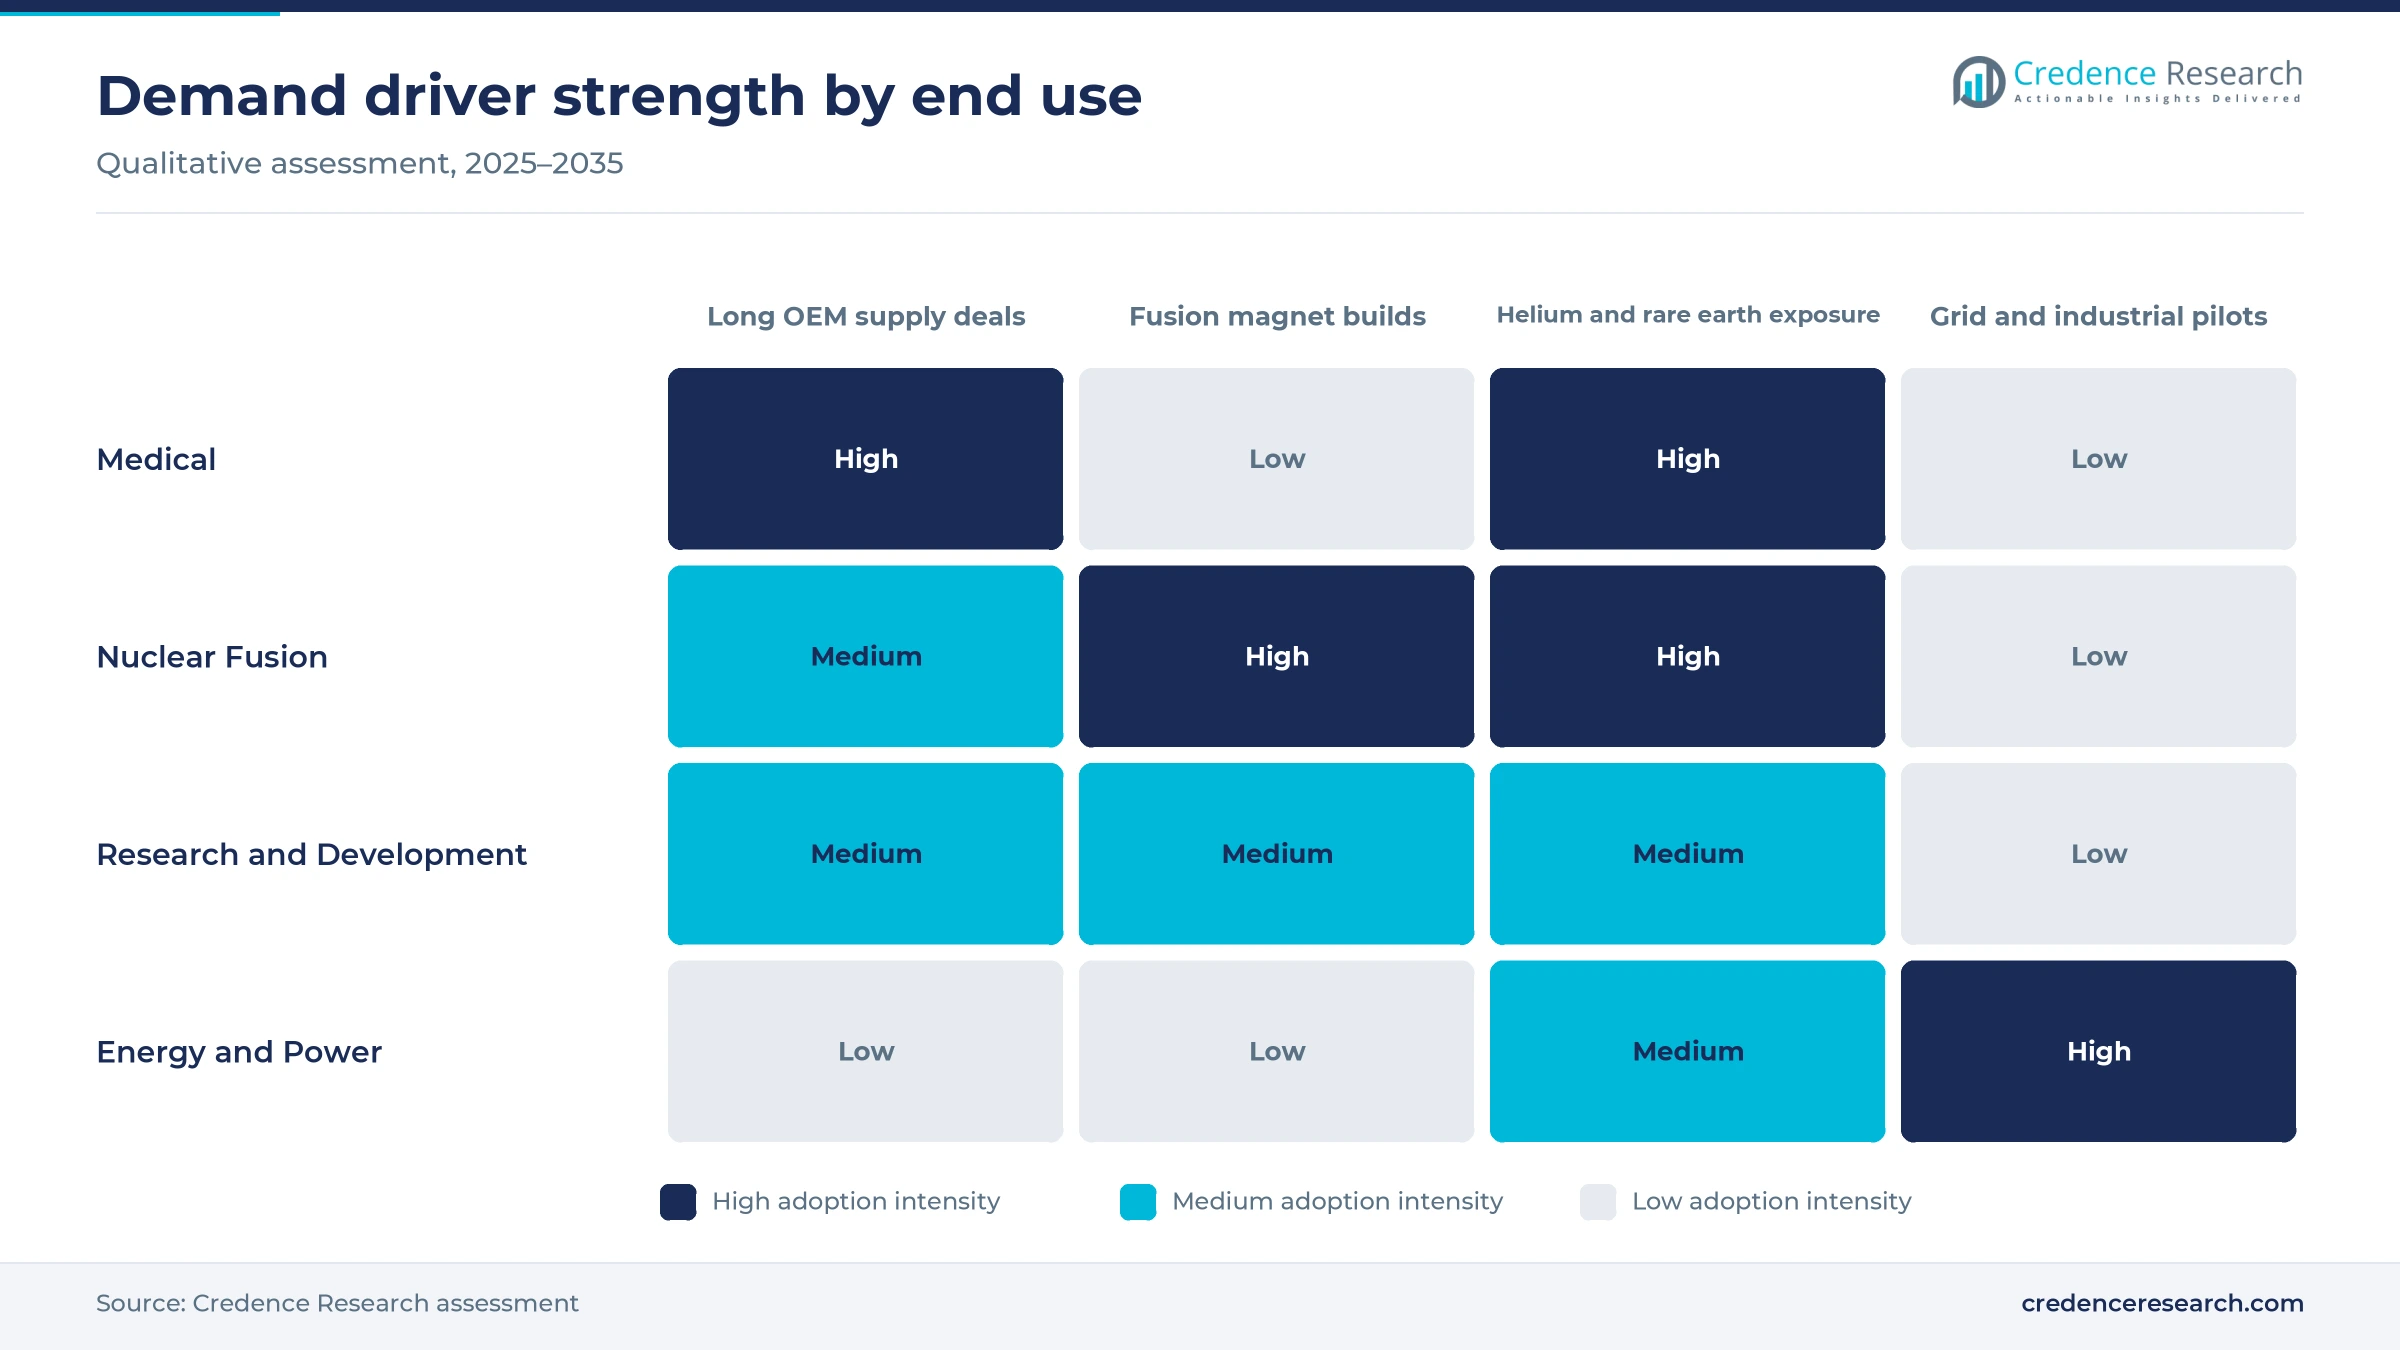
MRI magnet makers sustain the largest steady demand, because each new scanner needs kilometers of niobium-titanium wire and OEMs lock in supply for years. Bruker announced multi-year MRI superconductor supply agreements with two healthcare companies in January 2026, with one agreement running up to seven years and deliveries going to magnet plants in the United States and the United Kingdom. Beyond the BlueSeal installed base noted above, Philips unveiled a 3.0T helium-free magnet platform at RSNA 2025, which extends sealed designs to high-field scanners. These contracts give wire makers visibility on billet and drawing capacity, which favors suppliers with qualified MRI wire and long OEM relationships over new entrants that lack qualification history.
Fusion magnet builds turn tape into a volume conductor
Private and public fusion programs create the fastest new demand, because compact high-field magnets need coated tape in quantities that the industry did not produce five years ago. Commonwealth Fusion Systems placed an order for more than 10,000 km of tape with Fujikura, reported in September 2026, for ARC power plants starting in Virginia. In China, a 582-ton toroidal field magnet linked to the BEST tokamak in Hefei was completed in August 2026, according to Business Today. Faraday Factory Japan also signed a tape supply agreement with Proxima Fusion in June 2025, so tape makers with proven high-field performance win the first large contracts.
Accelerator and fusion research keep niobium-tin busy
Large physics and fusion research projects keep niobium-tin wire lines busy, because high-field magnets above the limits of niobium-titanium need it. ITER completed all components of its pulsed magnet system in May 2025, after Japan produced 43 km of niobium-tin strand for the central solenoid modules, according to Nuclear Engineering International, and its magnet systems total 10,000 tons. CERN's HL-LHC uses 24 large-aperture niobium-tin focusing quadrupoles around ATLAS and CMS, with all new magnet components due at CERN by the end of 2026, according to CERN Courier. These projects mainly support stable niobium-tin volumes rather than step changes in demand, because each campaign ends once the magnets are wound and tested.
Grid, busbar and data center pilots open power demand
Power users are testing superconducting links where space or losses make copper costly, which adds demand for tape in cables and busbars. Stadtwerke München and NKT signed a letter of intent for the SuperLink project on April 15, 2026, a planned link of up to 15 km at 110 kV carrying 500 MW. Faraday Factory Japan began supplying tape in June 2025 for a 600 m, 200,000 ampere busbar at a Hamburg aluminum smelter, due by 2027. LS Cable, LS Electric and KEPCO signed a memorandum in July 2025 to build a superconducting grid for data centers. Energy and power buyers therefore favor tape makers that can supply long, uniform lengths.
Helium-light magnets and Asian tape capacity reshape buying
MRI makers are shifting toward helium-light magnets
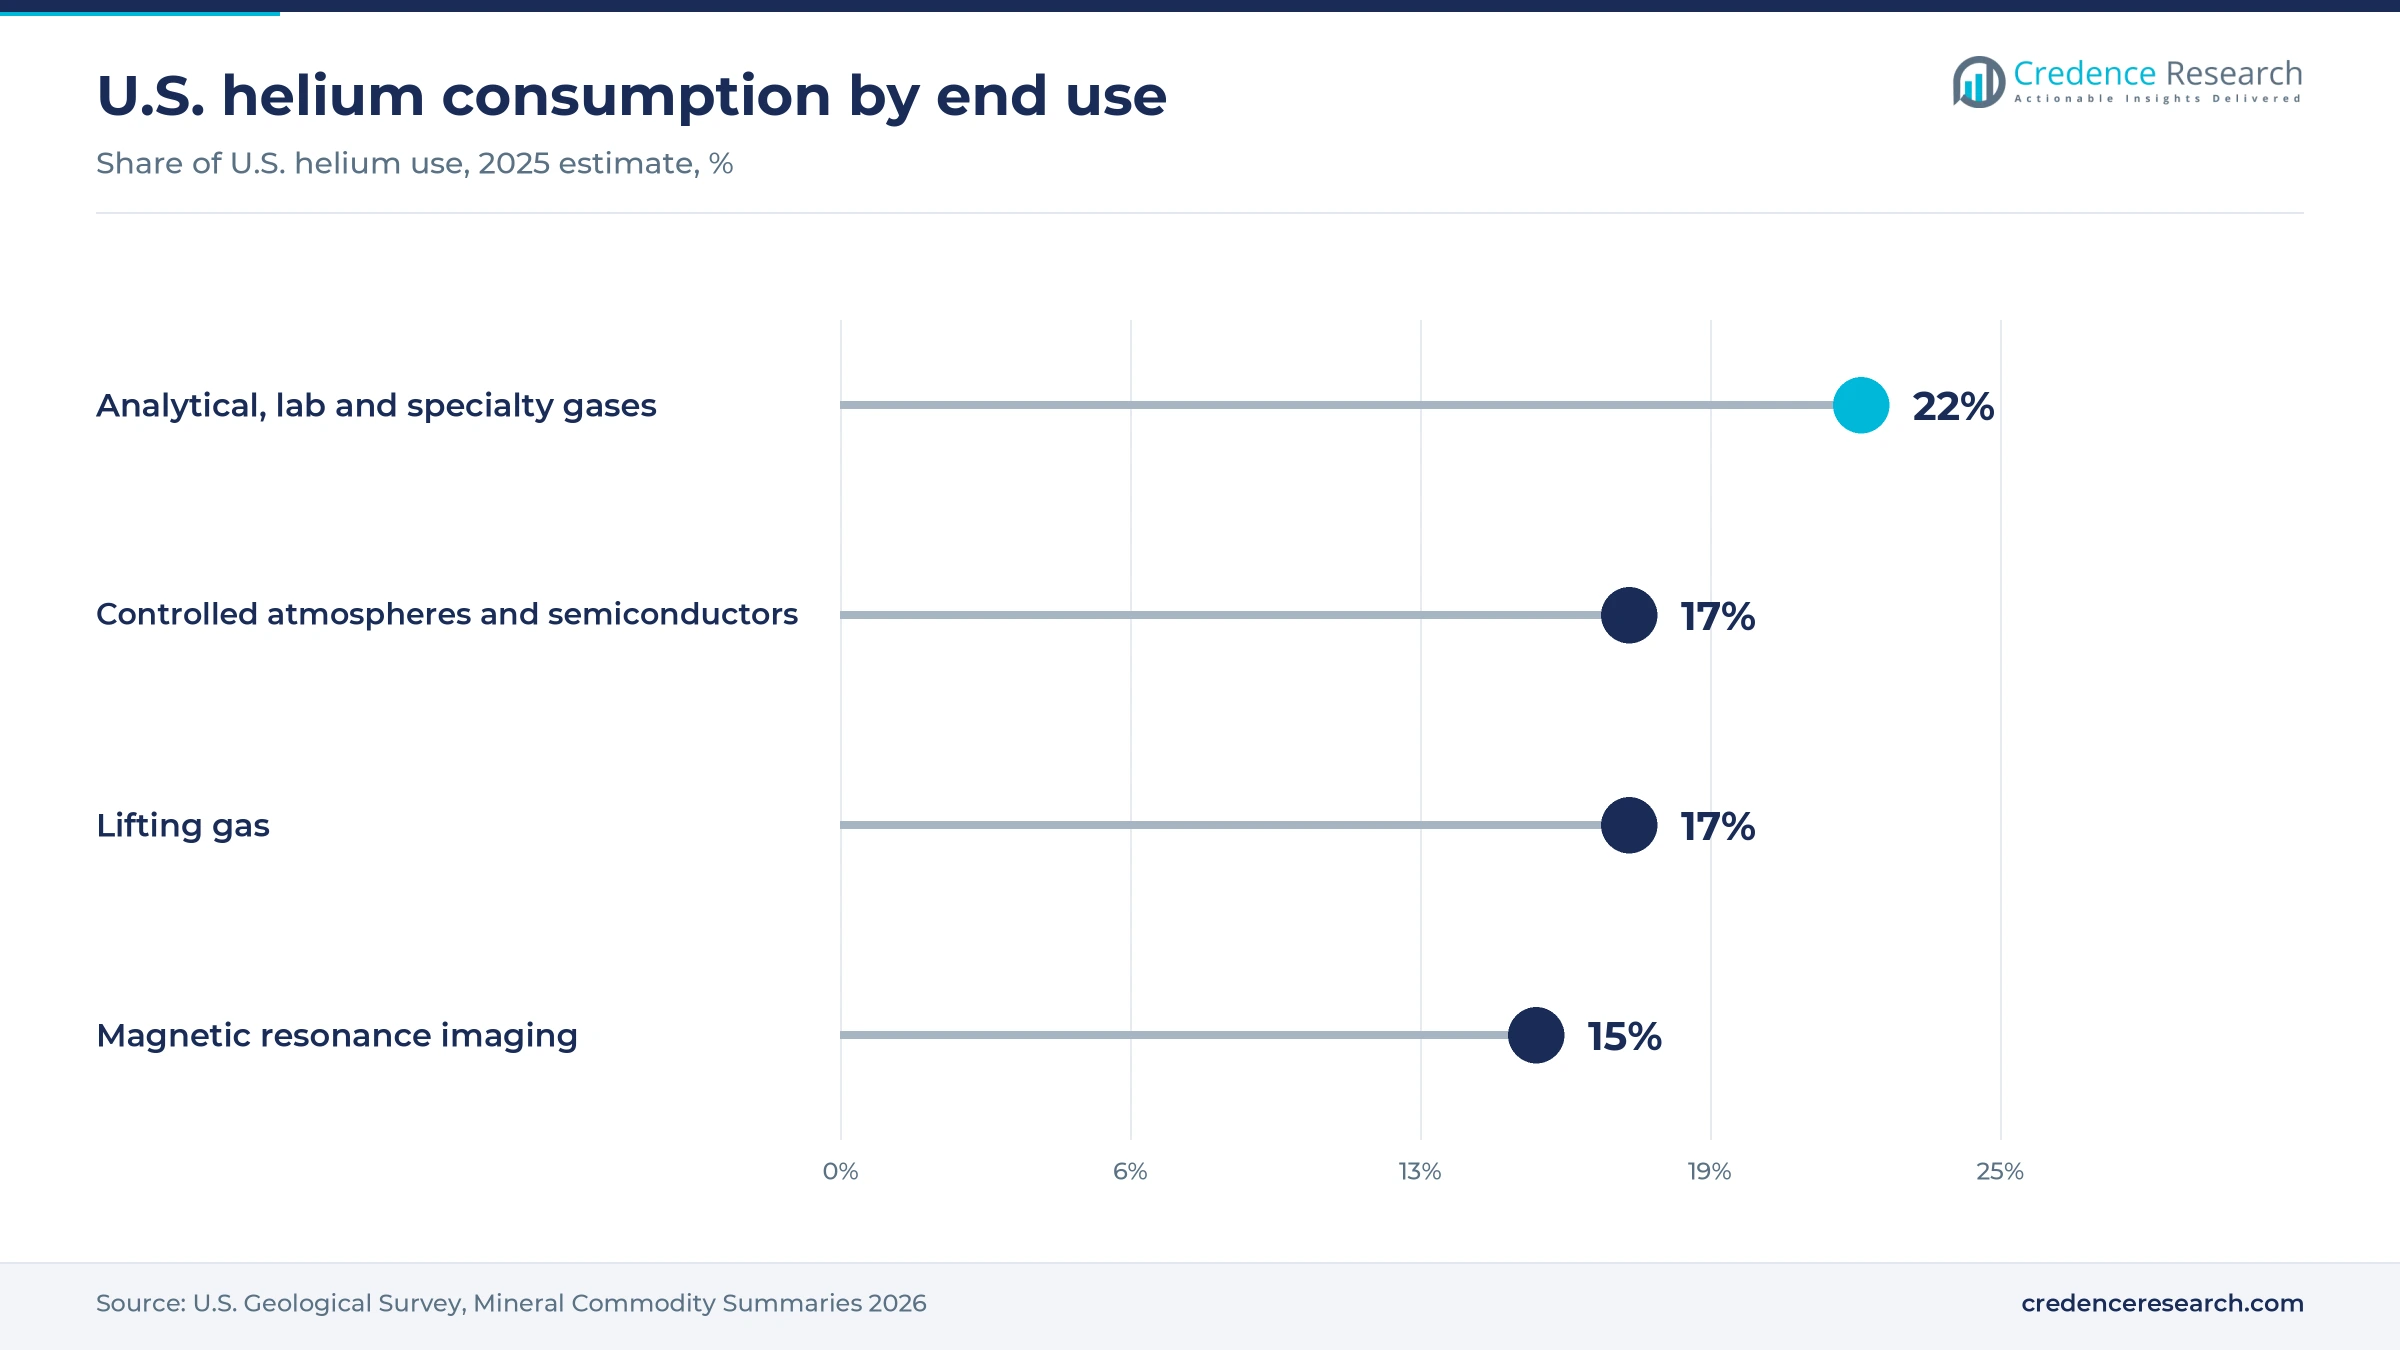
MRI makers are shifting toward sealed, low-helium magnets to address helium cost and supply risk, creating openings for conductor designs that tolerate dry cooling across hospital installations. Siemens Healthineers unveiled the Magnetom Flow 1.5T in February 2024 with 0.7 liters of helium in a closed circuit, compared with as much as 1,500 liters before, and a BlueSeal magnet needs a pre-load of seven liters, according to AuntMinnie in May 2024. MRI accounted for 15% of U.S. helium use in 2025, according to the U.S. Geological Survey. Low-helium magnets keep niobium-titanium in use but change wire specifications, which favors suppliers that co-develop conductor with magnet makers.
Asian tape makers are scaling capacity for fusion
Tape producers in Japan and China are shifting toward much larger deposition lines to address fusion order sizes, creating openings for lower-cost tape across magnets and cables. Shanghai Superconductor's STAR Market listing application was accepted on June 18, 2025, according to FilingReader, which gives the business a public capital route for new lines. The top-tier makers using pulsed laser deposition now produce above 3,000 km of 12 mm tape a year, according to the Superconductivity review cited above. Faraday Factory Japan opened a new high-throughput factory in Kanagawa in 2024 after a 10-fold production ramp since 2020, and Fujikura is expanding capacity in Japan for the CFS order. Furukawa Electric and Tokamak Energy agreed in June 2026 to study U.K. tape manufacturing, so buyers outside Asia are seeking a second supply base.
Compact fusion pilot plants open a long tape opening
Fusion pilot plants are an opening for tape makers that can sign decade-long supply agreements, because each plant needs far more conductor than a prototype. The U.K. STEP prototype is expected to use an estimated 30,000 km of tape, according to Tokamak Energy in June 2026. CFS expects its Virginia ARC plant to connect to the grid in the early 2030s, and deliveries under the Fujikura order could start within one to two years. Proxima Fusion, which raised a €130 million Series A, plans a demonstration magnet in 2027 with Faraday Factory Japan tape. Nuclear fusion is the fastest-growing end use in the Credence Research estimates, so tape makers with qualified high-field lines gain backlog that supports further capacity spending.
Quantum computing creates a niobium thin film opening
Superconducting quantum processors are an emerging opening for high-purity niobium and aluminum films, because qubits and couplers rely on superconducting circuits cooled in dilution refrigerators. IBM said in June 2025 that its fault-tolerant Starling system will be built in a new IBM Quantum Data Center in Poughkeepsie, New York, by 2029, and IBM expects it to perform 20,000 times more operations than current quantum computers. Larger processors also need superconducting coaxial lines and filters, which links this demand to quantum computers and cryogenic equipment purchases. Electronics demand for these films remains small and thinly documented, so film and target suppliers with semiconductor-grade purity gain new buyers outside the magnet trade.
Price, rare earth controls and project delays limit uptake
Rare earth export licensing adds tape input risk
China's Ministry of Commerce placed export controls on seven medium and heavy rare earths, including yttrium and gadolinium, on April 4, 2025, so exporters now need licenses. Coated tape uses these elements in its superconducting layer, which exposes tape makers in Japan, Europe and the United States that buy rare earth oxides from China. Delays in license approval raise inventory costs, and producers with qualified non-Chinese sources or stockpiles are better placed to keep delivery schedules for fusion customers.
Niobium and helium supply are concentrated
Brazil accounted for about 93% of world niobium mine output in 2025, according to the U.S. Geological Survey, so LTS wire makers depend on a small number of mines and converters for alloy feedstock. Helium adds a second concentration, as the U.S. and EU bans on Russian helium imports remained in effect in 2025. Wire makers without long-term niobium contracts and MRI operators using conventional magnets are most exposed, which supports demand for helium-light magnets and diversified helium supply contracts.
Project delays push back conductor demand
JR Central said in March 2024 that it could not set a new opening date for the Chuo Shinkansen maglev, because Shizuoka Prefecture had refused tunnel work, and tunneling is expected to take at least 10 years, according to Railway Gazette. Large projects of this kind order conductor in long campaigns, so a delay moves demand by years rather than months. Wire and tape makers that size capacity for one project are most exposed, while suppliers with MRI and fusion customers spread the risk.
Tape cost still limits use outside fusion
Coated tape sold at an average of about RMB 279 per meter at Shanghai Superconductor in 2025, which is far above the cost of copper for the same length, so utilities use it only where space or losses justify the premium. The SuperLink project remained at the letter of intent stage in April 2026, with a binding contract still under negotiation. Cable makers and utilities carry the risk of high first-project costs, and wider grid use depends on tape prices falling further as new lines reach full output.
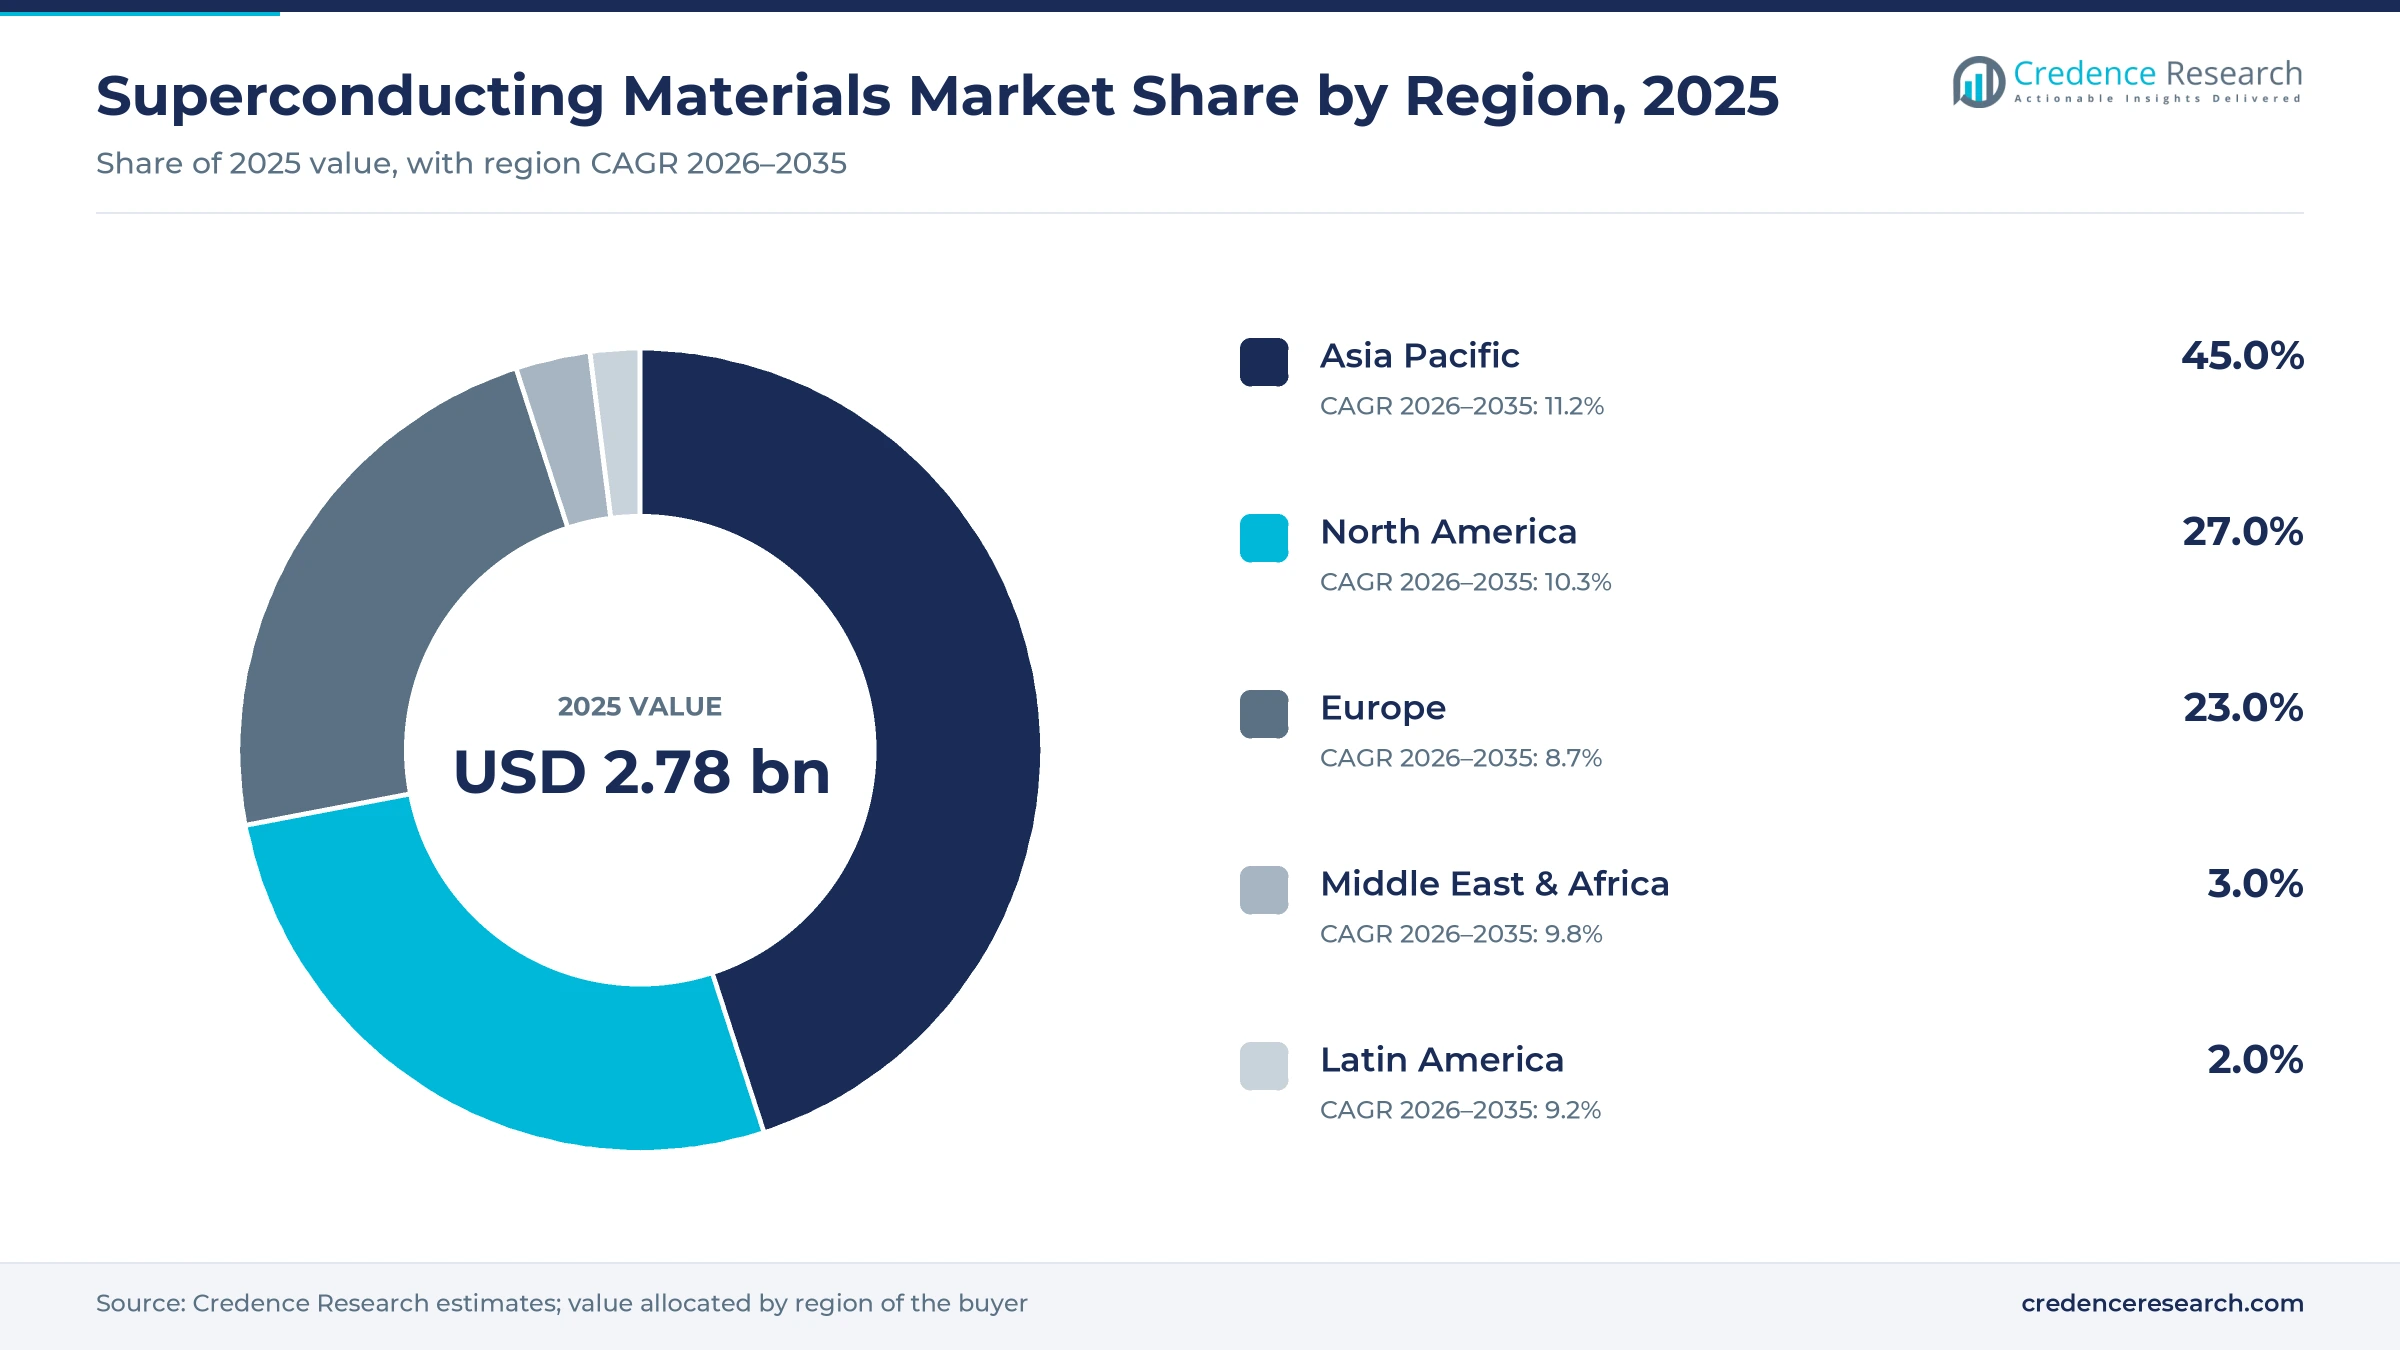
Asia Pacific leads on Chinese and Japanese conductor output
| Region | Value, 2025 (USD billion) | Share, 2025 | CAGR, 2026–2035 |
|---|---|---|---|
| Asia Pacific | 1.25 | 45.0% | 11.2% |
| North America | 0.75 | 27.0% | 10.3% |
| Europe | 0.64 | 23.0% | 8.7% |
| Middle East & Africa | 0.08 | 3.0% | 9.8% |
| Latin America | 0.06 | 2.0% | 9.2% |
Asia Pacific leads on Chinese and Japanese supply
Asia Pacific held the largest regional share, 45.0% of 2025 value, and grows fastest at 11.2% a year. China adds the largest volume, as Western Superconducting supplies niobium-titanium wire for MRI and fusion and Shanghai Superconductor scales coated tape, while Hefei builds the BEST tokamak for completion by the end of 2027. Japan hosts Fujikura, Faraday Factory Japan, Furukawa Electric, Sumitomo Electric and JASTEC, so the region also exports a large share of tape and wire to fusion developers elsewhere.
North America buys for fusion builds and MRI plants
North America held a 27.0% share of 2025 value, about USD 0.75 billion, and grows at 10.3% a year, with the United States accounting for most of the regional total in the Credence Research estimates. Demand comes from MRI magnet plants supplied under the Bruker agreements, from Commonwealth Fusion Systems in Massachusetts and from the U.S. ITER central solenoid work completed in 2025. Domestic tape output is limited to SuperPower, MetOx International and smaller makers, so U.S. buyers import much of their coated tape from Japan.
Europe grows on accelerators, fusion and grid pilots
Europe held a 23.0% share of 2025 value and grows at 8.7% a year, slower than other regions as ITER component production has ended. CERN's HL-LHC magnets, Proxima Fusion in Germany and the U.K. STEP program keep high-field conductor demand in the region. Nexans commissioned the HTS cables at Gare Montparnasse in Paris for SNCF, presented in September 2025, and the planned Munich SuperLink could become the longest superconducting high-voltage link.
Middle East & Africa buys conductor through MRI imports
Middle East & Africa held a 3.0% share of 2025 value and grows at 9.8% a year. Demand comes mainly through imported MRI scanners and research magnets for hospitals and universities in the Gulf, South Africa and Egypt, so conductor value arrives inside finished systems. The region has no verified wire or tape production, which is an evidence gap in the regional estimate rather than a sign of zero demand.
Latin America depends on niobium and imported magnets
Latin America held a 2.0% share of 2025 value and grows at 9.2% a year. Brazil supplies most of the world's niobium, yet the conductor made from it is drawn in Asia, Europe and North America and returns to the region inside imported MRI systems. Local demand is therefore set by hospital imaging budgets in Brazil and Mexico rather than by any regional wire production.
Tape orders, magnet installs and cable deals mark 2025–2026
| Development | Status and market relevance |
|---|---|
| In September 2026, Commonwealth Fusion Systems placed an order for more than 10,000 km of coated tape with Fujikura for ARC power plants. | Order placed; deliveries could begin within one to two years, value not disclosed |
| In April 2026, Stadtwerke München and NKT signed a letter of intent for the SuperLink 110 kV superconducting cable in Munich. | Letter of intent; a binding commercial contract is still under negotiation |
| In January 2026, Commonwealth Fusion Systems installed the first of 18 toroidal field magnets in its SPARC tokamak. | Installation milestone; operation of SPARC is targeted for 2027 |
| In January 2026, Bruker announced multi-year MRI conductor supply agreements with two healthcare companies, one running up to seven years. | Supply agreements signed; multi-year deliveries under way |
| In June 2025, Faraday Factory Japan began supplying coated tape for a 200,000 ampere busbar at a Hamburg aluminum smelter. | Supply started; installation of the 600 m system is planned by 2027 |
Conductor chemistry decides field, temperature and cost
- Niobium-titanium wire remains the workhorse for MRI and accelerator magnets, because it is ductile, easy to wind and proven at 4 K with helium or cryocooler cooling.
- Niobium-tin wire reaches higher fields than niobium-titanium, which suits NMR, fusion and accelerator magnets, although it is brittle after heat treatment.
- Coated REBCO tape carries high current in strong fields at 20 K and above, which allows compact fusion magnets and cables cooled with liquid nitrogen.
- Magnesium diboride and bismuth conductors serve niche magnets, current leads and cables, and they link with MRI systems that test lower-cost or helium-light designs.
Need a Custom Version of This Report?
Tailor the scope, geography, or segments to your exact requirements.
- Custom geography or segment scope
- Direct access to our analyst team
Long supply contracts and tape capacity split the field
Competition splits between LTS wire makers that win on qualification history and long OEM contracts, and coated tape makers that win on capacity, performance in high fields and price per kiloampere-meter. Bruker and Western Superconducting compete for MRI and fusion wire, while Luvata and JASTEC serve MRI, NMR and physics magnets. Fujikura, Faraday Factory Japan and Furukawa Electric through SuperPower compete for fusion tape, and Shanghai Superconductor leads coated tape supply in China. Sumitomo Electric supplies bismuth-based wire, Nexans builds superconducting cable systems, MetOx International makes Xeus HTS wire for power cables and plans a plant in North Carolina, and Hyper Tech Research makes magnesium diboride wire. Large fusion orders now favor makers that can commit thousands of kilometers a year.
Few qualified wire and tape lines hold most supply
The supply side is concentrated, because buyers qualify conductor for each magnet design and rarely switch once a wire or tape has passed testing. A handful of LTS wire makers, including Western Superconducting, Bruker, Luvata, JASTEC and Furukawa Electric, serve most MRI and physics magnets. Coated tape is more open, with about 15 manufacturers worldwide and combined capacity above 5,000 km of 12 mm tape a year, according to a 2025 review in the journal Superconductivity. Entry barriers include billet and deposition know-how, long qualification cycles and capital for new lines. Margins are likely highest on high-field fusion tape and niobium-tin wire, and thinnest on standard MRI wire.
Companies profiled and their roles in this market
| Company | Type | Role in the market |
|---|---|---|
| Bruker Corporation (Bruker Energy & Supercon Technologies) | Wire maker | NbTi and Nb3Sn wire for MRI, NMR, fusion and physics magnets |
| Western Superconducting Technologies Co., Ltd. | Wire maker | NbTi and Nb3Sn wire for MRI and fusion, including Chinese fusion devices |
| Furukawa Electric Co., Ltd. (SuperPower) | Wire and tape maker | LTS wire and SuperPower coated tape for fusion and magnets |
| Fujikura Ltd. | Tape maker | Coated REBCO tape, including the 10,000 km order for fusion plants |
| Faraday Factory Japan | Tape maker | Coated tape for fusion developers, busbars and power cables |
| Sumitomo Electric Industries, Ltd. | Wire maker | DI-BSCCO bismuth-based wire for cables, current leads and magnets |
| Luvata (Mitsubishi Materials) | Wire maker | NbTi and Nb3Sn wire and cables for MRI, NMR and science projects |
| Japan Superconductor Technology, Inc. (Kobe Steel) | Wire maker | NbTi and Nb3Sn wire for MRI, NMR and research magnets |
| Shanghai Superconductor Technology Co., Ltd. | Tape maker | Coated REBCO tape for Chinese fusion, cable and research buyers |
| Nexans | Cable system maker | Superconducting power cables for rail, utility and industrial links |
| MetOx International, Inc. | Tape maker | Houston-based maker of Xeus HTS wire for power cables, North Carolina plant planned |
| Hyper Tech Research, Inc. | Wire maker | MgB₂ and Nb₃Sn wire made in Columbus, Ohio, for magnets, motors and conduction-cooled MRI |
Tape capacity now matters more than lab records
Credence Research's view is that tape capacity now matters more than laboratory performance records for coated tape makers. Fusion developers have shown that compact high-field magnets work, and their orders now run to thousands of kilometers, so the makers that can deliver uniform tape on schedule will set prices and win backlog. Coated tape grows at 21.2% a year in these estimates, the fastest rate of any conductor form. LTS wire stays the largest product at 84.0% of 2025 value because MRI demand is broad and stable. The main risks sit in inputs, from rare earth licensing to niobium and helium concentration, rather than in end demand.
Company disclosures and project counts anchor the model
The report uses 2025 as the base year and 2026–2035 as the forecast period, and it replaces an earlier edition built on a 2023 base year with a forecast to 2032. Market values come from the Credence Research model, built from company disclosures of conductor orders and capacity, published project conductor quantities, price data and official statistics. Product, form, end use and regional splits are Credence Research estimates. Sources include the U.S. Geological Survey, ITER and CERN publications, utility and company releases, and trade press. Public data on electronics and bulk conductor sales are thin, so those segments rest mainly on estimates. No interviews or surveys were conducted for this edition of the report.
Fusion builds and MRI renewal carry demand to 2035
Through 2035, growth comes from coated tape for fusion pilot plants and power links, while MRI wire provides a broad, steady base. Asia Pacific remains the largest region, since Japanese and Chinese makers hold most tape and wire capacity, although U.S. and U.K. programs are seeking local supply. Tape prices should keep falling as new lines reach full output, which would widen use in cables and busbars. Fusion conductor demand grows fastest of all end uses through 2035 in the Credence Research estimates. The main uncertainty is whether fusion plants such as ARC and STEP keep their schedules, because their orders decide how much new tape capacity gets built.
Fusion tape uptake and MRI volumes set the range
The range depends mostly on how fast fusion developers move from prototypes to pilot plants and on whether MRI makers keep expanding output. Slower fusion financing or rare earth license delays would leave tape lines underused. Faster construction of ARC, STEP and Chinese fusion devices, together with grid cable contracts, would lift tape demand well above the base case. The base case assumes steady MRI wire demand and gradual fusion construction.
| Scenario | CAGR, 2026–2035 | Value, 2035 | What has to hold |
|---|---|---|---|
| Downside | 8.3% | USD 6.28 billion | Fusion projects slip and rare earth licensing delays slow coated tape deliveries |
| Base | 10.30% | USD 7.40 billion | MRI wire demand grows steadily and fusion pilot plants proceed on announced schedules |
| Upside | 12.3% | USD 8.70 billion | Fusion pilot plants and grid cable projects place several large tape orders |
Frequently Asked Questions
How big is the superconducting materials market?
How large is the U.S. superconducting materials market?
How is the superconducting tape segment developing?
What is a superconducting composite wire?
Which product type leads the superconductors market?
How fast are high temperature superconducting conductors growing?
Are superconducting magnets included in this market?
Who are the leading suppliers of superconducting wire and tape?
Table of Content
Chapter 1 Market Segmentation
- 1.1 Segmentation Framework
- 1.1.1 Product and Service Classification
- 1.1.2 Application and End-Use Classification
- 1.1.3 Technology and Solution Classification
- 1.1.4 Customer and Distribution Channel Classification
- 1.1.5 Geographic Segmentation
- 1.1.6 Market Segment Definitions and Boundaries
- 1.2 By Product
- 1.2.1 Low Temperature Superconductors (LTS)
- 1.2.2 High Temperature Superconductors (HTS)
- 1.3 By Form
- 1.3.1 Round Wire
- 1.3.2 Coated Tape
- 1.3.3 Cable and Conductor Assemblies
- 1.3.4 Bulk and Others
- 1.4 By End Use
- 1.4.1 Medical
- 1.4.2 Research and Development
- 1.4.3 Nuclear Fusion
- 1.4.4 Electronics
- 1.4.5 Transportation
- 1.4.6 Energy and Power
- 1.4.7 Others
Chapter 2 Introduction
- 2.1 Report Objectives and Scope
- 2.2 Product Definition and Industry Terminology
- 2.3 Market Inclusions and Exclusions
- 2.4 Research Process
- 2.4.1 Primary Research and Expert Interviews
- 2.4.2 Secondary Research and Source Review
- 2.4.3 Top-Down and Bottom-Up Estimation
- 2.4.4 Data Triangulation and Verification
- 2.5 Market Size Measurement Basis
- 2.5.1 2025: USD 2.78 billion → 2035: USD 7.40 billion
- 2.6 Historical and Forecast Reference Periods
- 2.6.1 Historical Period: 2018-2025
- 2.6.2 Base Year: 2025
- 2.6.3 Forecast Period: 2025-2035
- 2.7 Research Assumptions and Limitations
Chapter 3 Executive Summary
- 3.1 Market Snapshot and Key Findings
- 3.2 Base-Year Market Size, 2025
- 3.3 Forecast Market Size, 2035
- 3.4 Revenue and Volume Growth Outlook
- 3.5 Key Demand and Supply Indicators
- 3.6 Leading Market Segments
- 3.7 Fastest-Growing Market Opportunities
- 3.8 Regional Performance Highlights
- 3.9 Technology and Industry Transformation
- 3.10 Competitive Landscape Summary
- 3.11 Analyst View and Strategic Implications
Chapter 4 Global Superconducting Materials Market Trends and Developments
- 4.1 Historical Industry Development, 2018-2025
- 4.2 Recent Market Trends and Developments
- 4.3 Demand and Customer Behavior Trends
- 4.4 Technology and Product Innovation
- 4.5 Artificial Intelligence, Automation and Digitalization
- 4.6 Local Manufacturing and Supply Chain Realignment
- 4.7 Industry Partnerships, Mergers and Acquisitions
- 4.8 Sustainability and Circular Economy Developments
- 4.9 Government and Private Sector Investment Trends
- 4.10 Emerging Business Models and Commercialization
- 4.11 Industry Developments and Announcements
Chapter 5 Global Superconducting Materials Market Production, Supply and Demand Analysis
- 5.1 Demand Trend and Consumption Analysis, 2018-2025
- 5.2 Demand Forecast, 2025-2035
- 5.3 Production and Output Trend, 2018-2025
- 5.4 Production and Output Forecast, 2025-2035
- 5.5 Installed Capacity and Capacity Utilization
- 5.6 Company-Wise Production Plants and Statistics
- 5.6.1 Installed Production Capacity
- 5.6.2 Actual Production
- 5.6.3 Planned Capacity and Expansion Targets
- 5.7 Supply Chain Structure and Procurement Trends
- 5.8 Supply-Demand Gap and Bottlenecks
- 5.9 Import Dependence and Sourcing Structure
- 5.10 Contract Manufacturing and Outsourcing
- 5.11 Regional Supply and Demand Concentration
Chapter 6 Global Superconducting Materials Market Pricing Analysis
- 6.1 Pricing Structure and Measurement
- 6.2 Historical Pricing Trends, 2018-2025
- 6.3 Pricing Outlook, 2025-2035
- 6.4 Average Selling Price and Unit Economics
- 6.5 Pricing by Product and Market Segment
- 6.6 Geographic Pricing Differences
- 6.7 Key Input, Energy, Labor and Logistics Costs
- 6.8 Contract Pricing and Purchasing Models
- 6.9 Pricing Sensitivity and Competitive Positioning
- 6.10 Price, Margin and Profitability Implications
Chapter 7 Global Superconducting Materials Market Dynamics
- 7.1 Market Growth Drivers
- 7.1.1 Demand-Side Drivers
- 7.1.2 Technology and Innovation Drivers
- 7.1.3 Infrastructure and Investment Drivers
- 7.1.4 Regulatory and Policy Drivers
- 7.2 Market Restraints
- 7.2.1 Cost and Affordability Constraints
- 7.2.2 Technology and Adoption Barriers
- 7.2.3 Supply Chain and Operational Constraints
- 7.3 Market Challenges
- 7.3.1 Competitive Pressure and Margin Erosion
- 7.3.2 Skills, Infrastructure and Implementation Gaps
- 7.4 Emerging Market Opportunities
- 7.5 Market Dynamics Impact and Time-Horizon Assessment
Chapter 8 Global Superconducting Materials Value Chain Analysis
- 8.1 Industry Value Chain Overview
- 8.2 Upstream Suppliers and Critical Inputs
- 8.3 Technology and Component Providers
- 8.4 Manufacturing or Service Delivery
- 8.5 Distribution, Channel Partners and Integrators
- 8.6 Downstream Applications and End Users
- 8.7 Value Addition and Profit Pools
- 8.8 Vertical Integration and Outsourcing
- 8.9 Supplier Concentration and Risk
- 8.10 Supply Chain Localization and Resilience
Chapter 9 Global Superconducting Materials Market Regulations and Policies
- 9.1 Relevant Laws, Standards and Compliance Frameworks
- 9.2 Product, Service, Safety and Quality Requirements
- 9.3 Government Policies, Incentives and Subsidies
- 9.4 Imports, Exports and Trade Barriers
- 9.5 Public Procurement and Local Content Requirements
- 9.6 Environmental and Sustainability Compliance
- 9.7 Upcoming Policy Changes and Market Implications
Chapter 10 Global Superconducting Materials Market Hotspots and Opportunities
- 10.1 Market Opportunity Mapping and Growth Hotspots
- 10.2 High-Growth Applications and Customer Groups
- 10.3 Underserved Markets and White-Space Opportunities
- 10.4 Emerging Technology and Product Opportunities
- 10.5 New Capacity and Investment Hotspots
- 10.6 Market Entry and Expansion Opportunities
- 10.7 Distribution and Partnership Opportunities
- 10.8 Near-Term and Long-Term Commercial Potential
- 10.9 Opportunity Attractiveness and Execution Risks
Chapter 11 Global Superconducting Materials Market Outlook, 2025-2035
- 11.1 Market Size and Analysis
- 11.1.1 Revenue (Market Measurement: 2025: USD 2.78 billion → 2035: USD 7.40 billion)
- 11.1.2 Market Volume and Quantity Sold
- 11.1.3 Historical Market Size, 2018-2025
- 11.1.4 Base-Year Market Size, 2025
- 11.2 Market Forecast, 2025-2035
- 11.2.1 Revenue Forecast to 2035
- 11.2.2 Volume Forecast to 2035
- 11.2.3 CAGR and Year-on-Year Growth
- 11.2.4 Incremental Revenue Opportunity
- 11.3 Forecast Assumptions and Scenario Analysis
- 11.3.1 Base-Case Forecast
- 11.3.2 Optimistic and Conservative Scenarios
- 11.3.3 Technology, Pricing and Policy Sensitivities
- 11.4 Market Attractiveness and Growth Outlook
Chapter 12 Global Superconducting Materials Market Segmentation and Outlook
- 12.1 Segmentation Summary and Market Shares, 2025
- 12.2 Largest and Fastest-Growing Segments
- 12.3 By Product - Market Size and Forecast, 2025-2035
- 12.3.1 Segment Definition and Scope
- 12.3.2 Historical Market Size, 2018-2025
- 12.3.3 Revenue Forecast, 2025-2035
- 12.3.4 Volume Forecast, 2025-2035
- 12.3.5 Base-Year Market Share, 2025
- 12.3.6 Segment CAGR and Growth Drivers
- 12.3.7 Subsegment Market Size and Forecast
- 12.3.7.1 Low Temperature Superconductors (LTS)
- 12.3.7.2 High Temperature Superconductors (HTS)
- 12.3.8 Subsegment Pricing and Adoption Trends
- 12.3.9 Leading Suppliers and Competition
- 12.3.10 Regional Demand and Opportunities
- 12.4 By Form - Market Size and Forecast, 2025-2035
- 12.4.1 Segment Definition and Scope
- 12.4.2 Historical Market Size, 2018-2025
- 12.4.3 Revenue Forecast, 2025-2035
- 12.4.4 Volume Forecast, 2025-2035
- 12.4.5 Base-Year Market Share, 2025
- 12.4.6 Segment CAGR and Growth Drivers
- 12.4.7 Subsegment Market Size and Forecast
- 12.4.7.1 Round Wire
- 12.4.7.2 Coated Tape
- 12.4.7.3 Cable and Conductor Assemblies
- 12.4.7.4 Bulk and Others
- 12.4.8 Subsegment Pricing and Adoption Trends
- 12.4.9 Leading Suppliers and Competition
- 12.4.10 Regional Demand and Opportunities
- 12.5 By End Use - Market Size and Forecast, 2025-2035
- 12.5.1 Segment Definition and Scope
- 12.5.2 Historical Market Size, 2018-2025
- 12.5.3 Revenue Forecast, 2025-2035
- 12.5.4 Volume Forecast, 2025-2035
- 12.5.5 Base-Year Market Share, 2025
- 12.5.6 Segment CAGR and Growth Drivers
- 12.5.7 Subsegment Market Size and Forecast
- 12.5.7.1 Medical
- 12.5.7.2 Research and Development
- 12.5.7.3 Nuclear Fusion
- 12.5.7.4 Electronics
- 12.5.7.5 Transportation
- 12.5.7.6 Energy and Power
- 12.5.7.7 Others
- 12.5.8 Subsegment Pricing and Adoption Trends
- 12.5.9 Leading Suppliers and Competition
- 12.5.10 Regional Demand and Opportunities
- 12.6 Segment Growth Comparison
- 12.7 Segment Attractiveness and Priority Matrix
Chapter 13 Global Superconducting Materials End-Use and Application Market Outlook
- 13.1 End-Use Industry and Customer Demand Structure
- 13.2 Leading Applications and Customer Groups
- 13.3 End-Use Market Size, Share and Forecast
- 13.4 Major End-Use Industry Deep Dives
- 13.4.1 Customer Requirements and Use Cases
- 13.4.2 Demand and Replacement Cycles
- 13.4.3 Technical and Regulatory Considerations
- 13.4.4 Purchasing and Procurement Models
- 13.4.5 Leading Vendors and Distribution Channels
- 13.4.6 Forecast and Commercial Opportunities
- 13.5 Emerging Applications and Cross-Segment Demand
- 13.6 End-Use Industry Investment Priorities
Chapter 14 Global Superconducting Materials Geographic Market Outlook, 2025-2035
- 14.1 Regional Market Size and Share, 2025
- 14.2 Regional Market Forecast, 2025-2035
- 14.3 Regional Pricing, Production and Demand Differences
- 14.4 North America
- 14.4.1 United States
- 14.4.2 Canada
- 14.4.3 Mexico
- 14.5 Europe
- 14.5.1 Germany
- 14.5.2 France
- 14.5.3 Italy
- 14.5.4 United Kingdom
- 14.5.5 Spain
- 14.5.6 Poland
- 14.5.7 Russia
- 14.5.8 Netherlands
- 14.5.9 Belgium
- 14.5.10 Sweden
- 14.5.11 Denmark
- 14.5.12 Norway
- 14.5.13 Rest of Europe
- 14.6 Asia Pacific
- 14.6.1 China
- 14.6.2 India
- 14.6.3 Japan
- 14.6.4 South Korea
- 14.6.5 Thailand
- 14.6.6 Indonesia
- 14.6.7 Vietnam
- 14.6.8 Malaysia
- 14.6.9 Australia
- 14.6.10 Rest of Asia Pacific
- 14.7 Latin America
- 14.7.1 Brazil
- 14.7.2 Argentina
- 14.7.3 Colombia
- 14.7.4 Chile
- 14.7.5 Rest of Latin America
- 14.8 Middle East
- 14.8.1 Saudi Arabia
- 14.8.2 United Arab Emirates
- 14.8.3 Turkey
- 14.8.4 Israel
- 14.8.5 Iran
- 14.8.6 Rest of the Middle East
- 14.9 Africa
- 14.9.1 South Africa
- 14.9.2 Egypt
- 14.9.3 Nigeria
- 14.9.4 Morocco
- 14.9.5 Rest of Africa
- 14.10 Regional Investment, Policy and Supply Chain Differences
- 14.11 Regional Competitive Landscape
- 14.12 Geographic Growth Hotspots
Chapter 15 Global Superconducting Materials Technology, Innovation and Sustainability Outlook
- 15.1 Technology Landscape and Maturity
- 15.2 Product, Process and Service Innovation
- 15.3 AI, Automation and Digital Tools in the Industry
- 15.4 Technology Adoption and Performance Benchmarking
- 15.5 Innovation Pipeline and R&D Investment
- 15.6 Patent and Intellectual Property Trends
- 15.7 Energy Efficiency and Resource Management
- 15.8 Sustainability, Recycling and Circularity
- 15.9 Technology Roadmap, 2025-2035
- 15.10 Risks of Obsolescence and Technology Substitution
Chapter 16 Global Superconducting Materials Market Key Strategic Imperatives
- 16.1 Growth and Market Entry Priorities
- 16.2 High-Return Products and Segments
- 16.3 Pricing, Profitability and Cost Optimization
- 16.4 Technology Investment and Product Differentiation
- 16.5 Supply Chain Localization and Resilience
- 16.6 Distribution and Customer Acquisition
- 16.7 Partnership, Acquisition and Capacity Strategy
- 16.8 Regional Expansion Priorities
- 16.9 Short-, Medium- and Long-Term Actions
Chapter 17 Competition Outlook
- 17.1 Industry Competition Characteristics
- 17.2 Market Structure and Concentration
- 17.3 Market Share and Competitive Positioning, 2025
- 17.4 Company-Wise Revenue and Product Benchmarking
- 17.5 Production and Service Capacity Benchmarking
- 17.6 Technology, Pricing and Differentiation
- 17.7 Regional Footprint and Distribution Strength
- 17.8 Mergers, Acquisitions and Strategic Alliances
- 17.9 New Entrants and Competitive Threats
- 17.10 Porter's Five Forces and Industry Attractiveness
- 17.11 Competitive Outlook, 2025-2035
Chapter 18 Company Profiles
- 18.1 Company Coverage and Selection Criteria
- 18.2 Bruker Corporation (Bruker Energy & Supercon Technologies)
- 18.2.1 Business Description
- 18.2.2 Company Ownership and Geographic Presence
- 18.2.3 Product and Service Portfolio
- 18.2.4 Manufacturing and Operating Footprint
- 18.2.5 Production Capacity and Expansion Plans
- 18.2.6 Financial Performance and Investment
- 18.2.7 Market Share and Competitive Position
- 18.2.8 Technology and Innovation Capabilities
- 18.2.9 Strategic Alliances or Partnerships
- 18.2.10 Recent Developments
- 18.2.11 Growth Strategy and Outlook
- 18.3 Western Superconducting Technologies Co., Ltd.
- 18.4 Furukawa Electric Co., Ltd. (SuperPower)
- 18.5 Fujikura Ltd.
- 18.6 Faraday Factory Japan
- 18.7 Sumitomo Electric Industries, Ltd.
- 18.8 Luvata (Mitsubishi Materials)
- 18.9 Japan Superconductor Technology, Inc. (Kobe Steel)
- 18.10 Shanghai Superconductor Technology Co., Ltd.
- 18.11 Nexans
- 18.12 MetOx International, Inc.
- 18.13 Hyper Tech Research, Inc.
- 18.14 Other Relevant Market Participants
Note: Every listed company is profiled on the structure shown under the first company. The company list is preliminary and may change based on research findings, market developments, data availability and client requirements.
Chapter 19 Disclaimer
- 19.1 Research and Forecast Disclaimer
- 19.2 Data Source and Estimation Limitations
Note: The depth of individual sections depends on data availability for this market. Volume, capacity, trade and other unit-based metrics are included where applicable.

