
Market Overview:
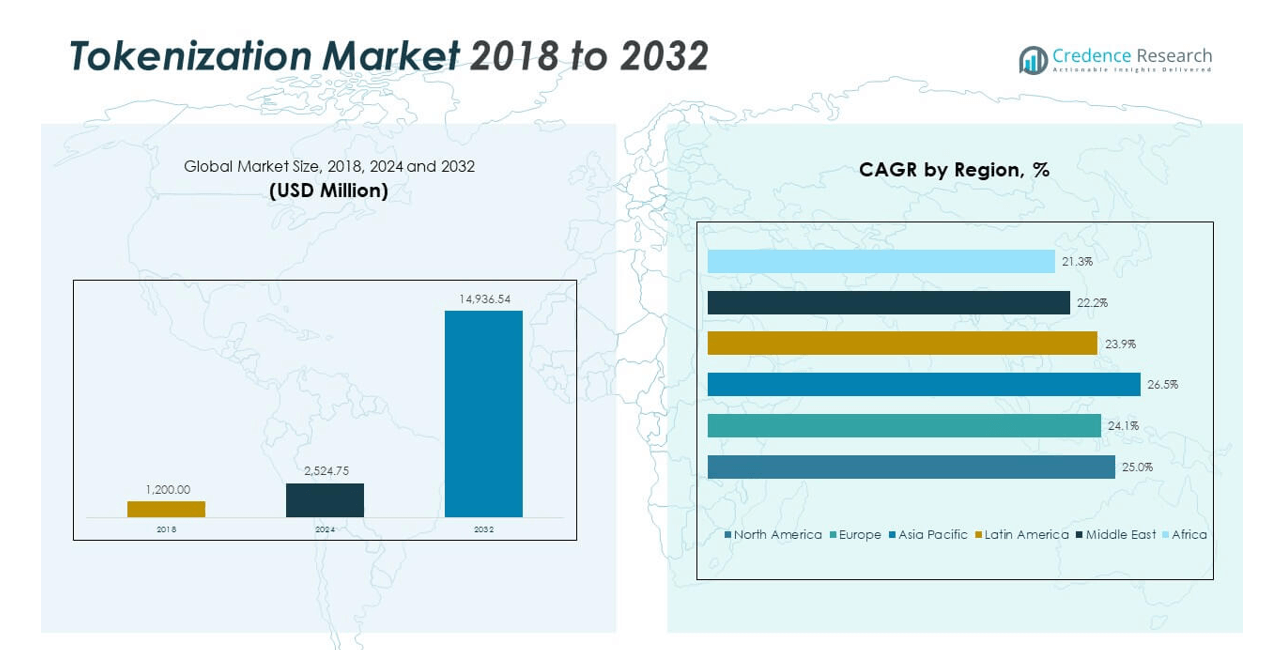
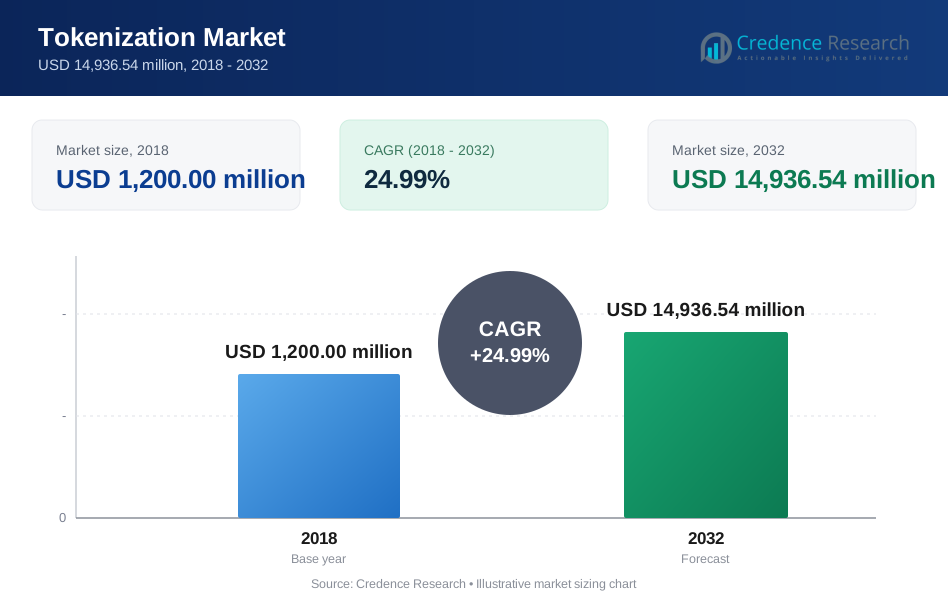
The Global Tokenization Market size was valued at USD 1,200.00 million in 2018, rising to USD 2,524.75 million in 2024, and is anticipated to reach USD 14,936.54 million by 2032, at a CAGR of 24.99% during the forecast period. Tokenization adoption grows as firms seek stronger data protection and secure transaction processing.
| REPORT ATTRIBUTE | DETAILS |
|---|---|
| Historical Period | 2020-2023 |
| Base Year | 2024 |
| Forecast Period | 2025-2032 |
| Tokenization Market Size 2024 | USD 2,524.75 million |
| Tokenization Market, CAGR | 24.99% |
| Tokenization Market Size 2032 | USD 14,936.54 million |
Rising cyber risks drive companies to use tokenization for safer data handling. Many industries shift to cloud systems that require strong security layers. Growing digital payments also push demand for real-time token services. Vendors release flexible platforms that support wider integration with enterprise systems. Firms value solutions that reduce exposure of sensitive customer data. Many banks use token-based systems to secure payment flows. This trend supports steady expansion across major industries.
North America leads due to strong digital payment use and strict security rules. Europe follows because many firms adopt advanced compliance-driven systems. Asia Pacific grows fast as banks and retailers expand digital operations. Countries like India and China push token adoption through rising online transactions. Latin America and the Middle East emerge as new adopters, driven by growing fintech activity. These regions gain traction as enterprises modernize security practices.
Market Insights:
- The Global Tokenization Market grew from USD 1,200.00 million in 2018 to USD 2,524.75 million in 2024 and is projected to reach USD 14,936.54 million by 2032, reflecting a strong CAGR of 24.99% driven by rising digital transactions and expanding compliance requirements.
- North America (37.96%), Europe (25.78%), and Asia Pacific (25.18%) held the largest shares due to strict regulations, advanced payment ecosystems, and strong enterprise adoption of cloud security frameworks.
- Asia Pacific, the fastest-growing region, holds 18% share and expands rapidly due to booming fintech activity, high mobile payment penetration, and strong government support for secure digital infrastructure.
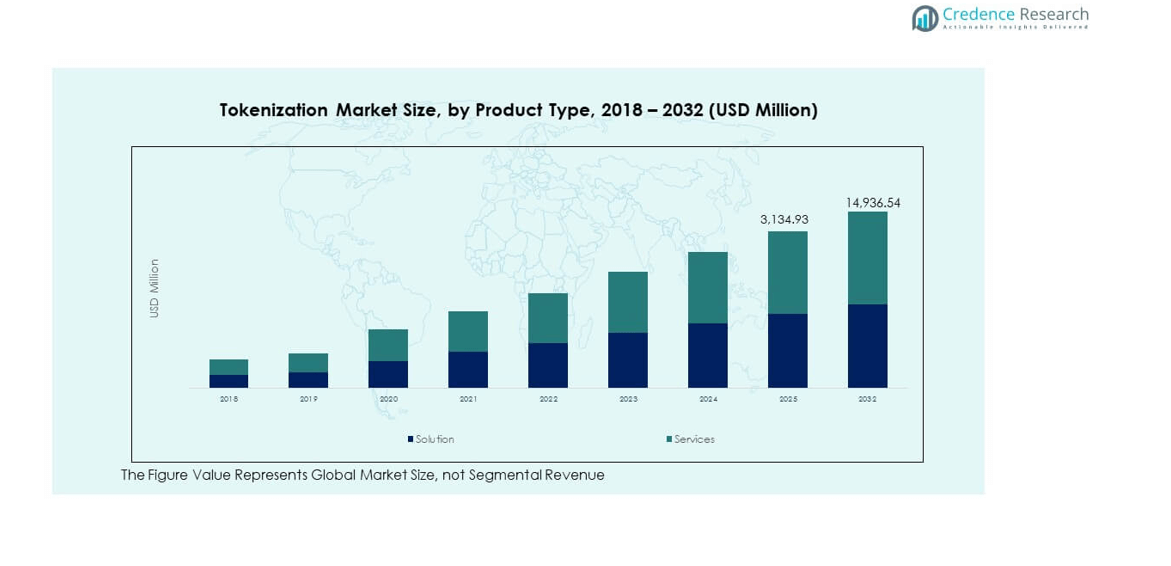
- Based on the image, Solutions contribute approximately 55–57% of overall market demand due to high adoption in payment infrastructure and enterprise security modernization.
- Services account for roughly 43–45% as organizations require integration support, continuous security updates, and managed token lifecycle operations across complex digital ecosystems.
Market Drivers:
Strong Acceleration in Data Security Investments Across Regulated and High-Risk Industries
Enterprises raise security budgets to protect sensitive information in the Global Tokenization Market. Many firms implement token systems to prevent exposure of customer records during breaches. It supports safer processing of financial data across banks and payment firms. Regulatory bodies enforce strict controls that push companies toward stronger protection. Digital commerce platforms use token layers to protect customer identities. Retail groups adopt token vaults to reduce data access points. Healthcare providers secure patient records through encrypted token systems. Large enterprises value reduced compliance burdens delivered by modern token frameworks. Demand strengthens due to rising cyber threats across open digital channels.
- For instance, Stripe confirmed that its automated tokenization framework protects businesses by replacing raw card numbers with secure tokens. Retail groups adopt token vaults to reduce data access points.
Growing Demand for Secure Payment Ecosystems Across Expanding Digital Commerce Platforms
E-commerce growth drives heavy use of token solutions across payment infrastructure in the Global Tokenization Market. Merchants apply token services to protect cardholder details during checkout. It supports cleaner workflows in mobile wallets and online gateways. Many fintechs deploy real-time token mapping to reduce fraud attempts. Contactless payments benefit from improved security layers that protect user credentials. Banks integrate token APIs for faster onboarding of new payment functions. Cloud payment systems rely on token engines to eliminate sensitive data exposure. Global transactions gain higher trust when tokens mask original card data. Adoption rises across industries that process continuous online transactions.
- For instance, Mastercard's tokenization platform helps secure billions of transactions monthly, with over 30% of all Mastercard transactions worldwide now tokenized, significantly reducing fraud rates for digital commerce transactions. It supports cleaner workflows in mobile wallets and online gateways by replacing sensitive card information with a unique, worthless digital token, enabling a faster, safer, and often one-click checkout experience.
Rising Integration of Cloud-Native Security Frameworks Within Digital Transformation Programs
Cloud expansion fuels broad adoption of token platforms in the Global Tokenization Market. Many firms migrate workloads to public and hybrid clouds that demand new security layers. It becomes a core shield for sensitive data inside cloud applications. Software providers design token engines that support multi-region processing. Enterprises value platform agility that supports scaling without exposing user information. DevOps teams embed token models into application pipelines for safer development. Cloud security teams rely on token policy controls to reduce unauthorized access. Hybrid networks benefit from centralized token governance tools. Demand grows from companies that replace legacy systems with cloud-ready platforms.
Higher Enterprise Focus on Reducing Compliance Complexity Across Global Regulatory Environments
Compliance pressure drives rapid adoption of token frameworks in the Global Tokenization Market. Firms face strict rules such as PCI DSS and GDPR that limit storage of sensitive data. It helps companies avoid penalties by removing original records from internal systems. Auditors support token use due to low exposure risk during inspection. Businesses value simplified reporting due to reduced access to protected data. Multinational companies deploy token systems to unify compliance practices across regions. Internal teams gain improved control over data residency requirements. Many firms restructure security plans around token vault architecture. Adoption increases where regulatory environments evolve rapidly.
Market Trends:
Growing Deployment of Real-Time Token Orchestration and Intelligent Policy Engines Across Enterprise Networks
Real-time orchestration shapes new deployment patterns in the Global Tokenization Market. Enterprises adopt intelligent routing engines that apply tokens across diverse systems. It helps unify data protection rules across payment, cloud, and analytics functions. Vendors integrate policy-driven token flows into broader security ecosystems. Automatic mapping tools improve flexibility for large enterprises. Real-time governance enables firms to adapt protection levels quickly. Token distribution improves consistency across multi-application environments. Many platforms embed analytics features that track misuse attempts. Adoption rises among enterprises seeking intelligent data protection controls.
- For instance, IBM Guardium Data Protection offers automated token policy enforcement and processes billions of audit events daily across enterprise clients. Adoption rises among enterprises seeking intelligent data protection controls.
Increasing Adoption of Tokenization in Machine-to-Machine and IoT Security Frameworks
IoT expansion supports new token applications in the Global Tokenization Market. Firms integrate token systems to protect device identities across interconnected networks. It limits exposure of device credentials during communication cycles. Sensors and smart devices rely on lightweight token formats for safe data transfer. Industrial operators use token methods to secure factory automation systems. It reduces vulnerability within distributed edge environments. Vendors release device-friendly token modules that reduce processing load. Smart home ecosystems gain stronger protection through device token layers. Growth accelerates with rising industrial IoT adoption.
- For instance, Siemens MindSphere handles industrial IoT data from millions of devices, using encrypted identity protection frameworks. It reduces vulnerability within distributed edge environments. Vendors release device-friendly token modules that reduce processing load.
Rapid Shift Toward Decentralized Token Models Supporting Next-Generation Digital Identity Platforms
Decentralized token designs create new pathways in the Global Tokenization Market. Digital identity solutions adopt token models to control personal data movement. It enables selective disclosure without exposing full user details. Self-sovereign identity systems use token credentials for higher privacy. Governments explore token layers for citizen identity programs. Enterprises value reduced dependency on centralized databases. Blockchain networks support verifiable token formats for identity checks. Technology firms integrate decentralized tokens into trust frameworks. Adoption grows where privacy rules become stricter.
Expansion of Tokenization Across Cross-Border Transactions and Global Merchant Networks
Cross-border commerce drives new opportunities in the Global Tokenization Market. Global merchants use token layers to protect payment information during foreign transactions. It supports secure routing across international gateways. PSPs integrate multi-currency token systems to simplify global payments. Travel and hospitality platforms deploy tokenized profiles for frequent travelers. Token networks improve interoperability among issuing banks. Payment processors use token rules to manage multi-region authorization. Online marketplaces standardize token use across global storefronts. Growth rises due to increasing cross-border digital trade.
Market Challenges Analysis:
High Integration Complexity and Limited Interoperability Across Diverse Enterprise Architectures
Integration hurdles create major barriers in the Global Tokenization Market. Many enterprises operate fragmented systems that complicate token deployment. It becomes difficult for teams to align legacy databases with modern token engines. Vendors face demand for custom connectors that increase installation time. Lack of standard formats slows adoption across industries. Companies struggle to manage token lifecycles across distributed networks. Multi-cloud environments complicate governance for large firms. Technical skill shortages limit smooth implementation across IT teams. Complexity reduces adoption speed in highly regulated sectors.
Rising Concerns Over Vendor Dependence, Long-Term Scalability, and Operational Continuity Risks
Vendor lock-in challenges hinder movement in the Global Tokenization Market. Businesses worry about long-term reliance on single-provider token vaults. It impacts operational continuity during provider outages or migration plans. Scalability issues appear as firms process larger data volumes. Vendors must maintain stable frameworks to avoid performance disruption. Companies require strong SLAs to protect critical operations. Security teams evaluate switching costs before committing to large systems. Market growth faces pressure where firms hesitate to adopt long contracts. Concern grows in industries with rapid data expansion.
Market Opportunities:
Growing Potential for Token-Enabled Privacy Models Across AI, Analytics, and High-Volume Data Ecosystems
Privacy-centric innovation opens strong opportunities in the Global Tokenization Market. AI platforms require safer ways to handle sensitive training data. It supports secure sharing between enterprises and analytics teams. New solutions help firms mask customer identities during model development. Regulatory pressure accelerates demand for privacy-safe data pipelines. Vendors build advanced token engines that support high-scale automation. Enterprises explore token design to improve trust in AI processes. Many industries seek flexible privacy tools that fit new data architectures. Adoption expands across global digital ecosystems.
Expanding Use of Tokenization Within Cloud-Native, API-Driven, and Borderless Digital Payment Infrastructure
API adoption strengthens high-growth opportunities in the Global Tokenization Market. Global payment platforms move toward token-first architectures for stronger security. It supports unified protection across mobile wallets and online checkout systems. Fintechs use token APIs to build fast and safe payment experiences. Cross-platform integration becomes easier through standardized token modules. Cloud-native payments accelerate token adoption across global networks. Vendors introduce flexible deployment models that fit multi-region expansion. Market momentum rises where digital commerce evolves quickly.
Market Segmentation Analysis:
By Component
Solution offerings hold strong demand due to wide use in payment protection and data masking across enterprises. Many firms prefer unified platforms that reduce exposure of sensitive records. Services gain steady traction through rising integration needs and ongoing support requirements. The Global Tokenization Market benefits from both components, and it strengthens security frameworks for regulated industries. Vendors focus on faster deployment cycles and flexible service models that support varied compliance structures. Demand rises where enterprises aim to centralize data protection. Solution and service segments maintain broad relevance across digital ecosystems.
- For instance, Protegrity provides managed tokenization support to organizations processing over 2 trillion data elements annually, ensuring ongoing compliance. Demand rises where enterprises aim to centralize data protection.
By Application
Payment security dominates due to heavy use in online and mobile transactions. User authentication expands across identity-driven platforms that require precise verification. Compliance management grows through rising regulatory oversight across global markets. Other applications gain visibility across sectors adopting token-based workflows. Enterprises implement application-specific models to reduce operational risks. Token layers help protect customer identities during critical processes. Application diversity supports wider adoption across industries seeking consistent protection.
- For instance, Google Cloud’s payment tokenization protects identities across hundreds of millions of account holders, reducing the need to store sensitive credentials. Application diversity supports wider adoption across industries seeking consistent protection.
By Industry Vertical
Retail and e-commerce lead adoption due to constant exposure to payment fraud. Healthcare expands its use of token layers to protect patient information across digital systems. IT firms embed token controls within cloud and software environments. Government and BFSI deploy strict frameworks to meet regulatory standards. Other sectors integrate token tools to secure internal workflows. Industry diversity strengthens use cases across global markets. Each vertical benefits from safer data handling.
By Technology
API-based tokenization delivers strong growth through flexible integration across cloud and mobile systems. Gateway-based models support merchants requiring structured payment routing. Vendors enhance both methods to match enterprise needs. Technology choice depends on infrastructure maturity.
By Deployment
Cloud deployment leads due to rapid digital transformation and scalable protection needs. On-premises models remain relevant for firms requiring full control of sensitive records. Enterprises evaluate both approaches based on security posture and operational structure.
Segmentation:
By Component
- Solution
- Services
By Application
- Payment Security
- User Authentication
- Compliance Management
- Others
By Industry Vertical
- Retail & E-commerce
- Healthcare
- IT
- Government & BFSI
- Others
By Technology
- API-Based Tokenization
- Gateway-Based Tokenization
By Deployment
- Cloud
- On-Premises
By Region
- North America
- U.S.
- Canada
- Mexico
- Europe
- Germany
- France
- U.K.
- Italy
- Spain
- Rest of Europe
- Asia Pacific
- China
- Japan
- India
- South Korea
- South-east Asia
- Rest of Asia Pacific
- Latin America
- Brazil
- Argentina
- Rest of Latin America
- Middle East & Africa
- GCC Countries
- South Africa
- Rest of the Middle East and Africa
Regional Analysis:
North America
North America Tokenization Market Size Overview The North America Tokenization Market size was valued at USD 460.80 million in 2018, rising to USD 958.38 million in 2024, and is anticipated to reach USD 5,662.47 million by 2032, at a CAGR of 25.0%, holding 37.96% regional share in 2024. North America leads the Global Tokenization Market due to strong adoption of digital payment systems and strict compliance rules across major industries. Enterprises deploy advanced token solutions to secure sensitive data during high-volume transactions. It supports payment modernization efforts across banks and fintech firms. Retailers enhance customer protection through token layers that strengthen checkout security. Healthcare players use token engines to protect patient records. Vendors expand cloud and API-based solutions to support multi-channel operations. Adoption rises as enterprises prioritize modern security frameworks that match evolving regulatory demands.
Europe
Europe Tokenization Market Size Overview The Europe Tokenization Market size was valued at USD 321.60 million in 2018, rising to USD 650.81 million in 2024, and is anticipated to reach USD 3,640.82 million by 2032, at a CAGR of 24.1%, holding 25.78% regional share in 2024. Europe shows strong token adoption supported by GDPR enforcement and growing digital service expansion. Enterprises deploy token engines to limit use of sensitive customer information. It helps firms strengthen compliance posture across diverse regulatory zones. BFSI and retail sectors drive rapid integration to reduce cross-border fraud exposure. Healthcare organizations secure clinical data with advanced token modules. Cloud migration increases token use across regional enterprises. Vendors build privacy-centric architectures tailored to strict EU requirements. Growth improves with rising digital engagement across consumer and business platforms.
Asia Pacific
Asia Pacific Tokenization Market Size Overview The Asia Pacific Tokenization Market size was valued at USD 289.20 million in 2018, rising to USD 635.85 million in 2024, and is anticipated to reach USD 4,156.85 million by 2032, at a CAGR of 26.5%, holding 25.18% regional share in 2024. Asia Pacific expands rapidly due to heavy digital payment penetration and strong fintech growth across major economies. Enterprises integrate token systems to protect users across high-volume mobile transactions. It supports digital banking modernization programs across fast-growing markets. Retailers use token vaults to reduce fraud risk during online purchases. Governments push secure payment frameworks that promote broad adoption. Cloud and API-driven systems accelerate token integration across large networks. Technology vendors scale capacity to support rising demand. Growth builds on rapid digital transformation across regional industries.
Latin America
Latin America Tokenization Market Size Overview The Latin America Tokenization Market size was valued at USD 81.60 million in 2018, rising to USD 170.14 million in 2024, and is anticipated to reach USD 939.06 million by 2032, at a CAGR of 23.9%, holding 6.74% regional share in 2024. Latin America gains traction due to rising digital banking activity and strong mobile commerce expansion. Enterprises deploy token layers to strengthen payment security across online channels. It supports fraud reduction efforts across major consumer markets. Retailers integrate token tools to protect customer identity during digital checkout. Cloud adoption expands secure infrastructure options for enterprises. Governments promote modernization of financial systems to build trust in digital payments. Vendors design adaptive token models to match diverse regulatory environments. Growth improves with rising digital purchasing behavior across the region.
Middle East
Middle East Tokenization Market Size Overview The Middle East Tokenization Market size was valued at USD 28.32 million in 2018, rising to USD 53.51 million in 2024, and is anticipated to reach USD 264.46 million by 2032, at a CAGR of 22.2%, holding 2.12% regional share in 2024. The Middle East expands token adoption as governments promote digital transformation across financial and public services. Enterprises deploy token systems to reduce risk during online payment flows. It helps banks strengthen mobile banking security across growing user bases. Retail and hospitality sectors use token engines to improve customer experience. Cloud migration drives adoption of scalable token layers. Vendors support regional needs with advanced API-based models. Digital commerce expansion encourages merchants to integrate secure payment systems. Growth rises with higher reliance on digital identity and payment tools.
Africa
Africa Tokenization Market Size Overview The Africa Tokenization Market size was valued at USD 18.48 million in 2018, rising to USD 56.06 million in 2024, and is anticipated to reach USD 272.88 million by 2032, at a CAGR of 21.3%, holding 2.22% regional share in 2024. Africa shows emerging adoption driven by rapid mobile payment expansion across major economies. Enterprises deploy token platforms to protect sensitive records within financial ecosystems. It strengthens mobile wallet security during growing digital transactions. Retailers adopt token methods to protect online customers. Governments invest in programs that support secure digital infrastructure. Cloud use expands across businesses seeking scalable protection tools. Vendors explore local partnerships to meet rising demand. Growth improves with increasing user trust in digital services.
Key Player Analysis:
- Visa, Inc.
- MasterCard, Inc.
- Fiserv, Inc.
- American Express Company
- Thales Group
Competitive Analysis:
The Global Tokenization Market shows strong competition among payment networks, cybersecurity firms, and cloud security providers. Leading companies invest in advanced token engines that support large-scale digital transactions. It benefits from continuous improvements in fraud detection, multi-channel protection, and compliance-driven security models. Vendors focus on API-based integration to meet enterprise needs across cloud, mobile, and on-prem systems. Strategic alliances between fintechs and security firms strengthen technology depth. Market leaders expand portfolios through acquisitions to enhance global reach. Competitive pressure drives rapid innovation, broader service offerings, and stronger customer retention strategies.
Recent Developments:
- In November 2025, Thales Group highlighted its cloud‑native D1 modern card issuing platform as a tokenization‑centric solution that allows banks and fintechs to issue virtual and physical cards in real time, push them into digital wallets, and manage tokenized payment credentials across schemes, positioning the platform as a key enabler in the global tokenization and digital payments market.
- In June 2025, Mastercard reported that almost half of its e‑commerce transactions in Europe are now tokenized as part of its checkout transformation program, underscoring the company’s growing deployment of network tokenization to secure card‑not‑present payments and support a stated goal of achieving fully tokenized e‑commerce transactions in the region by 2030.
- In June 2025, Fiserv announced FIUSD, a new stablecoin and digital asset service designed for financial institutions, using blockchain to enable tokenized deposits and programmable payments across its global network, thereby extending tokenization concepts into 24/7 settlement and new digital asset use cases within traditional banking and payment flows.
- In February 2025, Fiserv expanded its tokenized payments capabilities for integrated software vendors by promoting a hosted iFrame tokenization solution that captures card data directly on Fiserv’s secure servers and returns tokens to merchants, helping them reduce PCI scope, lower fraud risk, and deliver more seamless digital checkout experiences.
- In November 2024, American Express Company entered into an API‑based data access agreement with MX Technologies that lets customers permission and share financial data more securely, a move that complements the American Express Token Service by enhancing how tokenized and permissioned data can be used across digital payment and financial management applications.
Report Coverage:
The research report offers an in-depth analysis based on By Component, By Application, By Industry Vertical, By Technology, and By Deployment. It details leading market players, providing an overview of their business, product offerings, investments, revenue streams, and key applications. Additionally, the report includes insights into the competitive environment, SWOT analysis, current market trends, as well as the primary drivers and constraints. Furthermore, it discusses various factors that have driven market expansion in recent years. The report also explores market dynamics, regulatory scenarios, and technological advancements that are shaping the industry. It assesses the impact of external factors and global economic changes on market growth. Lastly, it provides strategic recommendations for new entrants and established companies to navigate the complexities of the market.
Future Outlook:
- Demand for secure digital transactions will drive wider enterprise adoption.
- API-focused token services will gain stronger presence across cloud ecosystems.
- Growth in mobile payments will accelerate deployment across emerging markets.
- Cross-border commerce will increase use of interoperable token frameworks.
- Zero-trust security models will reinforce enterprise reliance on token layers.
- Financial institutions will expand investment in scalable token platforms.
- Healthcare digitalization will boost adoption of patient-data token protection.
- Retail transformation will drive integration of token tools across online channels.
- Regulatory tightening will increase compliance-driven implementation.
- Technology vendors will invest in automation and AI-enabled token management.
Request a Free Sample
Fill in your details and we'll send you a free sample report.
- Sample data tables & charts
- Research methodology
Need a Custom Version of This Report?
Tailor the scope, geography, or segments to your exact requirements.
- Custom geography or segment scope
- Direct access to our analyst team
Frequently Asked Questions
What is the current size of the Tokenization Market?
At what Compound Annual Growth Rate is the Global Tokenization Market projected to grow between 2025 and 2032?
What factors are driving the growth of the Tokenization Market?
What are some challenges faced by the Tokenization Market?
Who are the major players in the Tokenization Market?
Which segment is leading the market share?
Table of Content
Chapter 1. Report Introduction
- 1.1 Report Description & Purpose
- 1.1.1 Report Title & Market Definition
- 1.1.2 Unique Selling Propositions (USP) & Key Differentiators
- 1.1.3 Value Proposition for Stakeholders
- 1.2 Research Objectives
- 1.2.1 Market Sizing Objectives (Volume & Revenue)
- 1.2.2 Segmentation Objectives
- 1.2.3 Competitive Intelligence Objectives
- 1.2.4 Forecast & Scenario Objectives
- 1.3 Report Scope
- 1.3.1 Tokenization Scope – Types & Subtypes Covered
- 1.3.2 Geographic Scope – Regions & Countries Covered
- 1.3.3 Historical Period, Base Year & Forecast Period (2018; forecast to 2032)
- 1.3.4 Inclusions & Exclusions
- 1.4 HS Code & Classification Framework
- 1.5 Currency, Units & Pricing Basis
- 1.6 Target Stakeholders
- 1.7 Limitations & Assumptions
Chapter 2. Executive Summary
- 2.1 Global Tokenization Market Snapshot
- 2.1.1 Market Size – Historical (2018) & Forecast (2018-2032) (2018: USD 1,200.00 million → 2032: USD 14,936.54 million)
- 2.1.2 Volume & Revenue – Global Totals
- 2.1.3 Key Market Highlights – Top Five Facts
- 2.2 Tokenization Market Segmentation Snapshot
- 2.2.1 Market Split by Region – 2018 vs. 2032
- 2.3 Competitive Snapshot
- 2.3.1 Top 10 Players by Revenue Share – 2018
- 2.3.2 Top 10 Players by Volume Share – 2018
- 2.3.3 Recent Strategic Developments (18-Month Summary)
- 2.4 Key Investment Highlights & Strategic Conclusions
Chapter 3. Tokenization Market Dynamics & Industry Analysis
- 3.1 Market Overview & Context
- 3.1.1 Tokenization Market Position in the Broader Automotive Value Chain
- 3.1.2 OEM vs. Replacement Market Dynamics
- 3.1.3 Market Maturity & Development Stage by Region
- 3.2 Tokenization Market Drivers
- 3.3 Tokenization Market Restraints & Challenges
- 3.4 Tokenization Market Opportunities
- 3.5 Porter's Five Forces Analysis
- 3.5.1 Threat of New Entrants
- 3.5.2 Bargaining Power of Suppliers
- 3.5.3 Bargaining Power of Buyers
- 3.5.4 Threat of Substitutes
- 3.5.5 Competitive Rivalry – Intensity Assessment
- 3.6 Tokenization Value Chain Analysis
- 3.6.1 Upstream – Raw Material/Input Suppliers
- 3.6.1.1 Raw Material/Input 1
- 3.6.1.2 Raw Material/Input 2
- 3.6.1.3 Raw Material/Input 3
- 3.6.2 Midstream – Production/Manufacturing/Service Delivery
- 3.6.2.1 Production/Process Overview
- 3.6.2.2 Key Facility Locations & Capacity by Manufacturer
- 3.6.3 Downstream – Distribution & End Consumer
- 3.6.3.1 Primary Channel – B2B/OEM
- 3.6.3.2 Secondary Channels – Dealer, Retail, Online, Direct
- 3.6.4 Value Chain Profitability Analysis
- 3.6.1 Upstream – Raw Material/Input Suppliers
- 3.7 PESTEL Analysis
- 3.7.1 Political Factors
- 3.7.2 Economic Factors
- 3.7.3 Social Factors
- 3.7.4 Technological Factors
- 3.7.5 Environmental Factors
- 3.7.6 Legal Factors
- 3.8 Tokenization Supply Chain Analysis
- 3.8.1 Raw Material/Input Supply Risk Assessment
- 3.8.2 Manufacturing Concentration Risk (Geographic Exposure)
- 3.8.3 Trade Disruption Impact Analysis
- 3.9 Regulatory & Policy Landscape
Note: The regulatory and policy landscape section covers regulations based on their applicability to the market, Tokenization category, geography, and scope of the study. Only regulatory frameworks with a material impact on operations, compliance, trade, sustainability, or market access are analyzed in detail.
Chapter 4. Key Investment Pockets & Opportunity Analysis
- 4.1 Tokenization Market Attractiveness Analysis
- 4.1.1 By Region – Investment Attractiveness Matrix (Volume × CAGR)
- 4.2 Absolute Revenue Growth Opportunity
- 4.2.1 By Region – Absolute USD Growth Through 2032
- 4.3 Incremental Volume Opportunity
- 4.3.1 By Region – Incremental Volume Through 2032
- 4.3.2 Segment – Incremental Volume
- 4.4 Emerging Submarket Opportunity Deep Dive (Subject to Applicability)
- 4.5 Emerging Market Opportunity Scorecards
- 4.5.1 United States
- 4.5.2 Europe
- 4.5.3 Asia
- 4.5.4 Middle East & Africa
Note: Emerging Market Opportunity Scorecards will be included based on relevance and strategic importance. Regions listed are indicative and may vary depending on data availability and market dynamics.
Chapter 5. Tokenization Import-Export Analysis & Trade Flows
- 5.1 Global Trade Overview
- 5.1.1 Global Export Value by Country (2018)
- 5.1.2 Global Export Volume by Country (2018)
- 5.1.3 Global Import Value by Country (2018)
- 5.1.4 Global Import Volume by Country (2018)
- 5.1.5 Net Trade Balance by Country (2018)
- 5.2 Export Analysis – Segment
- 5.2.1 Type 1 (HS Code)
- 5.2.2 Type 2 (HS Code)
- 5.2.3 Type 3 (HS Code)
- 5.2.4 Type 4 (HS Code)
- 5.2.5 Type 5 (HS Code)
- 5.3 Import Analysis – Segment
- 5.3.1 Type 1 (HS Code)
- 5.3.2 Type 2 (HS Code)
- 5.3.3 Type 3 (HS Code)
- 5.3.4 Type 4 (HS Code)
- 5.3.5 Type 5 (HS Code)
- 5.4 Average Unit Trade Prices
- 5.4.1 Average Export Price – Segment & Country
- 5.4.2 Average Import Price – Segment & Source Country
- 5.4.3 Price Trends (2018)
- 5.5 Key Trade Route Analysis
- 5.5.1 Trade Route 1
- 5.5.2 Trade Route 2
- 5.5.3 Trade Route 3
- 5.5.4 Trade Route 4
- 5.5.5 Trade Route 5
- 5.6 Trade Policy Impact Assessment
- 5.6.1 US Anti-Dumping & Section 301 Tariffs
- 5.6.2 EU Customs Union Impact
- 5.6.3 Major Free Trade Agreements
- 5.6.4 USMCA Rules of Origin
Note: Trade policy analysis will be included only where relevant to the Tokenization market.
Chapter 6. Competitive Landscape & Company Benchmarking
- 6.1 Tokenization Market Concentration & Structure
- 6.1.1 Herfindahl-Hirschman Index (HHI) – vs. 2018
- 6.1.2 Tier 1, Tier 2 & Tier 3 Market Structure
- 6.1.3 Global, Regional & Local Player Dynamics
- 6.2 Tokenization Market Share Analysis – 2018
- 6.2.1 Global Revenue Share by Company
- 6.2.2 Global Volume Share by Company
- 6.2.3 Regional Revenue Share
- 6.2.4 Market Share Evolution ( vs. 2018)
- 6.2.5 OEM Segment Share by Company
- 6.2.6 Replacement Segment Share by Company
- 6.3 Production/Delivery Capacity & Facility Analysis
- 6.3.1 Global Installed Capacity
- 6.3.2 Capacity Utilization Rates
- 6.3.3 Production/Output Volume
- 6.3.4 Facility Locations & Capacity Map
- 6.3.5 Planned Capacity Additions
- 6.4 Tokenization Competitive Benchmarking Matrix
- 6.4.1 Revenue, Volume, CAGR & Profitability Comparison
- 6.4.2 Channel Revenue Mix
- 6.4.3 Geographic Revenue Exposure
- 6.4.4 R&D Intensity
- 6.4.5 Sustainability Maturity
- 6.5 Strategic Developments in Tokenization (Last 24 Months)
- 6.5.1 Mergers, Acquisitions & Divestments
- 6.5.2 New Tokenization Launches
- 6.5.3 Facility Expansions
- 6.5.4 Strategic Alliances, Joint Ventures & Partnerships
- 6.5.5 Distribution Expansion & Market Entry
- 6.5.6 Sustainability & ESG Initiatives
- 6.6 Competitive Strategy Mapping
- 6.6.1 Leader, Challenger, Follower & Niche Classification
- 6.6.2 Pricing Strategy Comparison
- 6.6.3 Channel Strategy Matrix
Note: Strategic developments are included based on their materiality and the availability of reliable information.
Chapter 7. Global Tokenization Market – By Distribution Channel
- 7.1 Segment Overview
- 7.1.1 Volume & Revenue Split by Channel (2018 & 2032)
- 7.1.2 Channel Mix Evolution (2018-2032)
Chapter 8. Regional Market Analysis – Global Overview
- 8.1 Global Regional Overview
- 8.1.1 Regional Volume Share
- 8.1.2 Regional Revenue Share
- 8.1.3 Regional Volume by Region
- 8.1.4 Regional Revenue by Region
- 8.1.5 Regional Forecast Through 2032
- 8.2 Cross-Regional Segment Analysis
- 8.2.1 By Distribution Channel
- 8.2.2 By Brand/Price Tier
Chapter 9. North America Tokenization Market
- 9.1 United States
- 9.2 Canada
- 9.3 Mexico
Chapter 10. Europe Tokenization Market
- 10.1 Germany
- 10.2 France
- 10.3 Italy
- 10.4 United Kingdom
- 10.5 Spain
- 10.6 Poland
- 10.7 Russia
- 10.8 Netherlands
- 10.9 Belgium
- 10.10 Sweden
- 10.11 Denmark
- 10.12 Norway
- 10.13 Rest of Europe
Chapter 11. Asia Pacific Tokenization Market
- 11.1 China
- 11.2 India
- 11.3 Japan
- 11.4 South Korea
- 11.5 Thailand
- 11.6 Indonesia
- 11.7 Vietnam
- 11.8 Malaysia
- 11.9 Australia
- 11.10 Rest of Asia Pacific
Chapter 12. Latin America Tokenization Market
- 12.1 Brazil
- 12.2 Argentina
- 12.3 Colombia
- 12.4 Chile
- 12.5 Rest of Latin America
Chapter 13. Middle East Tokenization Market
- 13.1 Saudi Arabia
- 13.2 United Arab Emirates
- 13.3 Turkey
- 13.4 Israel
- 13.5 Iran
- 13.6 Rest of the Middle East
Chapter 14. Africa Tokenization Market
- 14.1 South Africa
- 14.2 Egypt
- 14.3 Nigeria
- 14.4 Morocco
- 14.5 Rest of Africa
Chapter 15. Tokenization Company Profiles
- 15.1 [Company 01]
- 15.1.1 Company Overview
- 15.1.2 Key Management Personnel
- 15.1.3 Products & Services Portfolio
- 15.1.4 Financial Performance
- 15.1.5 Key Market Focus & Geographic Presence
- 15.1.6 Recent Developments & Strategic Initiatives
Note: The company profile list is preliminary and may change based on research findings, market developments, data availability, and client requirements.
Chapter 16. Appendices
- Appendix A – List of Abbreviations & Acronyms
- Appendix B – Industry Classification Code Reference – Full Series
- Appendix C – Production & Capacity Data Tables
- Appendix D – End-Use & Demand Base Tables
- Appendix E – Consumption & Replacement Rate Assumptions
- Appendix F – ASP Reference Tables
- Appendix G – Manufacturing & Facility Database
- Appendix H – Import-Export Data Tables
- Appendix I – Regulatory Summary Tables
- Appendix J – Primary Research Participant List (Anonymized)
- Appendix K – Primary Research Questionnaire Framework
- Appendix L – Data Sources & Bibliography
- Appendix M – Market Size Divergence & Source Comparison
Chapter 17. Research Methodology
- 17.1 Research Framework & Philosophy
- 17.2 Secondary Research – Sources, Hierarchy & Data Extraction
- 17.3 Data Modeling – Bottom-Up & Top-Down Market Sizing
- 17.4 Primary Research – Stakeholder Framework, LOI & Sample Sizes
- 17.5 Forecast Methodology – Regression, Scenario & Sensitivity Analysis
- 17.6 Quality Control – Four-Layer Validation Framework
- 17.7 Limitations & Standard Assumptions
- 17.8 Disclaimer
