Market Overview
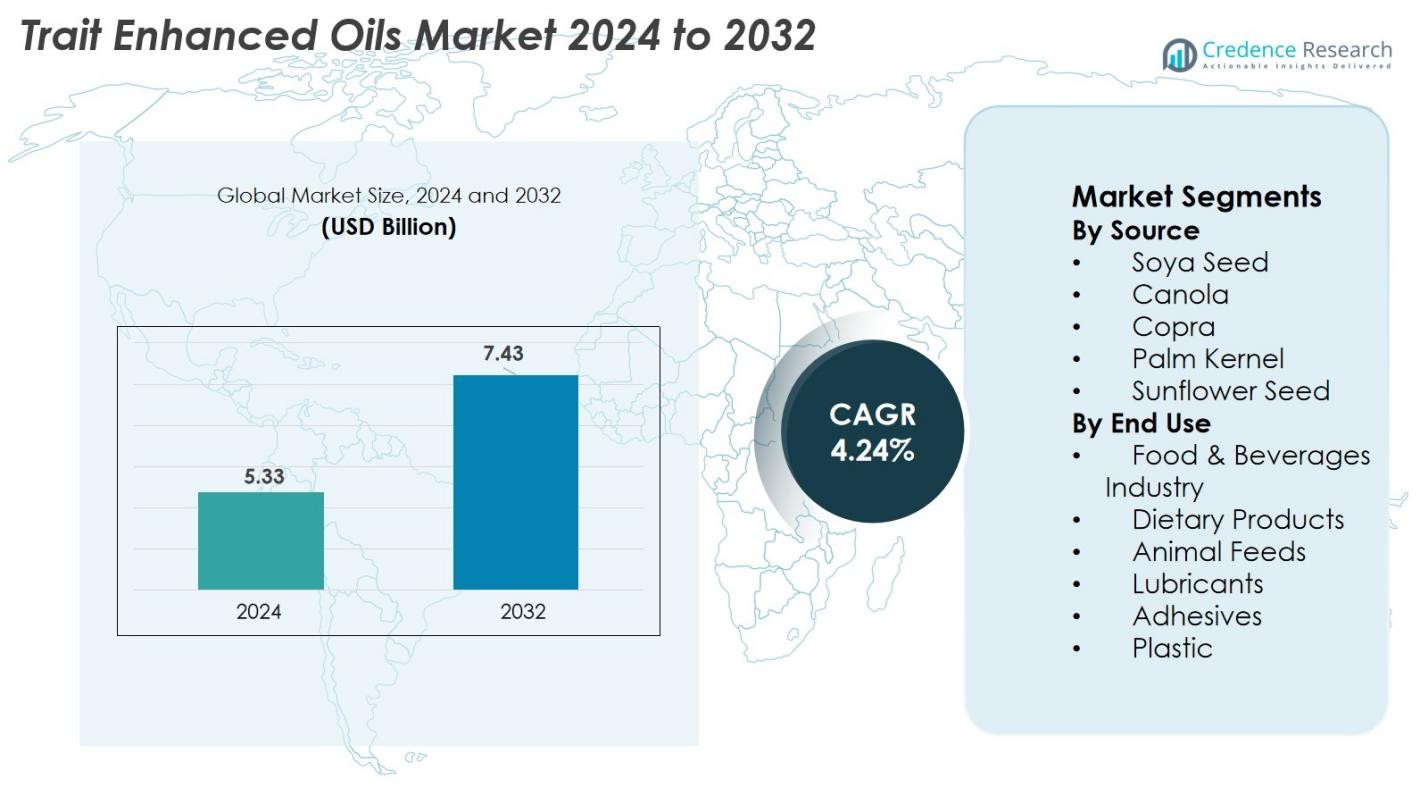
Trait Enhanced Oils market size was valued at USD 5.33 Billion in 2024 and is anticipated to reach USD 7.43 Billion by 2032, at a CAGR of 4.24% during the forecast period.
| REPORT ATTRIBUTE |
DETAILS |
| Historical Period |
2020-2023 |
| Base Year |
2024 |
| Forecast Period |
2025-2032 |
| Trait Enhanced Oils market Size 2024 |
USD 5.33 Billion |
| Trait Enhanced Oils market, CAGR |
4.24% |
| Trait Enhanced Oils market Size 2032 |
USD 7.43 Billion |
Trait Enhanced Oils market is driven by strong participation from leading players such as Bayer CropScience AG, Dow AgroSciences LLC, Syngenta AG, E. I. du Pont de Nemours & Company, Archer Daniels Midland Company, Burrus Seed Farm, Hefei Fengle Seed Co. Ltd., DragonWave, Huawei Technologies, and Ericsson, all of whom contribute through advanced trait development, seed innovation, and refined oil processing technologies. North America leads the global market with a 34.2% share, supported by extensive adoption of trait-enhanced oilseed crops and robust processing infrastructure. Asia Pacific follows with 29.8%, driven by expanding food, feed, and industrial applications and rising biotechnology investments across major economies.
Access crucial information at unmatched prices!
Request your sample report today & start making informed decisions powered by Credence Research Inc.!
Download Sample
Market Insights
- The Trait Enhanced Oils market was valued at USD 5.33 billion in 2024 and is projected to reach USD 7.43 billion by 2032, growing at a CAGR of 4.24% during the forecast period.
- Market growth is driven by rising demand for high-oleic and nutrient-enhanced oils across food processing, dietary products, and industrial applications, supported by advancements in genetic engineering and precision agriculture.
- Trends include increasing adoption of bio-based materials, with high-oleic soybean oil and canola oil gaining strong traction; the leading source segment, soy seed, accounts for 42.6% share.
- Key players such as Bayer CropScience, Syngenta AG, Dow AgroSciences, ADM, DuPont, and Hefei Fengle Seed Co. continue to invest in trait development, seed improvement, and high-performance oil formulations to strengthen market positioning.
- Regionally, North America leads with 34.2% share, followed by Asia Pacific at 29.8% and Europe at 22.7%, while Latin America and the Middle East & Africa collectively expand through increasing oilseed cultivation and rising imports.
Market Segmentation Analysis
By Source
The Trait Enhanced Oils market by source is dominated by Soya Seed, capturing 42.6% of the total share in 2024. Its leadership stems from high cultivation volumes, strong genetic modification adoption, and wide applicability across food, feed, and industrial sectors. Soya-based trait-enhanced oils benefit from improved oxidative stability, healthier fatty-acid profiles, and higher yield traits, making them preferred among processors. Canola and Sunflower Seed segments are also growing steadily, driven by rising demand for low-saturated-fat oils and expanding premium edible oil applications, while Copra and Palm Kernel oils find increasing use in industrial formulations.
- For instance, Corteva Agriscience reported that its Plenish® high-oleic soybeans deliver up to three times longer fry life, enabling food processors to reduce oil usage and improve product quality.
By End Use
The Food & Beverages Industry segment leads the market with 36.8% share in 2024, supported by rising consumer preference for healthier cooking oils, enhanced shelf stability, and improved nutritional profiles. The segment’s growth is driven by the adoption of high-oleic and low-linolenic trait-enhanced oils by packaged food manufacturers seeking cleaner labels and better frying performance. Dietary products continue to expand due to increasing health-focused formulations, while Animal Feeds, Lubricants, and Adhesives segments grow as industries integrate bio-based, high-performance oils for sustainability and cost-efficiency advantages.
- For instance, Cargill documented that its high-oleic soybean oil improves frying stability by up to 20–50% over conventional soybean oil, prompting adoption in major food processing applications.
Key Growth Drivers
Rising Demand for High-Oleic and Nutrient-Enhanced Oils
The global shift toward healthier dietary preferences continues to drive adoption of trait-enhanced oils with improved fatty-acid profiles, particularly high-oleic and low-linolenic variants. These oils offer enhanced oxidative stability, reduced trans-fat formation, longer shelf life, and superior frying performance, making them increasingly preferred by food manufacturers and quick-service restaurants. Regulatory actions restricting partially hydrogenated oils further accelerate this transition, pushing the food sector toward safer and higher-functionality alternatives. Advances in biotechnology enable precise nutritional modifications, allowing producers to introduce oils tailored for heart health, weight management, and improved metabolic outcomes. Rising health awareness in emerging economies provides additional demand support, with consumers seeking oils that combine performance, flavor quality, and nutritional benefits. Altogether, this shift toward healthier and cleaner-label products remains a fundamental driver shaping the long-term growth trajectory of the Trait Enhanced Oils market.
- For instance, the U.S. FDA confirmed that high-oleic soybean oils generate significantly lower trans-fat levels during deep frying compared with partially hydrogenated oils, supporting their adoption in major food chains.
Expanding Applications in Industrial and Bio-Based Material Sectors
Trait-enhanced oils are gaining strong traction in industrial applications due to their improved thermal stability, oxidative resistance, and renewable profile, making them effective substitutes for petroleum-derived chemicals. Lubricants, adhesives, coatings, and plasticizers increasingly incorporate enhanced-trait oils to meet rising sustainability requirements. Global regulatory mandates focused on reducing carbon emissions and promoting circular-economy-compliant raw materials further support this transition. Enhanced oils deliver superior processing efficiency, improved biodegradability, and customizable molecular structures suitable for demanding industrial environments. Their use in biopolymers and sustainable packaging materials continues to expand, driven by rising consumer expectations for eco-friendly products. As industries invest more heavily in bio-based materials, the ability of trait-enhanced oils to deliver high performance while reducing environmental impact creates a resilient growth avenue, strengthening their role in advanced manufacturing and specialty chemical applications.
- For instance, Cargill’s BiOH® polyols, produced from soy-based trait-enhanced oils, are widely used in flexible foams and coatings, reducing petroleum use by up to 60% in certain polyurethane applications.
Advancements in Seed Genetics and Precision Agriculture Technologies
Continuous innovation in genetic modification, molecular breeding, and CRISPR-based gene editing is enabling seed developers to engineer crops with tailored oil traits, improved yields, and greater resistance to climatic stresses. These scientific advancements reduce crop losses, enhance fatty-acid consistency, and strengthen supply reliability for both food and industrial users. Precision agriculture tools—including AI-driven crop monitoring, variable-rate fertilization, and real-time moisture analytics—further optimize field productivity and resource utilization. Such technologies help farmers maintain stable output even under environmental variability, improving the commercial viability of enhanced-trait crops. Biotechnology firms and agricultural producers are expanding collaborations to accelerate trait deployment and improve seed performance. With rising global demand for high-quality, functional oils, advancements in genetics and digital farming technologies remain pivotal in supporting efficient large-scale cultivation and securing long-term raw material availability.
Key Trends & Opportunities
Growing Integration of Trait-Enhanced Oils in Bio-Plastics and Sustainable Packaging
A major trend driving opportunity in the market is the rapid expansion of trait-enhanced oils in bio-plastics and eco-friendly packaging applications. As global regulations tighten around single-use plastics, manufacturers are increasingly relying on renewable oil-derived plasticizers, polymer stabilizers, and processing agents to improve sustainability performance. Enhanced-trait oils provide better heat stability and flexible molecular structures ideal for biodegradable films, containers, and compostable packaging solutions. Their integration enables the production of materials with improved durability, reduced toxicity, and lower carbon footprint. Chemical companies and packaging innovators are actively forming partnerships with oil processors to develop next-generation biopolymers that meet performance standards for consumer goods, automotive components, and industrial applications. This shift toward renewable materials opens long-term opportunities and positions trait-enhanced oils as a critical enabler in sustainable material innovation.
- For instance, Cargill and NatureWorks jointly expanded the supply of Ingeo™ PLA biopolymers derived from renewable plant oils and sugars which are widely used in compostable packaging, disposable serviceware, and bioplastic films.
Increasing Collaborations Across Seed Developers, Oil Processors, and Food Manufacturers
The market is experiencing rising collaboration across the agricultural and food value chain as companies seek to align seed trait development with processing efficiencies and product performance requirements. Seed companies work closely with food processors to develop oils with enhanced stability, tailored fatty-acid compositions, and improved frying or baking characteristics. Such partnerships accelerate product testing, minimize reformulation challenges, and ensure reliable supply for large-scale food production. Industrial manufacturers—including those in lubricants, plastics, and adhesives—are also collaborating with oil processors to co-create oils with specific viscosity, purity, and oxidative resistance targets. These integrated efforts shorten commercialization cycles, reduce R&D costs, and boost adoption across specialized applications. As value-chain integration strengthens, opportunities emerge for customized oil solutions with high margins and differentiated market positioning.
- For instance, Cargill and Unilever collaborated to advance sustainable plant-oil supply chains, ensuring processors receive oils meeting strict oxidative stability and performance requirements for large-scale food manufacturing.
Key Challenges
Regulatory Restrictions and Public Concerns Surrounding GM Crops
The Trait Enhanced Oils market continues to face significant challenges due to complex regulatory frameworks governing genetically modified crops, particularly in Europe and parts of Asia. Approval procedures for new traits are lengthy, expensive, and require extensive safety testing, slowing down commercialization and adding operational burdens for seed and oil developers. Public skepticism toward GMO-derived food ingredients also influences purchasing decisions, prompting manufacturers to invest in labeling transparency and consumer education. Trade regulations around GMO commodities create additional uncertainties for global supply chains. These factors collectively restrict market access in certain high-value regions and increase the cost structure for producers. As the debate over genetic modification persists, companies must continuously navigate regulatory, scientific, and public-relations challenges to maintain market momentum and expand into new geographies.
High Production Costs and Vulnerability to Agricultural Supply Chain Risks
Producing trait-enhanced oils requires substantial investment in biotechnology, genetic research, field trials, and advanced processing equipment, making them more expensive than conventional oils. Many small and mid-sized farmers face barriers in adopting improved seeds and precision agriculture technologies, limiting widespread cultivation. Supply chain vulnerability remains another major concern, as climate change, pest outbreaks, and extreme weather events significantly affect crop yields and quality. Disruptions in transportation, storage, and refining infrastructure—particularly in developing regions—add further operational complexity. These factors collectively impact supply stability, cost competitiveness, and market expansion. Manufacturers must balance innovation with cost-efficiency strategies while building resilient sourcing networks to mitigate agricultural and logistical risks.
Regional Analysis
North America
North America leads the Trait Enhanced Oils market with a 34.2% share in 2024, driven by widespread adoption of genetically enhanced oilseed crops, strong biotechnology capabilities, and high demand from both food and industrial sectors. The United States dominates due to extensive cultivation of soybean and canola with improved oil traits, supported by investments from leading seed and agri-biotech companies. The region’s packaged food and dietary product industries increasingly use high-oleic and low-linolenic oils. Favorable regulatory frameworks for GMO crops and well-established processing infrastructure further reinforce North America’s market leadership.
Europe
Europe holds a 22.7% share of the Trait Enhanced Oils market, supported by rising demand for sustainable, high-performance oils across food processing, cosmetics, specialty chemicals, and bio-based materials. While strict GMO regulations limit domestic cultivation, imports of trait-enhanced oilseeds and refined oils continue to rise. The shift toward cleaner-label edible oils and renewable industrial feedstocks aligns with EU Green Deal targets, driving further adoption. Innovation in biodegradable plastics, adhesives, and eco-friendly lubricants boosts consumption. Despite regulatory constraints, Europe remains a major demand center due to its strong focus on sustainability and high-value applications.
Asia Pacific
Asia Pacific accounts for 29.8% of the market and remains the fastest-growing region, fueled by rising food consumption, expanding industrial usage, and growing acceptance of biotechnology in China, India, and Australia. Demand for high-oleic soybean, canola, and sunflower oils is increasing across packaged foods, dietary supplements, and animal feed. Industrial sectors such as plastics, adhesives, and lubricants also drive uptake as they transition toward renewable, high-performance raw materials. Government support for agri-innovation, combined with expanding oilseed processing capacity, positions Asia Pacific as a major future growth hub for trait-enhanced oils globally.
Latin America
Latin America captures a 9.6% market share, supported by strong production of soybean and sunflower crops, particularly in Brazil, Argentina, and Paraguay. Favorable growing conditions, large-scale farming operations, and increasing use of genetically enhanced seeds contribute to higher yields and improved oil traits. The region is a major exporter of high-oleic soybean oil, strengthening its global relevance. Domestic demand is rising across food processing and animal nutrition, while industries such as adhesives and lubricants explore renewable alternatives. Continued investment in biotechnology and agritech enhances Latin America’s competitiveness as a supplier of trait-enhanced oils.
Middle East & Africa
The Middle East & Africa region holds a 3.7% share, driven primarily by rising imports of soybean, canola, and sunflower oils with enhanced traits, as local production remains limited. Food and beverage manufacturers increasingly adopt trait-enhanced oils to improve frying stability, product shelf life, and nutritional profiles. Countries such as South Africa and Egypt are gradually expanding the cultivation of improved oilseed varieties to strengthen supply security. Industrial applications, particularly in lubricants and polymer processing, are also emerging. Growing investment in agricultural modernization and food security initiatives supports gradual market expansion across the region.
Market Segmentations
By Source
- Soya Seed
- Canola
- Copra
- Palm Kernel
- Sunflower Seed
By End Use
- Food & Beverages Industry
- Dietary Products
- Animal Feeds
- Lubricants
- Adhesives
- Plastic
By Geography
- North America
- Europe
- Asia Pacific
- Latin America
- Middle East
- Africa
Competitive Landscape
The competitive landscape of the Trait Enhanced Oils market is shaped by a mix of global seed developers, biotechnology firms, and large-scale oil processors that continuously invest in advanced trait engineering and high-value oilseed varieties. Key players such as Bayer CropScience AG, Dow AgroSciences LLC, Syngenta AG, E. I. du Pont de Nemours & Company, Archer Daniels Midland Company, Burrus Seed Farm, Hefei Fengle Seed Co. Ltd., DragonWave, Huawei Technologies, and Ericsson contribute to innovation through genetic enhancement, precision breeding, and integrated supply chain capabilities. Companies focus on developing high-oleic, low-linolenic, and nutrient-enriched oil profiles tailored for food, industrial, and bio-based material applications. Strategic collaborations between seed developers and food processors accelerate commercialization of customized oils, while investments in digital agriculture tools enhance yield reliability and production efficiency. As sustainability demands rise, firms expand their portfolios toward renewable, high-performance oils, reinforcing competition across regions and enabling broader adoption in end-use industries.
Shape Your Report to Specific Countries or Regions & Enjoy 30% Off!
Key Player Analysis
Recent Developments
- In November 2025, Origin Agritech Ltd. entered into a patent license agreement with Shunfeng BioTech for the Cas-SF01 gene-editing tool — strengthening Origin’s gene-editing platform and advancing its capacity for trait-based crop / oilseed trait development.
- In May 2025, Asif Mukhtiar et al. published a review outlining how CRISPR/Cas–based gene-editing in Rapeseed is being leveraged to improve yield, stress resistance and importantly oil quality, signifying growing momentum for trait-enhanced rapeseed oils.
- In July 2024, Benson Hill, Inc. announced expansion of its innovation pipeline to deliver “advantaged traits” for soybean oil (among others) targeting animal-feed, soybean-oil and biofuel segments indicating new trait-enhanced oil varieties in development.
Report Coverage
The research report offers an in-depth analysis based on Source, End Use and Geography. It details leading market players, providing an overview of their business, product offerings, investments, revenue streams, and key applications. Additionally, the report includes insights into the competitive environment, SWOT analysis, current market trends, as well as the primary drivers and constraints. Furthermore, it discusses various factors that have driven market expansion in recent years. The report also explores market dynamics, regulatory scenarios, and technological advancements that are shaping the industry. It assesses the impact of external factors and global economic changes on market growth. Lastly, it provides strategic recommendations for new entrants and established companies to navigate the complexities of the market.
Future Outlook
- The market will experience steady growth as demand increases for healthier high-oleic and low-linolenic oils across food and dietary applications.
- Adoption of advanced genetic engineering and CRISPR technology will accelerate the development of crops with superior oil traits.
- Industrial applications such as lubricants, adhesives, coatings, and bio-plastics will expand significantly as industries shift toward renewable raw materials.
- Precision agriculture tools will enhance yield quality and oil consistency, supporting large-scale production.
- Collaborations between seed companies, processors, and food manufacturers will create faster commercialization pathways for customized oil profiles.
- Sustainability regulations will encourage wider use of bio-based, high-performance oils in packaging and industrial products.
- Asia Pacific will emerge as the fastest-growing region due to rising consumption, expanding processing capacity, and supportive agri-innovation policies.
- Europe will increase imports of trait-enhanced oils to meet its clean-label and green-material requirements.
- Investment in resilient agricultural supply chains will strengthen production stability amid climate variability.
- New specialty oil variants designed for niche industrial and nutritional applications will open additional high-value market opportunities.


