Market Overview
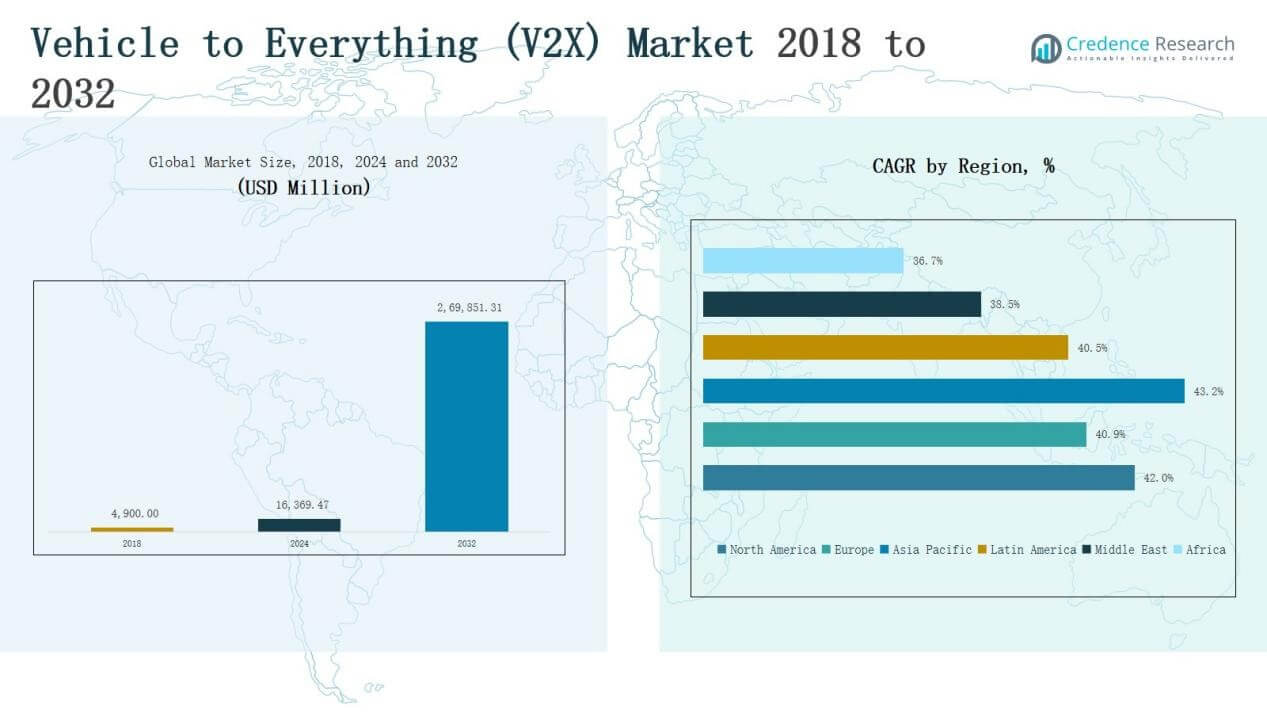
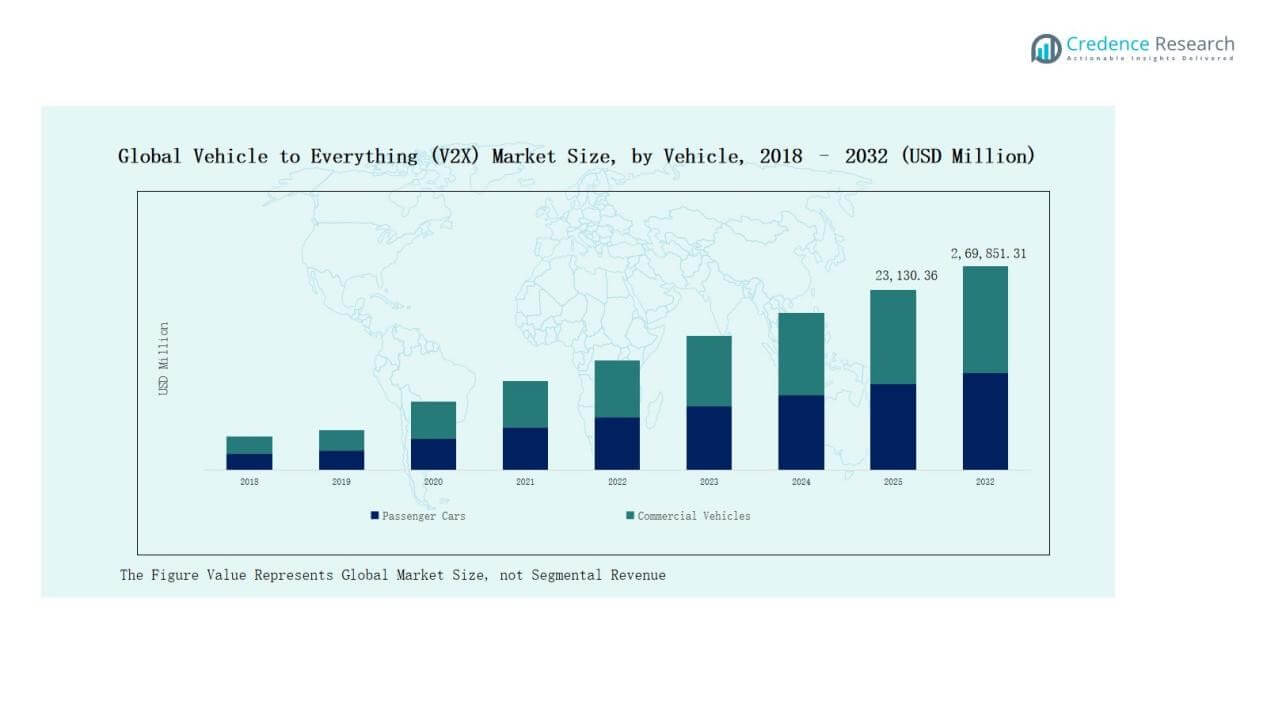
The Vehicle to Everything (V2X) Market size was valued at USD 4,900.00 million in 2018, reached USD 16,369.47 million in 2024, and is anticipated to reach USD 269,851.31 million by 2032, at a CAGR of 42.04% during the forecast period.
| REPORT ATTRIBUTE |
DETAILS |
| Historical Period |
2020-2023 |
| Base Year |
2024 |
| Forecast Period |
2025-2032 |
| Vehicle to Everything (V2X) Market Size 2024 |
USD 16,369.47 Million |
| Vehicle to Everything (V2X) Market, CAGR |
42.04% |
| Vehicle to Everything (V2X) Market Size 2032 |
USD 269,851.31 Million |
The Vehicle to Everything (V2X) Market is driven by leading players such as Continental AG, Aptiv, Qualcomm Technologies, NXP Semiconductors, Robert Bosch GmbH, TomTom International BV, HARMAN International, Mobileye, DENSO Corporation, and Infineon Technologies AG, who focus on advanced connectivity, integration of onboard and roadside units, and partnerships with automakers and telecom providers. These companies strengthen their positions through innovation, regulatory compliance, and large-scale pilot projects supporting intelligent transport systems. Regionally, Asia Pacific dominated the market in 2024 with a 38.4% share, supported by strong 5G rollout, smart city initiatives, and rapid vehicle production.
 Market Insights
- The Vehicle to Everything (V2X) Market grew from USD 4,900.00 million in 2018 to USD 16,369.47 million in 2024, and is forecasted to reach USD 269,851.31 million by 2032 at a CAGR of 04%.
- The Onboard Unit segment dominated by device in 2024 with a 62% share, supported by regulatory mandates, demand for safety features, and integration in passenger and commercial vehicles.
- By communication, Vehicle-to-Vehicle (V2V) led with a 38% share in 2024, driven by accident prevention, ADAS deployment, and government initiatives in intelligent transport systems.
- The Cellular connectivity segment held the largest share at 57% in 2024, supported by widespread 4G LTE availability, rapid 5G expansion, and automaker–telecom partnerships enabling low-latency communication.
- Asia Pacific dominated the market in 2024 with a 38.4% share, fueled by rapid vehicle production, strong 5G rollout, government-led smart city programs, and regional technology collaborations.
Access crucial information at unmatched prices!
Request your sample report today & start making informed decisions powered by Credence Research Inc.!
Download Sample
Market Segment Insights
By Device
The onboard unit segment dominated the V2X market in 2024, holding a 62% revenue share. Growth is driven by rising demand for real-time vehicle communication, safety alerts, and navigation features directly integrated into passenger and commercial vehicles. Automakers are increasingly embedding onboard units to meet regulatory requirements for road safety and autonomous driving readiness. Strong adoption in developed markets, along with government mandates for V2X integration in new vehicle models, further strengthens the segment’s leadership.
For instance, Continental AG has developed V2X onboard units and conducted field trials demonstrating low-latency communication. In a Shanghai trial, the average latency for direct communication between vehicles was 11 milliseconds, and single event messages went as low as 8 milliseconds, ensuring reliable collision warning and traffic signal communication.
By Communication
Vehicle-to-Vehicle (V2V) communication led the market in 2024 with a 38% share, reflecting its vital role in accident prevention and traffic management. V2V enables direct data exchange between vehicles, reducing collision risks and supporting autonomous driving features. Increasing government initiatives promoting intelligent transport systems and rising deployment of advanced driver-assistance systems (ADAS) accelerate adoption. With road safety as a critical driver, V2V remains the backbone of V2X infrastructure, ensuring efficient communication and coordination across connected mobility ecosystems.
For instance, Qualcomm Technologies, in collaboration with partners such as Ford and AT&T, has conducted C-V2X field trials in the San Diego Regional Proving Ground involving connected vehicles, demonstrating critical capabilities like low-latency communications for real-time hazard warnings and cooperative adaptive cruise control.
By Connectivity
The cellular segment emerged as the leading connectivity type in 2024, accounting for 57% of market revenue. Cellular V2X (C-V2X) benefits from widespread 4G LTE coverage and the rapid rollout of 5G networks, offering ultra-low latency and broader communication range. Automotive manufacturers are prioritizing cellular systems to support autonomous driving and smart mobility applications. Strong investments in 5G infrastructure and partnerships between telecom operators and automotive OEMs continue to drive the dominance of cellular connectivity over DSRC solutions.
Key Growth Drivers
Rising Demand for Road Safety and Traffic Management
The increasing need to reduce road accidents and improve traffic efficiency drives V2X adoption. Governments worldwide are mandating connected vehicle technologies to enhance road safety standards. V2X enables real-time communication between vehicles, infrastructure, and pedestrians, minimizing collision risks and congestion. Integration with advanced driver-assistance systems (ADAS) further accelerates deployment. Growing urbanization and vehicle density highlight the urgency of smart mobility solutions, making road safety initiatives one of the strongest contributors to market growth across developed and emerging economies.
For instance, DENSO Corporation has conducted field tests for Vehicle-to-Infrastructure (V2I) communication technology on public roads in Japan’s Aichi Prefecture as part of efforts with government and other companies. The technology is designed to enable real-time communication between vehicles and roadside units, supporting safety alerts for drivers.
Expansion of 5G and Next-Generation Connectivity
The rollout of 5G networks is a major enabler for V2X growth. Unlike DSRC, 5G provides ultra-low latency, higher bandwidth, and seamless long-range communication. These features support applications like autonomous driving, vehicle platooning, and real-time data exchange at scale. Telecom operators and automotive OEMs are actively collaborating to integrate 5G-enabled V2X systems. The increasing global investment in 5G infrastructure strengthens adoption, ensuring robust, reliable communication capabilities and positioning cellular V2X as the preferred connectivity solution across both passenger and commercial vehicles.
For instance, Audi worked with Qualcomm to demonstrate and test the low-latency performance of C-V2X (cellular V2X) technology for cooperative driving use cases in Europe. NXP, a long-term partner of Audi on other V2X initiatives using different wireless standards, also collaborated with Volkswagen to deploy its DSRC-based V2X technology on vehicles in Europe.
Government Regulations and Smart City Initiatives
Government mandates and investments in intelligent transportation systems (ITS) strongly accelerate V2X market adoption. Regulations requiring V2X installation in new vehicles, especially in regions like North America, Europe, and parts of Asia, are reshaping market demand. National and municipal authorities are integrating V2X-enabled roadside units into smart city projects to manage traffic and improve mobility. Subsidies, pilot programs, and partnerships between public agencies and technology providers further promote large-scale deployment. These regulatory and policy-driven initiatives are crucial growth catalysts for the industry.
 Key Trends & Opportunities
Integration with Autonomous Driving Ecosystems
The convergence of V2X with autonomous driving technologies presents significant opportunities. Self-driving cars rely heavily on external communication systems to navigate complex environments safely. V2X enhances vehicle perception by providing data beyond the range of onboard sensors, improving decision-making. As autonomous vehicle trials and commercialization expand, integration with V2X will become essential. This synergy creates opportunities for automakers, technology companies, and infrastructure providers to co-develop advanced mobility ecosystems, paving the way for safer and more efficient transport networks worldwide.
For instance, Mobileye has tested its autonomous vehicle technology in Munich with a fleet of Nio ES8 electric vehicles, which began its pilot phase in 2023. The vehicles utilize a variety of sensors, including cameras, radar, and lidar, to operate in real-world traffic scenarios on German roads.
Emergence of Vehicle-to-Grid (V2G) Applications
The increasing shift toward electric vehicles (EVs) creates opportunities for V2G-based services. V2G enables EVs to communicate with and supply power back to the grid, supporting energy demand management and renewable integration. This feature transforms vehicles into mobile energy storage assets, enhancing grid stability. Governments and utilities are investing in V2G pilots, combining energy and transport sectors through V2X platforms. The rising adoption of EVs globally ensures that V2G applications will play a central role in future V2X market expansion and monetization.
For instance, Nuvve Corporation partnered with San Diego Gas & Electric (SDG&E) on a project using electric school buses for vehicle-to-grid (V2G) technology. The buses, equipped with Nuvve’s GIVe platform, can send energy back to the grid during emergency events, supporting grid stability and allowing school districts to earn revenue.
Key Challenges
High Infrastructure Deployment Costs
The large-scale rollout of V2X requires significant investment in roadside units, communication systems, and network upgrades. Developing countries face financial barriers, limiting adoption outside high-income regions. Even in developed markets, the cost burden for municipalities and automotive manufacturers slows deployment. Without adequate public-private partnerships and funding, infrastructure readiness remains a critical hurdle. These costs hinder rapid scaling and restrict the potential benefits of V2X, delaying its widespread integration into mainstream transportation and smart city projects.
Interoperability and Standardization Issues
V2X deployment faces challenges from a lack of global communication standards. DSRC and cellular V2X technologies often compete, creating fragmentation in the ecosystem. Automakers and technology providers struggle with compatibility across regions, increasing development complexity and costs. Inconsistent regulatory policies across markets add further uncertainty. Without harmonized protocols and universal standards, achieving seamless cross-border V2X communication remains difficult. These interoperability issues limit market scalability and slow progress toward achieving the full potential of connected and cooperative mobility systems.
Cybersecurity and Data Privacy Concerns
As V2X systems enable constant data exchange, cybersecurity threats and privacy concerns emerge as major challenges. Hackers could exploit vulnerabilities to disrupt vehicle communication, cause accidents, or access sensitive personal information. The reliance on cloud platforms and real-time networks increases the attack surface. Ensuring robust encryption, secure communication channels, and compliance with data protection regulations is essential. However, developing cost-effective cybersecurity measures that can scale across millions of vehicles and roadside units presents an ongoing challenge, hindering faster adoption.
Regional Analysis
North America
North America accounted for 29.9% of the global market in 2024, with revenue increasing from USD 1,489.60 million in 2018 to USD 4,904.20 million in 2024, and projected to reach USD 80,713.01 million by 2032, at a CAGR of 42.0%. Growth is driven by government mandates for V2X deployment, strong 5G infrastructure, and the presence of leading automotive and technology companies. The U.S. dominates regional adoption with large-scale smart mobility programs and early integration of V2X systems in connected and autonomous vehicle projects.
Europe
Europe held 22.5% of the global market in 2024, rising from USD 1,156.40 million in 2018 to USD 3,695.78 million in 2024, and is expected to reach USD 57,141.73 million by 2032, at a CAGR of 40.9%. The region benefits from strong regulatory frameworks and investments in intelligent transport systems. Countries such as Germany, France, and the UK are advancing V2X integration through automotive innovation and urban mobility projects. Focus on road safety, emission reduction, and smart city development continues to accelerate V2X deployment across the continent.
Asia Pacific
Asia Pacific dominated the global market with 38.4% share in 2024, increasing from USD 1,832.60 million in 2018 to USD 6,299.72 million in 2024, and projected to reach USD 110,990.06 million by 2032, at the highest CAGR of 43.2%. Rapid vehicle production, strong 5G rollout, and smart city initiatives in China, Japan, South Korea, and India drive regional growth. Governments are heavily investing in V2X-enabled infrastructure to enhance traffic safety and mobility efficiency. The region’s dominance is further supported by technology partnerships between automakers and telecom providers.
Latin America
Latin America captured 5.3% of the global market in 2024, with revenue growing from USD 264.60 million in 2018 to USD 873.97 million in 2024, and forecasted to reach USD 13,187.63 million by 2032, at a CAGR of 40.5%. Brazil and Mexico lead adoption with government-led smart transportation initiatives and rising demand for connected vehicles. Although infrastructure limitations exist, increasing urbanization and investments in cellular connectivity are improving readiness for V2X deployment. Expansion of electric vehicles also supports opportunities for V2G integration across the region.
Middle East
The Middle East represented 1.9% of the global market in 2024, rising from USD 103.88 million in 2018 to USD 307.64 million in 2024, and projected to reach USD 4,130.21 million by 2032, at a CAGR of 38.5%. Gulf Cooperation Council (GCC) countries, particularly the UAE and Saudi Arabia, are leading adoption through smart city programs and advanced transport infrastructure. V2X integration aligns with national visions focused on reducing accidents and enabling autonomous mobility. However, limited regional standardization and high infrastructure costs present challenges to faster market scaling.
Africa
Africa accounted for 2.4% of the global market in 2024, with revenue growing from USD 52.92 million in 2018 to USD 288.17 million in 2024, and expected to reach USD 3,688.67 million by 2032, at a CAGR of 36.7%. South Africa leads adoption with investments in connected mobility and pilot V2X infrastructure projects. Broader regional growth is supported by urban expansion, rising vehicle penetration, and early initiatives in digital transport systems. However, underdeveloped telecom infrastructure and high deployment costs slow large-scale adoption, making Africa the slowest-growing region in the global V2X market.
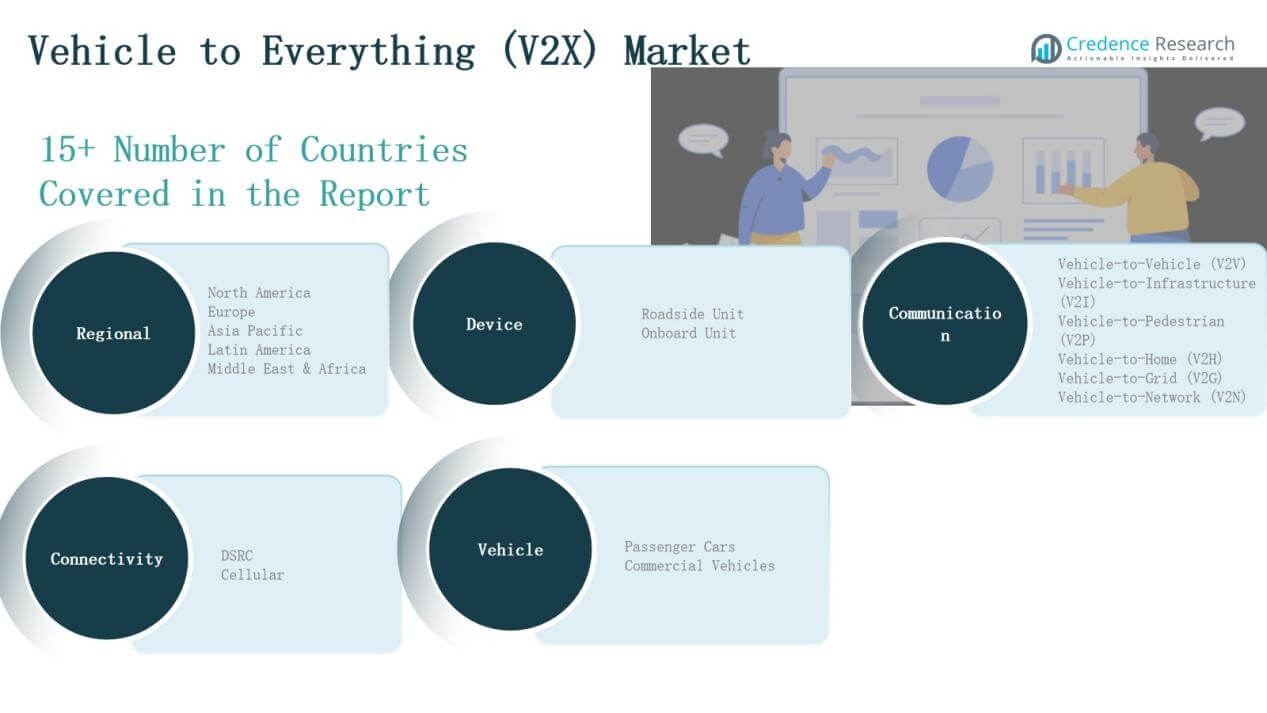
 Market Segmentations:
By Device
- Roadside Unit
- Onboard Unit
By Communication
- Vehicle-to-Vehicle (V2V)
- Vehicle-to-Infrastructure (V2I)
- Vehicle-to-Pedestrian (V2P)
- Vehicle-to-Home (V2H)
- Vehicle-to-Grid (V2G)
- Vehicle-to-Network (V2N)
By Connectivity
- DSRC (Dedicated Short-Range Communication)
- Cellular
By Vehicle
- Passenger Cars
- Commercial Vehicles
By Region
North America
Europe
- UK
- France
- Germany
- Italy
- Spain
- Russia
- Rest of Europe
Asia Pacific
- China
- Japan
- South Korea
- India
- Australia
- Southeast Asia
- Rest of Asia Pacific
Latin America
- Brazil
- Argentina
- Rest of Latin America
Middle East
- GCC Countries
- Israel
- Turkey
- Rest of Middle East
Africa
- South Africa
- Egypt
- Rest of Africa
Competitive Landscape
The Vehicle to Everything (V2X) market is highly competitive, with global technology providers, automotive manufacturers, and semiconductor companies actively driving innovation. Leading players such as Continental AG, Aptiv, Qualcomm Technologies, NXP Semiconductors, Robert Bosch GmbH, and DENSO Corporation dominate through extensive product portfolios and strategic partnerships. These companies focus on integrating onboard units, roadside infrastructure, and advanced connectivity solutions to support large-scale adoption. Collaborations between automakers, telecom operators, and governments accelerate the rollout of 5G-enabled V2X technologies. The market also witnesses strong participation from navigation and software providers such as TomTom International and HARMAN International, which enhance V2X ecosystems through data-driven mobility solutions. Start-ups and niche firms are entering with specialized applications, adding competitive intensity. Continuous investments in R&D, mergers, acquisitions, and pilot deployments shape the competitive environment. Overall, competition is defined by technological leadership, regulatory compliance, and the ability to deliver secure, interoperable, and cost-effective V2X solutions across global markets.
Shape Your Report to Specific Countries or Regions & Enjoy 30% Off!
Key Players
- Continental AG
- Aptiv
- Qualcomm Technologies, Inc.
- NXP Semiconductors
- Robert Bosch GmbH
- TomTom International BV
- HARMAN International
- Mobileye
- DENSO CORPORATION
- Infineon Technologies AG
Recent Developments
- In May 2025, NXP announced its OrangeBox 2.0 development aimed at vehicle networking, supporting connected vehicle and V2X functionalities.
- In April 2025, TomTom announced a partnership to enhance in-vehicle navigation, supplying HD map updates in real time—foundational for V2X/connected mobility use cases.
- In November 2024, Continental announced a collaboration with a semiconductor firm to develop in-vehicle safety sensors, part of its push into V2X and hazard alerts.
- In 2023, Qualcomm incorporated integrated C-V2X and precise positioning support into its next-generation platform portfolio.
Report Coverage
The research report offers an in-depth analysis based on Device, Communication, Connectivity, Vehicle and Region. It details leading market players, providing an overview of their business, product offerings, investments, revenue streams, and key applications. Additionally, the report includes insights into the competitive environment, SWOT analysis, current market trends, as well as the primary drivers and constraints. Furthermore, it discusses various factors that have driven market expansion in recent years. The report also explores market dynamics, regulatory scenarios, and technological advancements that are shaping the industry. It assesses the impact of external factors and global economic changes on market growth. Lastly, it provides strategic recommendations for new entrants and established companies to navigate the complexities of the market.
Future Outlook
- V2X adoption will expand with growing demand for safer and smarter mobility solutions.
- Integration of V2X with autonomous vehicles will accelerate large-scale deployment.
- 5G rollout will strengthen cellular V2X applications across urban and rural networks.
- Governments will increase mandates for V2X-enabled vehicles and infrastructure.
- Smart city projects will create significant opportunities for roadside unit installations.
- Vehicle-to-Grid applications will grow alongside rising electric vehicle penetration.
- Partnerships between automakers and telecom providers will drive technology standardization.
- Advances in cybersecurity solutions will address growing data security concerns.
- Emerging markets will adopt V2X as infrastructure investments improve over time.
- Ecosystem collaboration among OEMs, software firms, and regulators will define market growth.

 Market Insights
 Key Trends & Opportunities
 Market Segmentations:

