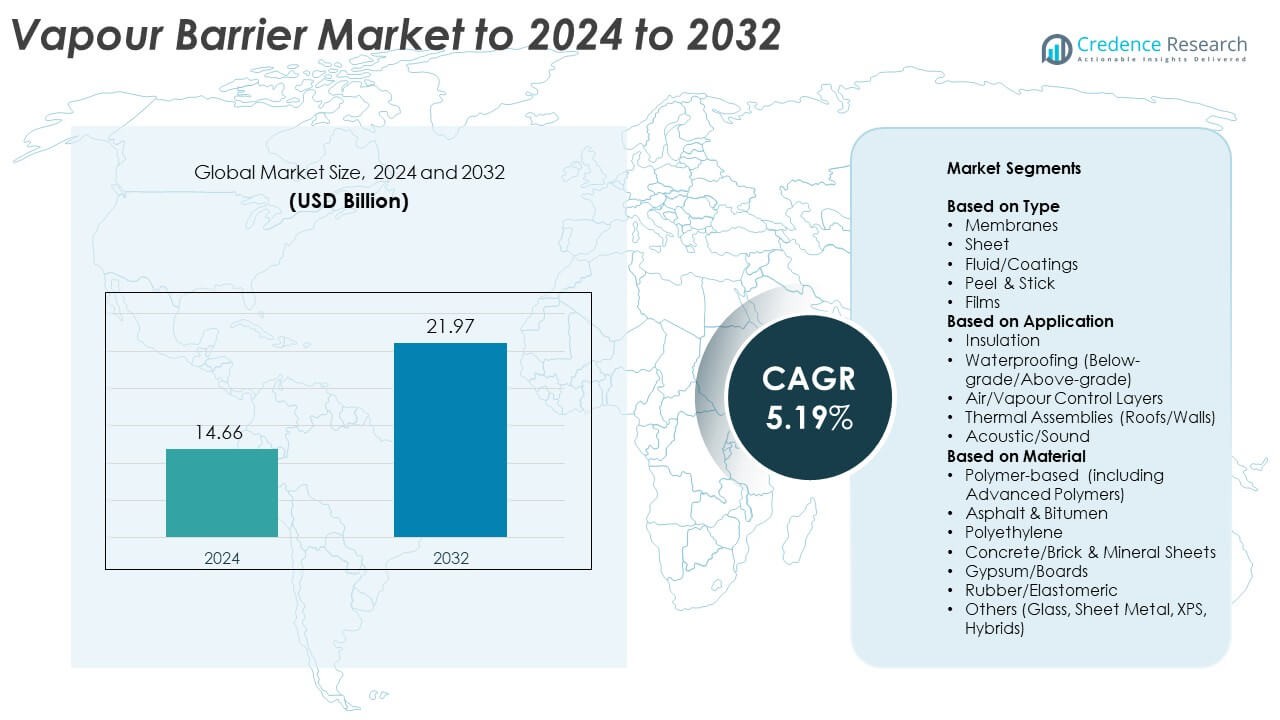
Home » Building & Construction » Vapour Barrier Market

Vapour Barrier Market By Material (Glass, Metal Sheet, Polymers, Others) By Application (Insulation, Water Proofing, Others) By Installation (Membranes, Coatings, Cementitious Waterproofing, Stacking and Filling) By End-use Industry (Construction, Packaging, Automotive, Others)-Growth, Future Prospects & Competitive Analysis, 2016 – 2030

Price: $4999

Published: | Report ID: 18543 | Report Format : PDF

Key Highlights of the Report

The global vapour barrier market is divided into several segments, including material, application, installation, end-use industry, and region. The most common vapour barriers are polymers, whereas membranes and coatings are the two basic installation elements. Moreover, waterproofing is the most widely utilised application, with the residential sub-segment of the construction segment holding the largest share, and North America leading market growth.

Several factors are driving the worldwide vapour barrier market, including a Vapour barriers are required in construction projects as well as in the repair and rehabilitation of existing structures, which are the primary drivers of the market. Additionally, the growing demands for energy-efficient buildings and infrastructure, as well as increased public awareness of the benefits of vapour barriers, are driving market growth. However, there are considerable hurdles in the market, such as customer confusion regarding the benefits of vapour barriers.

Nonetheless, the global vapour barrier market offers significant growth opportunities, including Energy-efficient structures and environmentally friendly building materials.

Market Overview

The global vapour barrier market has witnessed steady growth in recent years and is expected to continue growing at a CAGR of 5.20% between 2023 and 2030. The market was valued at USD 10.9 billion in 2022 and is expected to reach USD 15.5 billion in 2030.

Design Element 2

Access crucial information at unmatched prices!

Request your free sample report today & start making informed decisions powered by Credence Research!

Download Free Sample
CTA Design Element 3

What Are The Main Drivers Of The Global Vapour Barrier Market?

Vapour barriers are necessary in construction projects, as well as in the repair and rehabilitation of existing structures are primary drivers of the market.

What Are The Major Challenges Faced By The Global Vapour Barrier Market?

The worldwide vapour barrier market also confronts various challenges, including customer ignorance about the benefits of vapour barriers.

What Are The Growth Opportunities In The Global Vapour Barrier Market?

The global vapour barrier market offers significant growth opportunities, including energy-efficient structures and environmentally friendly building materials.

Executive Summary

Overview of the Global Vapour Barrier Market

A vapour barrier is typically made of a sheet of plastic that is installed on the warm side of the insulation and prevents moisture from entering the wall. It can be applied to both new and existing constructions. It is also suitable for usage in timber frame buildings. Vapour barriers are not employed to restrict air flow. The ability of vapour barriers to withstand steam dispersion distinguishes them. There are numerous types of vapour barriers used to reduce or assist in reducing vapour intrusion..

Market Definition

A vapour barrier, also known as a vapour retarder, is a form of weather resistant barrier used for damp proofing in walls, foundations, floors, and roofs to prevent interstitial condensation. They are used to keep water vapour from entering or seeping into exposed sections of buildings, so preventing condensation, which can lead to mould, rot, or other types of damage.

Vapour Barrier Market

Market Insights

  • The global demand for vapour barriers was valued at USD 10.9 Billion in 2022 and is expected to reach USD 15.54 Billion in 2030, growing at a CAGR of 5.20% between 2023 and 2030.
  • Polymer sector is expected to account for approximately 25% of the market.
  • In 2022, the waterproofing sector dominated the market with a 15.4% share, also governs the market demand
  • The membranes sheet segment is expected to post the highest CAGR during the forecast period.
  • In 2022, the residential sub-segment of the construction segment held a commanding 45.3% market share.
  • North America is fuelling the growth of the vapour barrier industry with maximum market share in 2022,
  • Asia Pacific holds 20% share of the market.
  • Europe holding over 22% share in the same year.
  • Vapour barriers are necessary in construction projects, as well as in the repair and rehabilitation of existing structures are the major drivers of the market.
  • Moisture becoming trapped within the building shell and installation costs are the main restraints.
  • Energy-efficient structures and environmentally friendly building materials are the major opportunities in the market.

Segmentation by Material

  • Throughout the forecast period, the polymer sector is expected to account for approximately 25% of the market.
  • The metal sheet segment will likely exhibit the fastest CAGR during the forecast period.
  • Glass is another segment, but its contribution to the worldwide vapour barrier market is negligible.

Segmentation by Application

  • In 2022, the waterproofing sector dominated the market with a 15.4% share, also governs the market demand.
  • The insulation segment accounts for the remainder of the demand for vapour barriers.

Segmentation by Installation

  • The membranes will likely exhibit the highest CAGR during the forecast period.
  • The coating category has grown in popularity in recent years due to its improved moisture resistance.
  • Cementitious waterproofing has a low market share.

Segmentation by End-Use Industry

  • In 2022, the residential sub-segment of the construction segment held a commanding 45.3% market share.
  • The Automotive segment is leading the market share with over 30% share in 2022.
  • The packaging industry segment has a low market demand.

Segmentation by Region

  • North America is fuelling the growth of the vapour barrier industry with maximum market share in 2022.
  • Asia Pacific holds 20% share of the market.
  • Europe holding over 22% share in the same year.
  • The rest of the World, including Latin America, The Middle East, and Africa, contributes the remainder to the demand for vapour barriers.

Vapour barriers are necessary in construction projects, as well as in the repair and rehabilitation of existing structures. The market, however, is hampered by moisture becoming trapped within the building shell and installation expenses.

With a 25.1% market share in 2022, the United States dominated the vapour barrier industry. In the United States, it is anticipated that sales of vapour barriers will increase at a 4.6% annual rate. The country’s market demand outlook has been strengthened by rapid growth in the end-use sector. The expansion of end-use sectors like the construction of buildings is a key factor in the vapour barrier market’s growth. There has been significant recent expansion in the building and construction sector in the United States. For the duration of the forecast period, the growth prospects are anticipated to stay favourable. New VOC emission restrictions must be incorporated into the vapour barrier’s ongoing updates.

The Indian government’s significant investment in the infrastructure sector is also anticipated to fuel the market’s expansion. The construction of residential homes and buildings is being aided by the middle class’s rising spending power, which is projected to enhance demand for insulating materials.

The market for vapour barriers in China is anticipated to increase at a CAGR of 6% from 2022 to 2030 as a result of the robust growth in the construction industry and vehicle sales. Sales of vapour barriers are increasing due to the country’s increasing use of water prevention in floors and walls to keep surfaces dry. During the assessment period, China is predicted to generate an additional market opportunity worth US$ 387.90 million. The product is being consumed at a significant rate due to the application segments’ strong presence.

Overall, the increasing demand for vapour barriers can be attributed to the Vapour barriers are necessary in construction projects, as well as in the repair and rehabilitation of existing structures

Vapour Barrier Technology Advancement

Vapour barrier materials are becoming more effective and easier to install as technology advances. Self-adhesive membranes, permeable vapour barriers, reinforced vapour barriers, vapour barriers with antimicrobial properties, and vapour barriers with reflecting qualities are among the developments. These innovations increase vapour barrier performance, durability, and energy efficiency.

Vapour Barriers Are Required In Construction Projects 

An air barrier/vapor retarder tries to restrict both water vapour dispersion and air movement with a single material. This sort of material is best suited for southern areas where keeping humid external air out of building cavities during the cooling season is crucial.

Water-resistant barriers are typically installed around the perimeter of a building, just beneath the exterior finish, or they may be the exterior finish itself. The key to having them work properly is to permanently and meticulously seal all seams and penetrations, including those around windows, doors, electrical outlets, plumbing stacks, and vent fans.

Missed gaps of any size increase not only energy consumption, but also the risk of moisture damage to the property, especially during the cooling season. After installation, a water-resistant barrier should be thoroughly evaluated before being covered by other work. If minor holes are discovered, they can be filled with caulk, polythene, or foil tape. Larger holes or tears should be repaired or replaced. Patches should always be large enough to cover the damage while also overlapping any surrounding wood frame.

Increasing Existing Structure Repair And Rehabilitation

Despite market adversity, the building industry has established stability. Private construction investments are expanding in the current environment. While construction spending is significant, material costs have risen even more. Construction initiatives in private workplaces around the world are likely to stimulate consistent demand for building materials, especially insulation products.

With a sizable scope of demand generated by residential and commercial building construction, total expenditure, repair, and rehabilitation are likely to account for a significant share of overall numbers. More than half of all construction workers, both commercial and institutional, are expected to spend their energies in green buildings in the next years, driving the global market for vapour barriers.

Moisture Becoming Trapped Within The Building Envelope

One of the main drawbacks of vapour barriers is the possibility of moisture becoming trapped within the building envelope, resulting in mould growth and other problems. If a vapour barrier is not correctly built or is incompatible with the other elements in the building envelope, moisture can be trapped inside the walls or roof. This can result in mould growth, wood rot, and other concerns that might jeopardise the building’s structural integrity and pose health dangers to occupants. To avoid these issues, it is critical to select the proper type of vapour barrier and ensure that it is properly placed.

High Cost Of Installation

The expense of installation is another limitation of vapour barriers. The installation process is time-consuming and labor-intensive, raising the project’s overall cost. Furthermore, certain vapour barriers necessitate specialised equipment or experience to install correctly, which can add to the expense. As a result, vapour barriers may be less appealing to builders and homeowners looking for cost-effective alternatives.

Energy-Efficient Structures

The growing need for energy-efficient buildings represents one opportunity for the vapour barrier sector. As people become more aware of the environmental impact of buildings, they are seeking for ways to cut their energy consumption. Vapour barriers can play a major part in this by reducing heat loss and improving insulation. Furthermore, vapour barriers can aid in the prevention of moisture damage, which can result in costly repairs and decreased energy efficiency. As a result, the market for vapour barriers is expanding as individuals seek ways to increase the energy efficiency of their homes and buildings.

Green Building Materials

Green building materials are becoming increasingly popular. More people become aware of the environmental impact of construction and building materials, there is an increasing demand for environmentally friendly and sustainable products. Vapour barriers can be constructed from a range of materials, including recycled and renewable resources, making them an appealing alternative for people looking for environmentally friendly building materials. Furthermore, vapour barriers can help to increase building energy efficiency, which can contribute to their sustainability.

Competitive Landscape

Key Players

The global vapour barrier market is highly competitive, with the presence of several key players. Some of the major players in the market and their market share are as follows:

  • Carlisle Companies Inc.
  • W.R. Meadows, Inc.
  • 3M Company
  • DuPont de Nemours Inc.
  • Stego Industries, LLC
  • RPM International Inc.
  • BASF SE
  • RIMA International
  • Reflectix, Inc.
  • Reef Industries Inc.
  • UFP Industries Inc.
  • BMI Icopal
  • Layfield Grioup Ltd.
  • Visqueen Building Product
  • Others

To stay competitive, these businesses prioritise product innovation, distribution channel expansion, and mergers and acquisitions. The key players in the worldwide vapour barrier market are continuously seeking to stay ahead of the competition by offering new products and technologies.

GAF introduced a new line of polyiso insulation and vapour barrier products in 2019 to improve the energy efficiency of commercial buildings.

In 2020, Johns Manville will introduce its new Formaldehyde-freeTM insulation and vapour barrier products. The new goods are comprised of recycled materials and are intended to improve indoor air quality.

DuPont announced the launch of its Tyvek® Fluid Applied WB+TM system in 2021, a vapour barrier solution that offers better durability and decreased air leakage for commercial and residential construction projects.

Shape Your Report to Specific Countries or Regions & Enjoy 30% Off!

Summary of Key Findings

  • Vapour barriers are necessary in construction projects, as well as in the repair and rehabilitation of existing structures driving market growth
  • Market segmented by material, application, distribution channel, and region.
  • The most common vapour barriers are polymers, whereas membranes and coatings are the two basic installation elements
  • Waterproofing is the most widely utilised application, with the residential sub-segment of the construction segment holding the largest share
  • North America is leading market growth; the market is highly competitive with key players including Carlisle Companies Inc., W.R. Meadows, Inc. and 3M Company.

Future Outlook

  • Rising need for energy-efficient buildings and infrastructure as well as, increasing public understanding of the advantages of vapour barriers
  • Advances in vapour barrier materials technology
  • Strict construction codes and regulations
  • Expansion of the building industry
  • Challenges from the Consumers are unaware of the advantages of vapour barriers.

Segmentation

  • By Material
    • Glass
    • Metal Sheet
    • Polymers
    • Others
  • By Application
    • Insulation
    • Water Proofing
    • Others
  • By Installation
    • Membranes
    • Coatings
    • Cementitious Waterproofing
    • Stacking and Filling
  • By End-use Industry
    • Construction
    • Packaging
    • Automotive
    • Others
  • By Region
  • North America
    • U.S
    • Canada
    • Mexico
  • Europe
    • Germany
    • France
    • U.K.
    • Italy
    • Spain
    • Rest of Europe
  • Asia Pacific
    • China
    • Japan
    • India
    • South Korea
    • South-east Asia
    • Rest of Asia Pacific
  • Latin America
    • Brazil
    • Argentina
    • Rest of Latin America
  • Middle East & Africa
    • GCC Countries
    • South Africa
    • Rest of Middle East and Africa

1. Preface
1.1. Report Description
1.1.1. Purpose of the Report
1.1.2. Target Audience
1.1.3. USP and Key Offerings
1.2. Research Scope
1.3. Research Methodology
1.3.1. Phase I – Secondary Research
1.3.2. Phase II – Data Modelling
1.3.2.1. Company Share Analysis Model
1.3.2.2. Revenue Based Modelling
1.3.3. Phase III – Primary Research
1.3.4. Research Limitations
1.3.5. Assumptions
1.4. Market Introduction
1.5. Market Research Scope

2. Executive Summary
2.1. Market Snapshot: Global Vapour Barrier Market
2.2. Global Vapour Barrier Market, By Material
2.3. Global Vapour Barrier Market, By Application
2.4. Global Vapour Barrier Market, By Installation
2.5. Global Vapour Barrier Market, By End-Use Industry
2.6. Global Vapour Barrier Market, By Region

3. Market Dynamics & Factors Analysis
3.1. Introduction
3.1.1. Global Vapour Barrier Market Value, 2017-2030, (US$ Bn)
3.1.2. Global Vapour Barrier Market Volume, 2017-2030, (Billion Units)
3.1.3. Y-o-Y Growth Trend Analysis
3.2. Market Dynamics
3.2.1. Market Drivers
3.2.1.1. Driver 1
3.2.1.2. Driver 2
3.2.1.3. Driver 3
3.2.2. Market Restraints
3.2.2.1. Restraint 1
3.2.2.2. Restraint 2
3.2.3. Market Opportunities
3.2.3.1. Opportunity 1
3.2.3.2. Opportunity 2
3.2.4. Major Industry Challenges
3.2.4.1. Challenge 1
3.2.4.2. Challenge 2
3.3. Growth and Development Patterns
3.4. Investment Feasibility Analysis
3.5. Market Opportunity Analysis
3.5.1. Material
3.5.2. Application
3.5.3. Installation
3.5.4. Geography

4. Premium Insights
4.1. STAR (Situation, Task, Action, Results) Analysis
4.2. Porter’s Five Forces Analysis
4.2.1. Threat of New Entrants
4.2.2. Bargaining Power of Buyers/Consumers
4.2.3. Bargaining Power of Suppliers
4.2.4. Threat of Substitute Types
4.2.5. Intensity of Competitive Rivalry
4.3. Key Market Trends
4.3.1. Demand Side Trends
4.3.2. Supply Side Trends
4.4. Value Chain Analysis
4.5. Material Analysis
4.6. Analysis and Recommendations
4.7. Marketing Strategy Analysis
4.7.1. Installation Marketing
4.7.2. Indirect Marketing
4.7.3. Marketing Channel Development Trend

5. Import Export Analysis
5.1. Import Analysis by Region
5.1.1. Global Vapour Barrier Market Import Volume, By Region, 2017-2022 (Billion Units)
5.2. Export Analysis by Region
5.2.1. Global Vapour Barrier Market Export Volume, By Region, 2017-2022 (Billion Units)

6. Demand-Supply Analysis
6.1. Demand Analysis by Region
6.1.1. Global Vapour Barrier Market Demand Volume, By Region, 2017-2022 (Billion Units)
6.2. Supply Analysis by Region
6.2.1. Global Vapour Barrier Market Supply Volume, By Region, 2017-2022 (Billion Units)

7. Pricing Analysis
7.1. Average Price of Vapour Barriers by Region, 2017-2022 (USD/Unit)
7.2. Average Price of Vapour Barriers by Region, 2023-2030 (USD/Unit)

8. Market Positioning of Key Players, 2022
8.1. Company market share of key players, 2022
8.2. Competitive Benchmarking
8.3. Market Positioning of Key Vendors
8.4. Geographical Presence Analysis
8.5. Major Strategies Adopted by Key Players
8.5.1. Key Strategies Analysis
8.5.2. Mergers and Acquisitions
8.5.3. Partnerships
8.5.4. Product Launch
8.5.5. Geographical Expansion
8.5.6. Others

9. Economic Impact Analysis
9.1. Recession Impact
9.1.1. North America
9.1.2. Europe
9.1.3. Asia Pacific
9.1.4. Latin America
9.1.5. Middle East and Africa
9.2. Ukraine-Russia War Impact
9.2.1. North America
9.2.2. Europe
9.2.3. Asia Pacific
9.2.4. Latin America
9.2.5. Middle East and Africa
9.3. COVID-19 Impact Analysis
9.3.1. North America
9.3.2. Europe
9.3.3. Asia Pacific
9.3.4. Latin America
9.3.5. Middle East and Africa

10. Global Vapour Barrier Market, By Material
10.1. Global Vapour Barrier Market Overview, by Material
10.1.1. Global Vapour Barrier Market Revenue Share, By Material, 2022 Vs 2030 (in %)
10.1.2. Global Vapour Barrier Market Volume Share, By Material, 2022 Vs 2030 (in %)
10.2. Glass
10.2.1. Global Vapour Barrier Market, By Region, 2017-2030 (US$ Bn)
10.2.2. Global Vapour Barrier Market, By Region, 2017-2030 (Billion Units)
10.3. Metal Sheet
10.3.1. Global Vapour Barrier Market, By Region, 2017-2030 (US$ Bn)
10.3.2. Global Vapour Barrier Market, By Region, 2017-2030 (Billion Units)
10.4. Polymers
10.4.1. Global Vapour Barrier Market, By Region, 2017-2030 (US$ Bn)
10.4.2. Global Vapour Barrier Market, By Region, 2017-2030 (Billion Units)
10.5. Others
10.5.1. Global Vapour Barrier Market, By Region, 2017-2030 (US$ Bn)
10.5.2. Global Vapour Barrier Market, By Region, 2017-2030 (Billion Units)

11. Global Vapour Barrier Market, By Application
11.1. Global Vapour Barrier Market Overview, by Application
11.1.1. Global Vapour Barrier Market, By Application, 2022 vs 2030 (in %)
11.2. Installation
11.2.1. Global Vapour Barrier Market, By Region, 2017-2030 (US$ Bn)
11.2.2. Global Vapour Barrier Market, By Region, 2017-2030 (Billion Units)
11.3. Water Proofing
11.3.1. Global Vapour Barrier Market, By Region, 2017-2030 (US$ Bn)
11.3.2. Global Vapour Barrier Market, By Region, 2017-2030 (Billion Units)
11.4. Others
11.4.1. Global Vapour Barrier Market, By Region, 2017-2030 (US$ Bn)
11.4.2. Global Vapour Barrier Market, By Region, 2017-2030 (Billion Units)

12. Global Vapour Barrier Market, by Installation, 2017-2030 (US$ Bn)
12.1. Global Vapour Barrier Market Overview, by Installation
12.1.1. Global Vapour Barrier Market, By Installation, 2022 vs 2030 (in%)
12.2. Membranes
12.2.1. Global Vapour Barrier Market, By Region, 2017-2030 (US$ Bn)
12.2.2. Global Vapour Barrier Market, By Region, 2017-2030 (Billion Units)
12.3. Coatings
12.3.1. Global Vapour Barrier Market, By Region, 2017-2030 (US$ Bn)
12.3.2. Global Vapour Barrier Market, By Region, 2017-2030 (Billion Units)
12.4. Cementitious Waterproofing
12.4.1. Global Vapour Barrier Market, By Region, 2017-2030 (US$ Bn)
12.4.2. Global Vapour Barrier Market, By Region, 2017-2030 (Billion Units)
12.5. Stacking and Filling
12.5.1. Global Vapour Barrier Market, By Region, 2017-2030 (US$ Bn)
12.5.2. Global Vapour Barrier Market, By Region, 2017-2030 (Billion Units)

13. Global Vapour Barrier Market, by End-Use Industry, 2017-2030 (US$ Bn)
13.1. Global Vapour Barrier Market Overview, by End-Use Industry
13.1.1. Global Vapour Barrier Market, By End-Use Industry, 2022 vs 2030 (in%)
13.2. Construction
13.2.1. Global Vapour Barrier Market, By Region, 2017-2030 (US$ Bn)
13.2.2. Global Vapour Barrier Market, By Region, 2017-2030 (Billion Units)
13.3. Packaging
13.3.1. Global Vapour Barrier Market, By Region, 2017-2030 (US$ Bn)
13.3.2. Global Vapour Barrier Market, By Region, 2017-2030 (Billion Units)
13.4. Automotive
13.4.1. Global Vapour Barrier Market, By Region, 2017-2030 (US$ Bn)
13.4.2. Global Vapour Barrier Market, By Region, 2017-2030 (Billion Units)
13.5. Others
13.5.1. Global Vapour Barrier Market, By Region, 2017-2030 (US$ Bn)
13.5.2. Global Vapour Barrier Market, By Region, 2017-2030 (Billion Units)

14. Global Vapour Barrier Market, By Region
14.1. Global Vapour Barrier Market Overview, by Region
14.1.1. Global Vapour Barrier Market Revenue, By Region, 2022 vs 2030 (in%)
14.1.2. Global Vapour Barrier Market Volume, By Region, 2022 vs 2030 (in%)
14.2. Material
14.2.1. Global Vapour Barrier Market, By Material, 2017-2030 (US$ Bn)
14.2.2. Global Vapour Barrier Market, By Material, 2017-2030 (Billion Units)
14.3. Application
14.3.1. Global Vapour Barrier Market, By Application, 2017-2030 (US$ Bn)
14.3.2. Global Vapour Barrier Market, By Application, 2017-2030 (Billion Units)
14.4. Installation
14.4.1. Global Vapour Barrier Market, By Installation, 2017-2030 (US$ Bn)
14.4.2. Global Vapour Barrier Market, By Installation, 2017-2030 (Billion Units)
14.5. End-Use Installation
14.5.1. Global Vapour Barrier Market, By End-Use Installation, 2017-2030 (US$ Bn)
14.5.2. Global Vapour Barrier Market, By End-Use Installation, 2017-2030 (Billion Units)

15. North America Vapour Barrier Market Analysis
15.1. North America Vapour Barrier Market, by Material, 2017-2030(US$ Bn)
15.1.1. Overview
15.1.2. SRC Analysis
15.2. North America Vapour Barrier Market, by Material, 2017-2030(Billion Units)
15.2.1. Overview
15.2.2. SRC Analysis
15.3. North America Vapour Barrier Market, by Application, 2017-2030(US$ Bn)
15.3.1. Overview
15.3.2. SRC Analysis
15.4. North America Vapour Barrier Market, by Application, 2017-2030(Billion Units)
15.4.1. Overview
15.4.2. SRC Analysis
15.5. North America Vapour Barrier Market, by Installation, 2017-2030(US$ Bn)
15.5.1. Overview
15.5.2. SRC Analysis
15.6. North America Vapour Barrier Market, by Installation, 2017-2030(Billion Units)
15.6.1. Overview
15.6.2. SRC Analysis
15.7. North America Vapour Barrier Market, by End-Use Industry, 2017-2030(US$ Bn)
15.7.1. Overview
15.7.2. SRC Analysis
15.8. North America Vapour Barrier Market, by End-Use Industry, 2017-2030(Billion Units)
15.8.1. Overview
15.8.2. SRC Analysis
15.9. North America Vapour Barrier Market, by Country, 2017-2030 (US$ Bn)
15.9.1. North America Vapour Barrier Market Revenue, by Country, 2022 Vs 2030 (in%)
15.9.2. North America Vapour Barrier Market Volume, by Country, 2022 Vs 2030 (in%)
15.9.3. U.S.
15.9.3.1. U.S. Vapour Barrier Market Estimates and Forecast, 2017-2030 (US$ Bn)
15.9.3.2. U.S. Vapour Barrier Market Estimates and Forecast, 2017-2030 (Billion Units)
15.9.3.3. U.S. Vapour Barrier, By Material, 2017-2030 (US$ Bn)
15.9.3.4. U.S. Vapour Barrier, By Material, 2017-2030 (Billion Units)
15.9.3.5. U.S. Vapour Barrier, By Application, 2017-2030 (US$ Bn)
15.9.3.6. U.S. Vapour Barrier, By Application, 2017-2030 (Billion Units)
15.9.3.7. U.S. Vapour Barrier, By Installation, 2017-2030 (US$ Bn)
15.9.3.8. U.S. Vapour Barrier, By Installation, 2017-2030 (Billion Units)
15.9.3.9. U.S. Vapour Barrier, By End-Use Industry, 2017-2030 (US$ Bn)
15.9.3.10. U.S. Vapour Barrier, By End-Use Industry, 2017-2030 (Billion Units)
15.9.4. Canada
15.9.4.1. Canada Vapour Barrier Market Estimates and Forecast, 2017-2030 (US$ Bn)
15.9.4.2. Canada Vapour Barrier Market Estimates and Forecast, 2017-2030 (Billion Units)
15.9.4.3. Canada Vapour Barrier, By Material, 2017-2030 (US$ Bn)
15.9.4.4. Canada Vapour Barrier, By Material, 2017-2030 (Billion Units)
15.9.4.5. Canada Vapour Barrier, By Application, 2017-2030 (US$ Bn)
15.9.4.6. Canada Vapour Barrier, By Application, 2017-2030 (Billion Units)
15.9.4.7. Canada Vapour Barrier, By Installation, 2017-2030 (US$ Bn)
15.9.4.8. Canada Vapour Barrier, By Installation, 2017-2030 (Billion Units)
15.9.4.9. Canada Vapour Barrier, By End-Use Industry, 2017-2030 (US$ Bn)
15.9.4.10. Canada Vapour Barrier, By End-Use Industry, 2017-2030 (Billion Units)
15.9.5. Mexico
15.9.5.1. Mexico Vapour Barrier Market Estimates and Forecast, 2017-2030 (US$ Bn)
15.9.5.2. Mexico Vapour Barrier Market Estimates and Forecast, 2017-2030 (Billion Units)
15.9.5.3. Mexico Vapour Barrier, By Material, 2017-2030 (US$ Bn)
15.9.5.4. Mexico Vapour Barrier, By Material, 2017-2030 (Billion Units)
15.9.5.5. Mexico Vapour Barrier, By Application, 2017-2030 (US$ Bn)
15.9.5.6. Mexico Vapour Barrier, By Application, 2017-2030 (Billion Units)
15.9.5.7. Mexico Vapour Barrier, By Installation, 2017-2030 (US$ Bn)
15.9.5.8. Mexico Vapour Barrier, By Installation, 2017-2030 (Billion Units)
15.9.5.9. Mexico Vapour Barrier, By End-Use Industry, 2017-2030 (US$ Bn)
15.9.5.10. Mexico Vapour Barrier, By End-Use Industry, 2017-2030 (Billion Units)

16. Europe Vapour Barrier Market Analysis
16.1. Europe Vapour Barrier Market, by Material, 2017-2030(US$ Bn)
16.1.1. Overview
16.1.2. SRC Analysis
16.2. Europe Vapour Barrier Market, by Material, 2017-2030(Billion Units)
16.2.1. Overview
16.2.2. SRC Analysis
16.3. Europe Vapour Barrier Market, by Application, 2017-2030(US$ Bn)
16.3.1. Overview
16.3.2. SRC Analysis
16.4. Europe Vapour Barrier Market, by Application, 2017-2030(Billion Units)
16.4.1. Overview
16.4.2. SRC Analysis
16.5. Europe Vapour Barrier Market, by Installation, 2017-2030(US$ Bn)
16.5.1. Overview
16.5.2. SRC Analysis
16.6. Europe Vapour Barrier Market, by Installation, 2017-2030(Billion Units)
16.6.1. Overview
16.6.2. SRC Analysis
16.7. Europe Vapour Barrier Market, by End-Use Industry, 2017-2030(US$ Bn)
16.7.1. Overview
16.7.2. SRC Analysis
16.8. Europe Vapour Barrier Market, by End-Use Industry, 2017-2030(Billion Units)
16.8.1. Overview
16.8.2. SRC Analysis
16.9. Europe Vapour Barrier Market, by Country, 2017-2030 (US$ Bn)
16.9.1. Europe Vapour Barrier Market Revenue, by Country, 2022 Vs 2030 (in%)
16.9.2. Europe Vapour Barrier Market Volume, by Country, 2022 Vs 2030 (in%)
16.9.3. Germany
16.9.3.1. Germany Vapour Barrier Market Estimates and Forecast, 2017-2030 (US$ Bn)
16.9.3.2. Germany Vapour Barrier Market Estimates and Forecast, 2017-2030 (Billion Units)
16.9.3.3. Germany Vapour Barrier, By Material, 2017-2030 (US$ Bn)
16.9.3.4. Germany Vapour Barrier, By Material, 2017-2030 (Billion Units)
16.9.3.5. Germany Vapour Barrier, By Application, 2017-2030 (US$ Bn)
16.9.3.6. Germany Vapour Barrier, By Application, 2017-2030 (Billion Units)
16.9.3.7. Germany Vapour Barrier, By Installation, 2017-2030 (US$ Bn)
16.9.3.8. Germany Vapour Barrier, By Installation, 2017-2030 (Billion Units)
16.9.3.9. Germany Vapour Barrier, By End-Use Industry, 2017-2030 (US$ Bn)
16.9.3.10. Germany Vapour Barrier, By End-Use Industry, 2017-2030 (Billion Units)
16.9.4. France
16.9.4.1. France Vapour Barrier Market Estimates and Forecast, 2017-2030 (US$ Bn)
16.9.4.2. France Vapour Barrier Market Estimates and Forecast, 2017-2030 (Billion Units)
16.9.4.3. France Vapour Barrier, By Material, 2017-2030 (US$ Bn)
16.9.4.4. France Vapour Barrier, By Material, 2017-2030 (Billion Units)
16.9.4.5. France Vapour Barrier, By Application, 2017-2030 (US$ Bn)
16.9.4.6. France Vapour Barrier, By Application, 2017-2030 (Billion Units)
16.9.4.7. France Vapour Barrier, By Installation, 2017-2030 (US$ Bn)
16.9.4.8. France Vapour Barrier, By Installation, 2017-2030 (Billion Units)
16.9.4.9. France Vapour Barrier, By End-Use Industry, 2017-2030 (US$ Bn)
16.9.4.10. France Vapour Barrier, By End-Use Industry, 2017-2030 (Billion Units)
16.9.5. U.K.
16.9.5.1. U.K. Vapour Barrier Market Estimates and Forecast, 2017-2030 (US$ Bn)
16.9.5.2. U.K. Vapour Barrier Market Estimates and Forecast, 2017-2030 (Billion Units)
16.9.5.3. U.K. Vapour Barrier, By Material, 2017-2030 (US$ Bn)
16.9.5.4. U.K. Vapour Barrier, By Material, 2017-2030 (Billion Units)
16.9.5.5. U.K. Vapour Barrier, By Application, 2017-2030 (US$ Bn)
16.9.5.6. U.K. Vapour Barrier, By Application, 2017-2030 (Billion Units)
16.9.5.7. U.K. Vapour Barrier, By Installation, 2017-2030 (US$ Bn)
16.9.5.8. U.K. Vapour Barrier, By Installation, 2017-2030 (Billion Units)
16.9.5.9. U.K. Vapour Barrier, By End-Use Industry, 2017-2030 (US$ Bn)
16.9.5.10. U.K. Vapour Barrier, By End-Use Industry, 2017-2030 (Billion Units)
16.9.6. Italy
16.9.6.1. Italy Vapour Barrier Market Estimates and Forecast, 2017-2030 (US$ Bn)
16.9.6.2. Italy Vapour Barrier Market Estimates and Forecast, 2017-2030 (Billion Units)
16.9.6.3. Italy Vapour Barrier, By Material, 2017-2030 (US$ Bn)
16.9.6.4. Italy Vapour Barrier, By Material, 2017-2030 (Billion Units)
16.9.6.5. Italy Vapour Barrier, By Application, 2017-2030 (US$ Bn)
16.9.6.6. Italy Vapour Barrier, By Application, 2017-2030 (Billion Units)
16.9.6.7. Italy Vapour Barrier, By Installation, 2017-2030 (US$ Bn)
16.9.6.8. Italy Vapour Barrier, By Installation, 2017-2030 (Billion Units)
16.9.6.9. Italy Vapour Barrier, By End-Use Industry, 2017-2030 (US$ Bn)
16.9.6.10. Italy Vapour Barrier, By End-Use Industry, 2017-2030 (Billion Units)
16.9.7. Spain
16.9.7.1. Spain Vapour Barrier Market Estimates and Forecast, 2017-2030 (US$ Bn)
16.9.7.2. Spain Vapour Barrier Market Estimates and Forecast, 2017-2030 (Billion Units)
16.9.7.3. Spain Vapour Barrier, By Material, 2017-2030 (US$ Bn)
16.9.7.4. Spain Vapour Barrier, By Material, 2017-2030 (Billion Units)
16.9.7.5. Spain Vapour Barrier, By Application, 2017-2030 (US$ Bn)
16.9.7.6. Spain Vapour Barrier, By Application, 2017-2030 (Billion Units)
16.9.7.7. Spain Vapour Barrier, By Installation, 2017-2030 (US$ Bn)
16.9.7.8. Spain Vapour Barrier, By Installation, 2017-2030 (Billion Units)
16.9.7.9. Spain Vapour Barrier, By End-Use Industry, 2017-2030 (US$ Bn)
16.9.7.10. Spain Vapour Barrier, By End-Use Industry, 2017-2030 (Billion Units)
16.9.8. Rest of Europe
16.9.8.1. Rest of Europe Vapour Barrier Market Estimates and Forecast, 2017-2030 (US$ Bn)
16.9.8.2. Rest of Europe Vapour Barrier Market Estimates and Forecast, 2017-2030 (Billion Units)
16.9.8.3. Rest of Europe Vapour Barrier, By Material, 2017-2030 (US$ Bn)
16.9.8.4. Rest of Europe Vapour Barrier, By Material, 2017-2030 (Billion Units)
16.9.8.5. Rest of Europe Vapour Barrier, By Application, 2017-2030 (US$ Bn)
16.9.8.6. Rest of Europe Vapour Barrier, By Application, 2017-2030 (Billion Units)
16.9.8.7. Rest of Europe Vapour Barrier, By Installation, 2017-2030 (US$ Bn)
16.9.8.8. Rest of Europe Vapour Barrier, By Installation, 2017-2030 (Billion Units)
16.9.8.9. Rest of Europe Vapour Barrier, By End-Use Industry, 2017-2030 (US$ Bn)
16.9.8.10. Rest of Europe Vapour Barrier, By End-Use Industry, 2017-2030 (Billion Units)

17. Asia Pacific Vapour Barrier Market Analysis
17.1. Asia Pacific Vapour Barrier Market, by Material, 2017-2030(US$ Bn)
17.1.1. Overview
17.1.2. SRC Analysis
17.2. Asia Pacific Vapour Barrier Market, by Material, 2017-2030(Billion Units)
17.2.1. Overview
17.2.2. SRC Analysis
17.3. Asia Pacific Vapour Barrier Market, by Application, 2017-2030(US$ Bn)
17.3.1. Overview
17.3.2. SRC Analysis
17.4. Asia Pacific Vapour Barrier Market, by Application, 2017-2030(Billion Units)
17.4.1. Overview
17.4.2. SRC Analysis
17.5. Asia Pacific Vapour Barrier Market, by Installation, 2017-2030(US$ Bn)
17.5.1. Overview
17.5.2. SRC Analysis
17.6. Asia Pacific Vapour Barrier Market, by End-Use Industry, 2017-2030(US$ Bn)
17.6.1. Overview
17.6.2. SRC Analysis
17.7. Asia Pacific Vapour Barrier Market, by End-Use Industry, 2017-2030(Billion Units)
17.7.1. Overview
17.7.2. SRC Analysis
17.8. Asia Pacific Vapour Barrier Market, by Country, 2017-2030 (US$ Bn)
17.8.1. Asia Pacific Vapour Barrier Market Revenue, by Country, 2022 Vs 2030 (in%)
17.8.2. Asia Pacific Vapour Barrier Market Volume, by Country, 2022 Vs 2030 (in%)
17.8.3. China
17.8.3.1. China Vapour Barrier Market Estimates and Forecast, 2017-2030 (US$ Bn)
17.8.3.2. China Vapour Barrier Market Estimates and Forecast, 2017-2030 (Billion Units)
17.8.3.3. China Vapour Barrier, By Material, 2017-2030 (US$ Bn)
17.8.3.4. China Vapour Barrier, By Material, 2017-2030 (Billion Units)
17.8.3.5. China Vapour Barrier, By Application, 2017-2030 (US$ Bn)
17.8.3.6. China Vapour Barrier, By Application, 2017-2030 (Billion Units)
17.8.3.7. China Vapour Barrier, By Installation, 2017-2030 (US$ Bn)
17.8.3.8. China Vapour Barrier, By Installation, 2017-2030 (Billion Units)
17.8.3.9. China Vapour Barrier, By End-Use Industry, 2017-2030 (US$ Bn)
17.8.3.10. China Vapour Barrier, By End-Use Industry, 2017-2030 (Billion Units)
17.8.4. Japan
17.8.4.1. Japan Vapour Barrier Market Estimates and Forecast, 2017-2030 (US$ Bn)
17.8.4.2. Japan Vapour Barrier Market Estimates and Forecast, 2017-2030 (Billion Units)
17.8.4.3. Japan Vapour Barrier, By Material, 2017-2030 (US$ Bn)
17.8.4.4. Japan Vapour Barrier, By Material, 2017-2030 (Billion Units)
17.8.4.5. Japan Vapour Barrier, By Application, 2017-2030 (US$ Bn)
17.8.4.6. Japan Vapour Barrier, By Application, 2017-2030 (Billion Units)
17.8.4.7. Japan Vapour Barrier, By Installation, 2017-2030 (US$ Bn)
17.8.4.8. Japan Vapour Barrier, By Installation, 2017-2030 (Billion Units)
17.8.4.9. Japan Vapour Barrier, By End-Use Industry, 2017-2030 (US$ Bn)
17.8.4.10. Japan Vapour Barrier, By End-Use Industry, 2017-2030 (Billion Units)
17.8.5. India
17.8.5.1. India Vapour Barrier Market Estimates and Forecast, 2017-2030 (US$ Bn)
17.8.5.2. India Vapour Barrier Market Estimates and Forecast, 2017-2030 (Billion Units)
17.8.5.3. India Vapour Barrier, By Material, 2017-2030 (US$ Bn)
17.8.5.4. India Vapour Barrier, By Material, 2017-2030 (Billion Units)
17.8.5.5. India Vapour Barrier, By Application, 2017-2030 (US$ Bn)
17.8.5.6. India Vapour Barrier, By Application, 2017-2030 (Billion Units)
17.8.5.7. India Vapour Barrier, By Installation, 2017-2030 (US$ Bn)
17.8.5.8. India Vapour Barrier, By Installation, 2017-2030 (Billion Units)
17.8.5.9. India Vapour Barrier, By End-Use Industry, 2017-2030 (US$ Bn)
17.8.5.10. India Vapour Barrier, By End-Use Industry, 2017-2030 (Billion Units)
17.8.6. South Korea
17.8.6.1. South Korea Vapour Barrier Market Estimates and Forecast, 2017-2030 (US$ Bn)
17.8.6.2. South Korea Vapour Barrier Market Estimates and Forecast, 2017-2030 (Billion Units)
17.8.6.3. South Korea Vapour Barrier, By Material, 2017-2030 (US$ Bn)
17.8.6.4. South Korea Vapour Barrier, By Material, 2017-2030 (Billion Units)
17.8.6.5. South Korea Vapour Barrier, By Application, 2017-2030 (US$ Bn)
17.8.6.6. South Korea Vapour Barrier, By Application, 2017-2030 (Billion Units)
17.8.6.7. South Korea Vapour Barrier, By Installation, 2017-2030 (US$ Bn)
17.8.6.8. South Korea Vapour Barrier, By Installation, 2017-2030 (Billion Units)
17.8.6.9. South Korea Vapour Barrier, By End-Use Industry, 2017-2030 (US$ Bn)
17.8.6.10. South Korea Vapour Barrier, By End-Use Industry, 2017-2030 (Billion Units)
17.8.7. South-East Asia
17.8.7.1. South-East Asia Vapour Barrier Market Estimates and Forecast, 2017-2030 (US$ Bn)
17.8.7.2. South-East Asia Vapour Barrier Market Estimates and Forecast, 2017-2030 (Billion Units)
17.8.7.3. South-East Asia Vapour Barrier, By Material, 2017-2030 (US$ Bn)
17.8.7.4. South-East Asia Vapour Barrier, By Material, 2017-2030 (Billion Units)
17.8.7.5. South-East Asia Vapour Barrier, By Application, 2017-2030 (US$ Bn)
17.8.7.6. South-East Asia Vapour Barrier, By Application, 2017-2030 (Billion Units)
17.8.7.7. South-East Asia Vapour Barrier, By Installation, 2017-2030 (US$ Bn)
17.8.7.8. South-East Asia Vapour Barrier, By Installation, 2017-2030 (Billion Units)
17.8.7.9. South-East Asia Vapour Barrier, By End-Use Industry, 2017-2030 (US$ Bn)
17.8.7.10. South-East Asia Vapour Barrier, By End-Use Industry, 2017-2030 (Billion Units)
17.8.8. Rest of Asia Pacific
17.8.8.1. Rest of Asia Pacific Vapour Barrier Market Estimates and Forecast, 2017-2030 (US$ Bn)
17.8.8.2. Rest of Asia Pacific Vapour Barrier Market Estimates and Forecast, 2017-2030 (Billion Units)
17.8.8.3. Rest of Asia Pacific Vapour Barrier, By Material, 2017-2030 (US$ Bn)
17.8.8.4. Rest of Asia Pacific Vapour Barrier, By Material, 2017-2030 (Billion Units)
17.8.8.5. Rest of Asia Pacific Vapour Barrier, By Application, 2017-2030 (US$ Bn)
17.8.8.6. Rest of Asia Pacific Vapour Barrier, By Application, 2017-2030 (Billion Units)
17.8.8.7. Rest of Asia Pacific Vapour Barrier, By Installation, 2017-2030 (US$ Bn)
17.8.8.8. Rest of Asia Pacific Vapour Barrier, By Installation, 2017-2030 (Billion Units)
17.8.8.9. Rest of Asia Pacific Vapour Barrier, By End-Use Industry, 2017-2030 (US$ Bn)
17.8.8.10. Rest of Asia Pacific Vapour Barrier, By End-Use Industry, 2017-2030 (Billion Units)

18. Latin America Vapour Barrier Market Analysis
18.1. Latin America Vapour Barrier Market, by Material, 2017-2030(US$ Bn)
18.1.1. Overview
18.1.2. SRC Analysis
18.2. Latin America Vapour Barrier Market, by Material, 2017-2030(Billion Units)
18.2.1. Overview
18.2.2. SRC Analysis
18.3. Latin America Vapour Barrier Market, by Application, 2017-2030(US$ Bn)
18.3.1. Overview
18.3.2. SRC Analysis
18.4. Latin America Vapour Barrier Market, by Application, 2017-2030(Billion Units)
18.4.1. Overview
18.4.2. SRC Analysis
18.5. Latin America Vapour Barrier Market, by Installation, 2017-2030(US$ Bn)
18.5.1. Overview
18.5.2. SRC Analysis
18.6. Latin America Vapour Barrier Market, by Installation, 2017-2030(Billion Units)
18.6.1. Overview
18.6.2. SRC Analysis
18.7. Latin America Vapour Barrier Market, by End-Use Industry, 2017-2030(US$ Bn)
18.7.1. Overview
18.7.2. SRC Analysis
18.8. Latin America Vapour Barrier Market, by End-Use Industry, 2017-2030(Billion Units)
18.8.1. Overview
18.8.2. SRC Analysis
18.9. Latin America Vapour Barrier Market, by Country, 2017-2030 (US$ Bn)
18.9.1. Latin America Vapour Barrier Market Revenue, by Country, 2022 Vs 2030 (in%)
18.9.2. Latin America Vapour Barrier Market Volume, by Country, 2022 Vs 2030 (in%)
18.9.3. Brazil
18.9.3.1. Brazil Vapour Barrier Market Estimates and Forecast, 2017-2030 (US$ Bn)
18.9.3.2. Brazil Vapour Barrier Market Estimates and Forecast, 2017-2030 (Billion Units)
18.9.3.3. Brazil Vapour Barrier, By Material, 2017-2030 (US$ Bn)
18.9.3.4. Brazil Vapour Barrier, By Material, 2017-2030 (Billion Units)
18.9.3.5. Brazil Vapour Barrier, By Application, 2017-2030 (US$ Bn)
18.9.3.6. Brazil Vapour Barrier, By Application, 2017-2030 (Billion Units)
18.9.3.7. Brazil Vapour Barrier, By Installation, 2017-2030 (US$ Bn)
18.9.3.8. Brazil Vapour Barrier, By Installation, 2017-2030 (Billion Units)
18.9.3.9. Brazil Vapour Barrier, By End-Use Industry, 2017-2030 (US$ Bn)
18.9.3.10. Brazil Vapour Barrier, By End-Use Industry, 2017-2030 (Billion Units)
18.9.4. Argentina
18.9.4.1. Argentina Vapour Barrier Market Estimates and Forecast, 2017-2030 (US$ Bn)
18.9.4.2. Argentina Vapour Barrier Market Estimates and Forecast, 2017-2030 (Billion Units)
18.9.4.3. Argentina Vapour Barrier, By Material, 2017-2030 (US$ Bn)
18.9.4.4. Argentina Vapour Barrier, By Material, 2017-2030 (Billion Units)
18.9.4.5. Argentina Vapour Barrier, By Application, 2017-2030 (US$ Bn)
18.9.4.6. Argentina Vapour Barrier, By Application, 2017-2030 (Billion Units)
18.9.4.7. Argentina Vapour Barrier, By Installation, 2017-2030 (US$ Bn)
18.9.4.8. Argentina Vapour Barrier, By Installation, 2017-2030 (Billion Units)
18.9.4.9. Argentina Vapour Barrier, By End-Use Industry, 2017-2030 (US$ Bn)
18.9.4.10. Argentina Vapour Barrier, By End-Use Industry, 2017-2030 (Billion Units)
18.9.5. Rest of Latin America
18.9.5.1. Rest of Latin America Vapour Barrier Market Estimates and Forecast, 2017-2030 (US$ Bn)
18.9.5.2. Rest of Latin America Vapour Barrier Market Estimates and Forecast, 2017-2030 (Billion Units)
18.9.5.3. Rest of Latin America Vapour Barrier, By Material, 2017-2030 (US$ Bn)
18.9.5.4. Rest of Latin America Vapour Barrier, By Material, 2017-2030 (Billion Units)
18.9.5.5. Rest of Latin America Vapour Barrier, By Application, 2017-2030 (US$ Bn)
18.9.5.6. Rest of Latin America Vapour Barrier, By Application, 2017-2030 (Billion Units)
18.9.5.7. Rest of Latin America Vapour Barrier, By Installation, 2017-2030 (US$ Bn)
18.9.5.8. Rest of Latin America Vapour Barrier, By Installation, 2017-2030 (Billion Units)
18.9.5.9. Rest of Latin America Vapour Barrier, By End-Use Industry, 2017-2030 (US$ Bn)
18.9.5.10. Rest of Latin America Vapour Barrier, By End-Use Industry, 2017-2030 (Billion Units)

19. Middle East and Africa Vapour Barrier Market Analysis
19.1. Middle East and Africa Vapour Barrier Market, by Material, 2017-2030(US$ Bn)
19.1.1. Overview
19.1.2. SRC Analysis
19.2. Middle East and Africa Vapour Barrier Market, by Material, 2017-2030(Billion Units)
19.2.1. Overview
19.2.2. SRC Analysis
19.3. Middle East and Africa Vapour Barrier Market, by Application, 2017-2030(US$ Bn)
19.3.1. Overview
19.3.2. SRC Analysis
19.4. Middle East and Africa Vapour Barrier Market, by Application, 2017-2030(Billion Units)
19.4.1. Overview
19.4.2. SRC Analysis
19.5. Middle East and Africa Vapour Barrier Market, by Installation, 2017-2030(US$ Bn)
19.5.1. Overview
19.5.2. SRC Analysis
19.6. Middle East and Africa Vapour Barrier Market, by Installation, 2017-2030(Billion Units)
19.6.1. Overview
19.6.2. SRC Analysis
19.7. Middle East and Africa Vapour Barrier Market, by End-Use Industry, 2017-2030(US$ Bn)
19.7.1. Overview
19.7.2. SRC Analysis
19.8. Middle East and Africa Vapour Barrier Market, by End-Use Industry, 2017-2030(Billion Units)
19.8.1. Overview
19.8.2. SRC Analysis
19.9. Middle East and Africa Vapour Barrier Market, by Country, 2017-2030 (US$ Bn)
19.9.1. Middle East and Africa Vapour Barrier Market Revenue, by Country, 2022 Vs 2030 (in%)
19.9.2. Middle East and Africa Vapour Barrier Market Volume, by Country, 2022 Vs 2030 (in%)
19.9.3. GCC Countries
19.9.3.1. GCC Countries Vapour Barrier Market Estimates and Forecast, 2017-2030 (US$ Bn)
19.9.3.2. GCC Countries Vapour Barrier Market Estimates and Forecast, 2017-2030 (Billion Units)
19.9.3.3. GCC Countries Vapour Barrier, By Material, 2017-2030 (US$ Bn)
19.9.3.4. GCC Countries Vapour Barrier, By Material, 2017-2030 (Billion Units)
19.9.3.5. GCC Countries Vapour Barrier, By Application, 2017-2030 (US$ Bn)
19.9.3.6. GCC Countries Vapour Barrier, By Application, 2017-2030 (Billion Units)
19.9.3.7. GCC Countries Vapour Barrier, By Installation, 2017-2030 (US$ Bn)
19.9.3.8. GCC Countries Vapour Barrier, By Installation, 2017-2030 (Billion Units)
19.9.3.9. GCC Countries Vapour Barrier, By End-Use Industry, 2017-2030 (US$ Bn)
19.9.3.10. GCC Countries Vapour Barrier, By End-Use Industry, 2017-2030 (Billion Units)
19.9.4. South Africa
19.9.4.1. South Africa Vapour Barrier Market Estimates and Forecast, 2017-2030 (US$ Bn)
19.9.4.2. South Africa Vapour Barrier Market Estimates and Forecast, 2017-2030 (Billion Units)
19.9.4.3. South Africa Vapour Barrier, By Material, 2017-2030 (US$ Bn)
19.9.4.4. South Africa Vapour Barrier, By Material, 2017-2030 (Billion Units)
19.9.4.5. South Africa Vapour Barrier, By Application, 2017-2030 (US$ Bn)
19.9.4.6. South Africa Vapour Barrier, By Application, 2017-2030 (Billion Units)
19.9.4.7. South Africa Vapour Barrier, By Installation, 2017-2030 (US$ Bn)
19.9.4.8. South Africa Vapour Barrier, By Installation, 2017-2030 (Billion Units)
19.9.4.9. South Africa Vapour Barrier, By End-Use Industry, 2017-2030 (US$ Bn)
19.9.4.10. South Africa Vapour Barrier, By End-Use Industry, 2017-2030 (Billion Units)
19.9.5. Rest of Middle East and Africa
19.9.5.1. Rest of Middle East and Africa Vapour Barrier Market Estimates and Forecast, 2017-2030 (US$ Bn)
19.9.5.2. Rest of Middle East and Africa Vapour Barrier Market Estimates and Forecast, 2017-2030 (Billion Units)
19.9.5.3. Rest of Middle East and Africa Vapour Barrier, By Material, 2017-2030 (US$ Bn)
19.9.5.4. Rest of Middle East and Africa Vapour Barrier, By Material, 2017-2030 (Billion Units)
19.9.5.5. Rest of Middle East and Africa Vapour Barrier, By Application, 2017-2030 (US$ Bn)
19.9.5.6. Rest of Middle East and Africa Vapour Barrier, By Application, 2017-2030 (Billion Units)
19.9.5.7. Rest of Middle East and Africa Vapour Barrier, By Installation, 2017-2030 (US$ Bn)
19.9.5.8. Rest of Middle East and Africa Vapour Barrier, By Installation, 2017-2030 (Billion Units)
19.9.5.9. Rest of Middle East and Africa Vapour Barrier, By End-Use Industry, 2017-2030 (US$ Bn)
19.9.5.10. Rest of Middle East and Africa Vapour Barrier, By End-Use Industry, 2017-2030 (Billion Units)

20. Company Profiles
20.1. Carlisle Companies Inc
20.1.1. Company Overview
20.1.2. Products/Services Portfolio
20.1.3. Geographical Presence
20.1.4. Financial Summary
20.1.4.1. Market Revenue and Net Profit (2019-2022)
20.1.4.2. Business Segment Revenue Analysis
20.1.4.3. Geographical Revenue Analysis
20.2. W.R. Meadows, Inc.
20.3. 3M Company
20.4. DuPont de Nemours Inc.
20.5. Stego Industries, LLC
20.6. RPM International Inc.
20.7. BASF SE
20.8. RIMA International
20.9. Reflectix, Inc.
20.10. Reef Industries Inc.
20.11. UFP Industries Inc.
20.12. BMI Icopal
20.13. Layfield Grioup Ltd.
20.14. Visqueen Building Product
20.15. Others

List of Figures
FIG. 1 Global Vapour Barrier Market: Research Methodology
FIG. 2 Market Size Estimation – Top Down & Bottom up Approach
FIG. 3 Global Vapour Barrier Market Segmentation
FIG. 4 Global Vapour Barrier Market, by Material, 2022 (US$ Bn) (Billion Units)
FIG. 5 Global Vapour Barrier Market, by Application, 2022(US$ Bn) (Billion Units)
FIG. 6 Global Vapour Barrier Market, by Installation, 2022 (US$ Bn) (Billion Units)
FIG. 7 Global Vapour Barrier Market, byEnd-Use Industry, 2022 (US$ Bn) (Billion Units)
FIG. 8 Global Vapour Barrier Market, by Geography, 2022(US$ Bn) (Billion Units)
FIG. 9 Attractive Investment Proposition, by Material, 2022
FIG. 10 Attractive Investment Proposition, by Application, 2022
FIG. 11 Attractive Investment Proposition, by Installation, 2022
FIG. 12 Attractive Investment Proposition, by End-Use Industry, 2022
FIG. 13 Attractive Investment Proposition, by Geography, 2022
FIG. 14 Global Market Share Analysis of Key Vapour Barrier Market Manufacturers, 2022
FIG. 15 Global Market Positioning of Key Vapour Barrier Market Manufacturers, 2022
FIG. 16 Global Vapour Barrier Market Value Contribution, By Material, 2022 & 2030 (Value %)
FIG. 17 Global Vapour Barrier Market, by Glass, Value, 2017-2030(US$ Bn) (Billion Units)
FIG. 18 Global Vapour Barrier Market, by Metal Sheet, Value, 2017-2030(US$ Bn) (Billion Units)
FIG. 19 Global Vapour Barrier Market, by Polymers, Value, 2017-2030 (US$ Bn) (Billion Units)
FIG. 20 Global Vapour Barrier Market, by Others, Value, 2017-2030 (US$ Bn) (Billion Units)
FIG. 21 Global Vapour Barrier Market Value Contribution, By Application, 2022 & 2030 (Value %)
FIG. 22 Global Vapour Barrier Market, by Installation, Value, 2017-2030(US$ Bn) (Billion Units)
FIG. 23 Global Vapour Barrier Market, by Water Proofing, 2017-2030(US$ Bn) (Billion Units)
FIG. 24 Global Vapour Barrier Market, by Others, 2017-2030(US$ Bn) (Billion Units)
FIG. 25 Global Vapour Barrier Market Value Contribution, By Installation, 2022 & 2030 (Value %)
FIG. 26 Global Vapour Barrier Market, by Membranes, Value, 2017-2030 (US$ Bn) (Billion Units)
FIG. 27 Global Vapour Barrier Market, by Coatings, 2017-2030 (US$ Bn) (Billion Units)
FIG. 28 Global Vapour Barrier Market, by Cementitious Waterproofing, 2017-2030 (US$ Bn) (Billion Units)
FIG. 29 Global Vapour Barrier Market, by Stacking and Filling, 2017-2030 (US$ Bn) (Billion Units)
FIG. 30 Global Vapour Barrier Market Value Contribution, By End-Use Industry, 2022 & 2030 (Value %)
FIG. 31 Global Vapour Barrier Market, by Construction, Value, 2017-2030 (US$ Bn) (Billion Units)
FIG. 32 Global Vapour Barrier Market, by Packaging, 2017-2030 (US$ Bn) (Billion Units)
FIG. 33 Global Vapour Barrier Market, by Automotive, 2017-2030 (US$ Bn) (Billion Units)
FIG. 34 Global Vapour Barrier Market, by Others, 2017-2030 (US$ Bn) (Billion Units)
FIG. 35 North America Vapour Barrier Market, 2017-2030 (US$ Bn) (Billion Units)
FIG. 36 U.S. Vapour Barrier Market, 2017-2030(US$ Bn) (Billion Units)
FIG. 37 Canada Vapour Barrier Market, 2017-2030(US$ Bn) (Billion Units)
FIG. 38 Europe Vapour Barrier Market, 2017-2030 (US$ Bn) (Billion Units)
FIG. 39 Germany Vapour Barrier Market, 2017-2030(US$ Bn) (Billion Units)
FIG. 40 France Vapour Barrier Market, 2017-2030(US$ Bn) (Billion Units)
FIG. 41 U.K. Vapour Barrier Market, 2017-2030(US$ Bn) (Billion Units)
FIG. 42 Italy Vapour Barrier Market, 2017-2030(US$ Bn) (Billion Units)
FIG. 43 Spain Vapour Barrier Market, 2017-2030(US$ Bn) (Billion Units)
FIG. 44 Rest of Europe Vapour Barrier Market, 2017-2030(US$ Bn) (Billion Units)
FIG. 45 Asia Pacific Vapour Barrier Market, 2017-2030 (US$ Bn) (Billion Units)
FIG. 46 China Vapour Barrier Market, 2017-2030(US$ Bn) (Billion Units)
FIG. 47 Japan Vapour Barrier Market, 2017-2030(US$ Bn) (Billion Units)
FIG. 48 India Vapour Barrier Market, 2017-2030(US$ Bn) (Billion Units)
FIG. 49 South Korea Vapour Barrier Market, 2017-2030(US$ Bn) (Billion Units)
FIG. 50 South-East Asia Vapour Barrier Market, 2017-2030(US$ Bn) (Billion Units)
FIG. 51 Rest of Asia Pacific Vapour Barrier Market, 2017-2030(US$ Bn) (Billion Units)
FIG. 52 Latin America Vapour Barrier Market, 2017-2030(US$ Bn) (Billion Units)
FIG. 53 Brazil Vapour Barrier Market, 2017-2030(US$ Bn) (Billion Units)
FIG. 54 Mexico Vapour Barrier Market, 2017-2030(US$ Bn) (Billion Units)
FIG. 55 Rest of Latin America Vapour Barrier Market, 2017-2030(US$ Bn) (Billion Units)
FIG. 56 Middle East & Africa Vapour Barrier Market, 2017-2030(US$ Bn) (Billion Units)
FIG. 57 GCC Countries Vapour Barrier Market, 2017-2030(US$ Bn) (Billion Units)
FIG. 58 South Africa Vapour Barrier Market, 2017-2030(US$ Bn) (Billion Units)
FIG. 59 Rest of Middle East and Africa Vapour Barrier Market, 2017-2030(US$ Bn) (Billion Units)


List of Tables
TABLE 1 Market Snapshot: Global Vapour BarrierMarket
TABLE 2 Global Vapour Barrier Market: Market Drivers Impact Analysis
TABLE 3 Global Vapour Barrier Market: Market Restraints Impact Analysis
TABLE 4 Global Vapour Barrier Market, by Competitive Benchmarking,2022
TABLE 5 Global Vapour Barrier Market, by Geographical Presence Analysis, 2022
TABLE 6 Global Vapour Barrier Market, by Key Strategies Analysis, 2022
TABLE 7 Global Vapour Barrier Market, by Glass, By Region, 2017-2022(US$ Bn)
TABLE 8 Global Vapour Barrier Market, by Glass, By Region, 2023-2030(US$ Bn)
TABLE 9 Global Vapour Barrier Market, by Glass, By Region, 2017-2022(Billion Units)
TABLE 10 Global Vapour Barrier Market, by Glass, By Region, 2023-2030(Billion Units)
TABLE 11 Global Vapour Barrier Market, by Metal Sheet, By Region, 2017-2022(US$ Bn)
TABLE 12 Global Vapour Barrier Market, by Metal Sheet, By Region, 2023-2030(US$ Bn)
TABLE 13 Global Vapour Barrier Market, by Metal Sheet, By Region, 2017-2022(Billion Units)
TABLE 14 Global Vapour Barrier Market, by Metal Sheet, By Region, 2023-2030(Billion Units)
TABLE 15 Global Vapour Barrier Market, by Polymers, By Region, 2017-2022(US$ Bn)
TABLE 16 Global Vapour Barrier Market, by Polymers, By Region, 2023-2030(US$ Bn)
TABLE 17 Global Vapour Barrier Market, by Polymers, By Region, 2017-2022(Billion Units)
TABLE 18 Global Vapour Barrier Market, by Polymers, By Region, 2023-2030(Billion Units
TABLE 19 Global Vapour Barrier Market, by Others, By Region, 2017-2022(US$ Bn)
TABLE 20 Global Vapour Barrier Market, by Others, By Region, 2023-2030(US$ Bn)
TABLE 21 Global Vapour Barrier Market, by Others, By Region, 2017-2022(Billion Units)
TABLE 22 Global Vapour Barrier Market, by Others, By Region, 2023-2030(Billion Units))
TABLE 23 Global Vapour Barrier Market, by Installation, By Region, 2017-2022(US$ Bn)
TABLE 24 Global Vapour Barrier Market, by Installation, By Region, 2023-2030(US$ Bn)
TABLE 25 Global Vapour Barrier Market, by Installation, By Region, 2017-2022(Billion Units)
TABLE 26 Global Vapour Barrier Market, by Installation, By Region, 2023-2030(Billion Units)
TABLE 27 Global Vapour Barrier Market, by Water Proofing, By Region, 2017-2022(US$ Bn)
TABLE 28 Global Vapour Barrier Market, by Water Proofing, By Region, 2023-2030(US$ Bn)
TABLE 29 Global Vapour Barrier Market, by Water Proofing, By Region, 2017-2022(Billion Units)
TABLE 30 Global Vapour Barrier Market, by Water Proofing, By Region, 2023-2030(Billion Units)
TABLE 31 Global Vapour Barrier Market, by Others, By Region, 2017-2022(US$ Bn)
TABLE 32 Global Vapour Barrier Market, by Others, By Region, 2023-2030(US$ Bn)
TABLE 33 Global Vapour Barrier Market, by Others, By Region, 2017-2022(Billion Units)
TABLE 34 Global Vapour Barrier Market, by Others, By Region, 2023-2030(Billion Units)
TABLE 35 Global Vapour Barrier Market, by Membranes, By Region, 2017-2022(US$ Bn)
TABLE 36 Global Vapour Barrier Market, by Membranes, By Region, 2023-2030(US$ Bn)
TABLE 37 Global Vapour Barrier Market, by Membranes, By Region, 2017-2022(Billion Units)
TABLE 38 Global Vapour Barrier Market, by Membranes, By Region, 2023-2030(Billion Units)
TABLE 39 Global Vapour Barrier Market, by Coatingss, By Region, 2017-2022(US$ Bn)
TABLE 40 Global Vapour Barrier Market, by Coatingss, By Region, 2023-2030(US$ Bn)
TABLE 41 Global Vapour Barrier Market, by Coatingss, By Region, 2017-2022(Billion Units)
TABLE 42 Global Vapour Barrier Market, by Coatingss, By Region, 2023-2030(Billion Units)
TABLE 43 Global Vapour Barrier Market, by Cementitious Waterproofing, By Region, 2017-2022(US$ Bn)
TABLE 44 Global Vapour Barrier Market, by Cementitious Waterproofing, By Region, 2023-2030(US$ Bn)
TABLE 45 Global Vapour Barrier Market, by Cementitious Waterproofing, By Region, 2017-2022(Billion Units)
TABLE 46 Global Vapour Barrier Market, by Cementitious Waterproofing, By Region, 2023-2030(Billion Units)
TABLE 47 Global Vapour Barrier Market, by Stacking and Filling, By Region, 2017-2022(US$ Bn)
TABLE 48 Global Vapour Barrier Market, by Stacking and Filling, By Region, 2023-2030(US$ Bn)
TABLE 49 Global Vapour Barrier Market, by Stacking and Filling, By Region, 2017-2022(Billion Units)
TABLE 50 Global Vapour Barrier Market, by Stacking and Filling, By Region, 2023-2030(Billion Units)
TABLE 51 Global Vapour Barrier Market, by Construction, By Region, 2017-2022(US$ Bn)
TABLE 52 Global Vapour Barrier Market, by Construction, By Region, 2023-2030(US$ Bn)
TABLE 53 Global Vapour Barrier Market, by Construction, By Region, 2017-2022(Billion Units)
TABLE 54 Global Vapour Barrier Market, by Construction, By Region, 2023-2030(Billion Units)
TABLE 55 Global Vapour Barrier Market, by Packaging, By Region, 2017-2022(US$ Bn)
TABLE 56 Global Vapour Barrier Market, by Packaging, By Region, 2023-2030(US$ Bn)
TABLE 57 Global Vapour Barrier Market, by Packaging, By Region, 2017-2022(Billion Units)
TABLE 58 Global Vapour Barrier Market, by Packaging, By Region, 2023-2030(Billion Units)
TABLE 59 Global Vapour Barrier Market, by Automotive, By Region, 2017-2022(US$ Bn)
TABLE 60 Global Vapour Barrier Market, by Automotive, By Region, 2023-2030(US$ Bn)
TABLE 61 Global Vapour Barrier Market, by Automotive, By Region, 2017-2022(Billion Units)
TABLE 62 Global Vapour Barrier Market, by Automotive, By Region, 2023-2030(Billion Units)
TABLE 63 Global Vapour Barrier Market, by Others, By Region, 2017-2022(US$ Bn)
TABLE 64 Global Vapour Barrier Market, by Others, By Region, 2023-2030(US$ Bn)
TABLE 65 Global Vapour Barrier Market, by Others, By Region, 2017-2022(Billion Units)
TABLE 66 Global Vapour Barrier Market, by Others, By Region, 2023-2030(Billion Units)
TABLE 67 Global Vapour Barrier Market, by Material, 2017-2022(US$ Bn)
TABLE 68 Global Vapour Barrier Market, by Material, 2023-2030(US$ Bn)
TABLE 69 Global Vapour Barrier Market, by Material, 2017-2022(Billion Units)
TABLE 70 Global Vapour Barrier Market, by Material, 2023-2030(Billion Units)
TABLE 71 Global Vapour Barrier Market, by Application, 2017-2022(US$ Bn)
TABLE 72 Global Vapour Barrier Market, by Application, 2023-2030(US$ Bn)
TABLE 73 Global Vapour Barrier Market, by Application, 2017-2022(Billion Units)
TABLE 74 Global Vapour Barrier Market, by Application, 2023-2030(Billion Units)
TABLE 75 Global Vapour Barrier Market, by Installation, 2017-2022(US$ Bn)
TABLE 76 Global Vapour Barrier Market, by Installation, 2023-2030(US$ Bn)
TABLE 77 Global Vapour Barrier Market, by Installation, 2017-2022(Billion Units)
TABLE 78 Global Vapour Barrier Market, by Installation, 2023-2030(Billion Units)
TABLE 79 Global Vapour Barrier Market, by End-Use Industry, 2017-2022(US$ Bn)
TABLE 80 Global Vapour Barrier Market, by End-Use Industry, 2023-2030(US$ Bn)
TABLE 81 Global Vapour Barrier Market, by End-Use Industry, 2017-2022(Billion Units)
TABLE 82 Global Vapour Barrier Market, by End-Use Industry, 2023-2030(Billion Units)
TABLE 83 Global Vapour Barrier Market, by Region, 2017-2022(US$ Bn)
TABLE 84 Global Vapour Barrier Market, by Region, 2023-2030(US$ Bn)
TABLE 85 Global Vapour Barrier Market, by Region, 2017-2022(Billion Units)
TABLE 86 Global Vapour Barrier Market, by Region, 2023-2030(Billion Units)
TABLE 87 North America Vapour Barrier Market, by Material, 2017-2022(US$ Bn)
TABLE 88 North America Vapour Barrier Market, by Material, 2023-2030(US$ Bn)
TABLE 89 North America Vapour Barrier Market, by Material, 2017-2022(Billion Units)
TABLE 90 North America Vapour Barrier Market, by Material, 2023-2030(Billion Units)
TABLE 91 North America Vapour Barrier Market, by Application, 2017-2022(US$ Bn)
TABLE 92 North America Vapour Barrier Market, by Application, 2023-2030(US$ Bn)
TABLE 93 North America Vapour Barrier Market, by Application, 2017-2022(Billion Units)
TABLE 94 North America Vapour Barrier Market, by Application, 2023-2030(Billion Units)
TABLE 95 North America Vapour Barrier Market, by Installation, 2017-2022(US$ Bn)
TABLE 96 North America Vapour Barrier Market, by End-Use Industry, 2023-2030(US$ Bn)
TABLE 97 North America Vapour Barrier Market, by End-Use Industry, 2017-2022(Billion Units)
TABLE 98 North America Vapour Barrier Market, by End-Use Industry, 2023-2030(Billion Units)
TABLE 99 North America Vapour Barrier Market, by End-Use Industry, 2017-2022(US$ Bn)
TABLE 100 North America Vapour Barrier Market, by Installation, 2023-2030(US$ Bn)
TABLE 101 North America Vapour Barrier Market, by Installation, 2017-2022(Billion Units)
TABLE 102 North America Vapour Barrier Market, by Installation, 2023-2030(Billion Units)
TABLE 103 North America Vapour Barrier Market, by Country, 2017-2022(US$ Bn)
TABLE 104 North America Vapour Barrier Market, by Country, 2023-2030(US$ Bn)
TABLE 105 North America Vapour Barrier Market, by Country, 2017-2022(Billion Units)
TABLE 106 North America Vapour Barrier Market, by Country, 2023-2030(Billion Units)
TABLE 107 U.S. Vapour Barrier Market, by Material, 2017-2022(US$ Bn)
TABLE 108 U.S. Vapour Barrier Market, by Material, 2023-2030(US$ Bn)
TABLE 109 U.S. Vapour Barrier Market, by Material, 2017-2022(Billion Units)
TABLE 110 U.S. Vapour Barrier Market, by Material, 2023-2030(Billion Units)
TABLE 111 U.S. Vapour Barrier Market, by Application, 2017-2022(US$ Bn)
TABLE 112 U.S. Vapour Barrier Market, by Application, 2023-2030(US$ Bn)
TABLE 113 U.S. Vapour Barrier Market, by Application, 2017-2022(Billion Units)
TABLE 114 U.S. Vapour Barrier Market, by Application, 2023-2030(Billion Units)
TABLE 115 U.S. Vapour Barrier Market, by Installation, 2017-2022(US$ Bn)
TABLE 116 U.S. Vapour Barrier Market, by Installation, 2023-2030(US$ Bn)
TABLE 117 U.S. Vapour Barrier Market, by Installation, 2017-2022(Billion Units)
TABLE 118 U.S. Vapour Barrier Market, by Installation, 2023-2030(Billion Units)
TABLE 119 U.S. Vapour Barrier Market, by End-Use Industry, 2017-2022(US$ Bn)
TABLE 120 U.S. Vapour Barrier Market, by End-Use Industry, 2023-2030(US$ Bn)
TABLE 121 U.S. Vapour Barrier Market, by End-Use Industry, 2017-2022(Billion Units)
TABLE 122 U.S. Vapour Barrier Market, by End-Use Industry, 2023-2030(Billion Units)
TABLE 123 Canada Vapour Barrier Market, by Material, 2017-2022(US$ Bn)
TABLE 124 Canada Vapour Barrier Market, by Material, 2023-2030(US$ Bn)
TABLE 125 Canada Vapour Barrier Market, by Material, 2017-2022(Billion Units)
TABLE 126 Canada Vapour Barrier Market, by Material, 2023-2030(Billion Units)
TABLE 127 Canada Vapour Barrier Market, by Application, 2017-2022(US$ Bn)
TABLE 128 Canada Vapour Barrier Market, by Application, 2023-2030(US$ Bn)
TABLE 129 Canada Vapour Barrier Market, by Application, 2017-2022(Billion Units)
TABLE 130 Canada Vapour Barrier Market, by Application, 2023-2030(Billion Units)
TABLE 131 Canada Vapour Barrier Market, by Installation, 2017-2022(US$ Bn)
TABLE 132 Canada Vapour Barrier Market, by Installation, 2023-2030(US$ Bn)
TABLE 133 Canada Vapour Barrier Market, by Installation, 2017-2022(Billion Units)
TABLE 134 Canada Vapour Barrier Market, by Installation, 2023-2030(Billion Units)
TABLE 135 Canada Vapour Barrier Market, by End-Use Industry, 2017-2022(US$ Bn)
TABLE 136 Canada Vapour Barrier Market, by End-Use Industry, 2023-2030(US$ Bn)
TABLE 137 Canada Vapour Barrier Market, by End-Use Industry, 2017-2022(Billion Units)
TABLE 138 Canada Vapour Barrier Market, by End-Use Industry, 2023-2030(Billion Units)
TABLE 139 Mexico Vapour Barrier Market, by Material, 2017-2022(US$ Bn)
TABLE 140 Mexico Vapour Barrier Market, by Material, 2023-2030(US$ Bn)
TABLE 141 Mexico Vapour Barrier Market, by Material, 2017-2022(Billion Units)
TABLE 142 Mexico Vapour Barrier Market, by Material, 2023-2030(Billion Units)
TABLE 143 Mexico Vapour Barrier Market, by Application, 2017-2022(US$ Bn)
TABLE 144 Mexico Vapour Barrier Market, by Application, 2023-2030(US$ Bn)
TABLE 145 Mexico Vapour Barrier Market, by Application, 2017-2022(Billion Units)
TABLE 146 Mexico Vapour Barrier Market, by Application, 2023-2030(Billion Units)
TABLE 147 Mexico Vapour Barrier Market, by Installation, 2017-2022(US$ Bn)
TABLE 148 Mexico Vapour Barrier Market, by Installation, 2023-2030(US$ Bn)
TABLE 149 Mexico Vapour Barrier Market, by Installation, 2017-2022(Billion Units)
TABLE 150 Mexico Vapour Barrier Market, by Installation, 2023-2030(Billion Units)
TABLE 151 Mexico Vapour Barrier Market, by End-Use Industry, 2017-2022(US$ Bn)
TABLE 152 Mexico Vapour Barrier Market, by End-Use Industry, 2023-2030(US$ Bn)
TABLE 153 Mexico Vapour Barrier Market, by End-Use Industry, 2017-2022(Billion Units)
TABLE 154 Mexico Vapour Barrier Market, by End-Use Industry, 2023-2030(Billion Units)
TABLE 155 Europe Vapour Barrier Market, by Material, 2017-2022(US$ Bn)
TABLE 156 Europe Vapour Barrier Market, by Material, 2023-2030(US$ Bn)
TABLE 157 Europe Vapour Barrier Market, by Material, 2017-2022(Billion Units)
TABLE 158 Europe Vapour Barrier Market, by Material, 2023-2030(Billion Units)
TABLE 159 Europe Vapour Barrier Market, by Application, 2017-2022(US$ Bn)
TABLE 160 Europe Vapour Barrier Market, by Application, 2023-2030(US$ Bn)
TABLE 161 Europe Vapour Barrier Market, by Application, 2017-2022(Billion Units)
TABLE 162 Europe Vapour Barrier Market, by Application, 2023-2030(Billion Units)
TABLE 163 Europe Vapour Barrier Market, by Installation, 2017-2022(US$ Bn)
TABLE 164 Europe Vapour Barrier Market, by Installation, 2023-2030(US$ Bn)
TABLE 165 Europe Vapour Barrier Market, by Installation, 2017-2022(Billion Units)
TABLE 166 Europe Vapour Barrier Market, by Installation, 2023-2030(Billion Units)
TABLE 167 Europe Vapour Barrier Market, by End-Use Industry, 2017-2022(US$ Bn)
TABLE 168 Europe Vapour Barrier Market, by End-Use Industry, 2023-2030(US$ Bn)
TABLE 169 Europe Vapour Barrier Market, by End-Use Industry, 2017-2022(Billion Units)
TABLE 170 Europe Vapour Barrier Market, by End-Use Industry, 2023-2030(Billion Units)
TABLE 171 Germany Vapour Barrier Market, by Material, 2017-2022(US$ Bn)
TABLE 172 Germany Vapour Barrier Market, by Material, 2023-2030(US$ Bn)
TABLE 173 Germany Vapour Barrier Market, by Material, 2017-2022(Billion Units)
TABLE 174 Europe Vapour Barrier Market, by Country, 2017-2022(US$ Bn)
TABLE 175 Europe Vapour Barrier Market, by Country, 2023-2030(US$ Bn)
TABLE 176 Europe Vapour Barrier Market, by Country, 2017-2022(Billion Units)
TABLE 177 Europe Vapour Barrier Market, by Country, 2023-2030(Billion Units)
TABLE 178 Germany Vapour Barrier Market, by Material, 2023-2030(Billion Units)
TABLE 179 Germany Vapour Barrier Market, by Application, 2017-2022(US$ Bn)
TABLE 180 Germany Vapour Barrier Market, by Application, 2023-2030(US$ Bn)
TABLE 181 Germany Vapour Barrier Market, by Application, 2017-2022(Billion Units)
TABLE 182 Germany Vapour Barrier Market, by Application, 2023-2030(Billion Units)
TABLE 183 Germany Vapour Barrier Market, by Installation, 2017-2022(US$ Bn)
TABLE 184 Germany Vapour Barrier Market, by Installation, 2023-2030(US$ Bn)
TABLE 185 Germany Vapour Barrier Market, by Installation, 2017-2022(Billion Units)
TABLE 186 Germany Vapour Barrier Market, by Installation, 2023-2030(Billion Units)
TABLE 187 Germany Vapour Barrier Market, by End-Use Industry, 2017-2022(US$ Bn)
TABLE 188 Germany Vapour Barrier Market, by End-Use Industry, 2023-2030(US$ Bn)
TABLE 189 Germany Vapour Barrier Market, by End-Use Industry, 2017-2022(Billion Units)
TABLE 190 Germany Vapour Barrier Market, by End-Use Industry, 2023-2030(Billion Units)
TABLE 191 France Vapour Barrier Market, by Material, 2017-2022(US$ Bn)
TABLE 192 France Vapour Barrier Market, by Material, 2023-2030(US$ Bn)
TABLE 193 France Vapour Barrier Market, by Material, 2017-2022(Billion Units)
TABLE 194 France Vapour Barrier Market, by Material, 2023-2030(Billion Units)
TABLE 195 France Vapour Barrier Market, by Application, 2017-2022(US$ Bn)
TABLE 196 France Vapour Barrier Market, by Application, 2023-2030(US$ Bn)
TABLE 197 France Vapour Barrier Market, by Application, 2017-2022(Billion Units)
TABLE 198 France Vapour Barrier Market, by Application, 2023-2030(Billion Units)
TABLE 199 France Vapour Barrier Market, by Installation, 2017-2022(US$ Bn)
TABLE 200 France Vapour Barrier Market, by Installation, 2023-2030(US$ Bn)
TABLE 201 France Vapour Barrier Market, by Installation, 2017-2022(Billion Units)
TABLE 202 France Vapour Barrier Market, by Installation, 2023-2030(Billion Units)
TABLE 203 France Vapour Barrier Market, by End-Use Industry, 2017-2022(US$ Bn)
TABLE 204 France Vapour Barrier Market, by End-Use Industry, 2023-2030(US$ Bn)
TABLE 205 France Vapour Barrier Market, by End-Use Industry, 2017-2022(Billion Units)
TABLE 206 France Vapour Barrier Market, by End-Use Industry, 2023-2030(Billion Units)
TABLE 207 U.K. Vapour Barrier Market, by Material, 2017-2022(US$ Bn)
TABLE 208 U.K. Vapour Barrier Market, by Material, 2023-2030(US$ Bn)
TABLE 209 U.K. Vapour Barrier Market, by Material, 2017-2022(Billion Units)
TABLE 210 U.K. Vapour Barrier Market, by Material, 2023-2030(Billion Units)
TABLE 211 U.K. Vapour Barrier Market, by Application, 2017-2022(US$ Bn)
TABLE 212 U.K. Vapour Barrier Market, by Application, 2023-2030(US$ Bn)
TABLE 213 U.K. Vapour Barrier Market, by Application, 2017-2022(Billion Units)
TABLE 214 U.K. Vapour Barrier Market, by Application, 2023-2030(Billion Units)
TABLE 215 U.K. Vapour Barrier Market, by Installation, 2017-2022(US$ Bn)
TABLE 216 U.K. Vapour Barrier Market, by Installation, 2023-2030(US$ Bn)
TABLE 217 U.K. Vapour Barrier Market, by Installation, 2017-2022(Billion Units)
TABLE 218 U.K. Vapour Barrier Market, by Installation, 2023-2030(Billion Units)
TABLE 219 U.K. Vapour Barrier Market, by End-Use Industry, 2017-2022(US$ Bn)
TABLE 220 U.K. Vapour Barrier Market, by End-Use Industry, 2023-2030(US$ Bn)
TABLE 221 U.K. Vapour Barrier Market, by End-Use Industry, 2017-2022(Billion Units)
TABLE 222 U.K. Vapour Barrier Market, by End-Use Industry, 2023-2030(Billion Units)
TABLE 223 Italy Vapour Barrier Market, by Material, 2017-2022(US$ Bn)
TABLE 224 Italy Vapour Barrier Market, by Material, 2023-2030(US$ Bn)
TABLE 225 Italy Vapour Barrier Market, by Material, 2017-2022(Billion Units)
TABLE 226 Italy Vapour Barrier Market, by Material, 2023-2030(Billion Units)
TABLE 227 Italy Vapour Barrier Market, by Application, 2017-2022(US$ Bn)
TABLE 228 Italy Vapour Barrier Market, by Application, 2023-2030(US$ Bn)
TABLE 229 Italy Vapour Barrier Market, by Application, 2017-2022(Billion Units)
TABLE 230 Italy Vapour Barrier Market, by Application, 2023-2030(Billion Units)
TABLE 231 Italy Vapour Barrier Market, by Installation, 2017-2022(US$ Bn)
TABLE 232 Italy Vapour Barrier Market, by Installation, 2023-2030(US$ Bn)
TABLE 233 Italy Vapour Barrier Market, by Installation, 2017-2022(Billion Units)
TABLE 234 Italy Vapour Barrier Market, by Installation, 2023-2030(Billion Units)
TABLE 235 Italy Vapour Barrier Market, by End-Use Industry, 2017-2022(US$ Bn)
TABLE 236 Italy Vapour Barrier Market, by End-Use Industry, 2023-2030(US$ Bn)
TABLE 237 Italy Vapour Barrier Market, by End-Use Industry, 2017-2022(Billion Units)
TABLE 238 Italy Vapour Barrier Market, by End-Use Industry, 2023-2030(Billion Units)
TABLE 239 Spain Vapour Barrier Market, by Material, 2017-2022(US$ Bn)
TABLE 240 Spain Vapour Barrier Market, by Material, 2023-2030(US$ Bn)
TABLE 241 Spain Vapour Barrier Market, by Material, 2017-2022(Billion Units)
TABLE 242 Spain Vapour Barrier Market, by Material, 2023-2030(Billion Units)
TABLE 243 Spain Vapour Barrier Market, by Application, 2017-2022(US$ Bn)
TABLE 244 Spain Vapour Barrier Market, by Application, 2023-2030(US$ Bn)
TABLE 245 Spain Vapour Barrier Market, by Application, 2017-2022(Billion Units)
TABLE 246 Spain Vapour Barrier Market, by Application, 2023-2030(Billion Units)
TABLE 247 Spain Vapour Barrier Market, by Installation, 2017-2022(US$ Bn)
TABLE 248 Spain Vapour Barrier Market, by Installation, 2023-2030(US$ Bn)
TABLE 249 Spain Vapour Barrier Market, by Installation, 2017-2022(Billion Units)
TABLE 250 Spain Vapour Barrier Market, by Installation, 2023-2030(Billion Units)
TABLE 251 Spain Vapour Barrier Market, by End-Use Industry, 2017-2022(US$ Bn)
TABLE 252 Spain Vapour Barrier Market, by End-Use Industry, 2023-2030(US$ Bn)
TABLE 253 Spain Vapour Barrier Market, by End-Use Industry, 2017-2022(Billion Units)
TABLE 254 Spain Vapour Barrier Market, by End-Use Industry, 2023-2030(Billion Units)
TABLE 255 Rest of Europe Vapour Barrier Market, by Material, 2017-2022(US$ Bn)
TABLE 256 Rest of Europe Vapour Barrier Market, by Material, 2023-2030(US$ Bn)
TABLE 257 Rest of Europe Vapour Barrier Market, by Material, 2017-2022(Billion Units)
TABLE 258 Rest of Europe Vapour Barrier Market, by Material, 2023-2030(Billion Units)
TABLE 259 Rest of Europe Vapour Barrier Market, by Application, 2017-2022(US$ Bn)
TABLE 260 Rest of Europe Vapour Barrier Market, by Application, 2023-2030(US$ Bn)
TABLE 261 Rest of Europe Vapour Barrier Market, by Application, 2017-2022(Billion Units)
TABLE 262 Rest of Europe Vapour Barrier Market, by Application, 2023-2030(Billion Units)
TABLE 263 Rest of Europe Vapour Barrier Market, by Installation, 2017-2022(US$ Bn)
TABLE 264 Rest of Europe Vapour Barrier Market, by Installation, 2023-2030(US$ Bn)
TABLE 265 Rest of Europe Vapour Barrier Market, by Installation, 2017-2022(Billion Units)
TABLE 266 Rest of Europe Vapour Barrier Market, by Installation, 2023-2030(Billion Units)
TABLE 267 Rest of Europe Vapour Barrier Market, by End-Use Industry, 2017-2022(US$ Bn)
TABLE 268 Rest of Europe Vapour Barrier Market, by End-Use Industry, 2023-2030(US$ Bn)
TABLE 269 Rest of Europe Vapour Barrier Market, by End-Use Industry, 2017-2022(Billion Units)
TABLE 270 Rest of Europe Vapour Barrier Market, by End-Use Industry, 2023-2030(Billion Units)
TABLE 271 Asia Pacific Vapour Barrier Market, by Material, 2017-2022(US$ Bn)
TABLE 272 Asia Pacific Vapour Barrier Market, by Material, 2023-2030(US$ Bn)
TABLE 273 Asia Pacific Vapour Barrier Market, by Material, 2017-2022(Billion Units)
TABLE 274 Asia Pacific Vapour Barrier Market, by Material, 2023-2030(Billion Units)
TABLE 275 Asia Pacific Vapour Barrier Market, by Application, 2017-2022(US$ Bn)
TABLE 276 Asia Pacific Vapour Barrier Market, by Application, 2023-2030(US$ Bn)
TABLE 277 Asia Pacific Vapour Barrier Market, by Application, 2017-2022(Billion Units)
TABLE 278 Asia Pacific Vapour Barrier Market, by Application, 2023-2030(Billion Units)
TABLE 279 Asia Pacific Vapour Barrier Market, by Installation, 2017-2022(US$ Bn)
TABLE 280 Asia Pacific Vapour Barrier Market, by Installation, 2023-2030(US$ Bn)
TABLE 281 Asia Pacific Vapour Barrier Market, by Installation, 2017-2022(Billion Units)
TABLE 282 Asia Pacific Vapour Barrier Market, by Installation, 2023-2030(Billion Units)
TABLE 283 Asia Pacific Vapour Barrier Market, by End-Use Industry, 2017-2022(US$ Bn)
TABLE 284 Asia Pacific Vapour Barrier Market, by End-Use Industry, 2023-2030(US$ Bn)
TABLE 285 Asia Pacific Vapour Barrier Market, by End-Use Industry, 2017-2022(Billion Units)
TABLE 286 Asia Pacific Vapour Barrier Market, by End-Use Industry, 2023-2030(Billion Units)
TABLE 287 Asia Pacific Vapour Barrier Market, by Country, 2017-2022(US$ Bn)
TABLE 288 Asia Pacific Vapour Barrier Market, by Country, 2023-2030(US$ Bn)
TABLE 289 Asia Pacific Vapour Barrier Market, by Country, 2017-2022(Billion Units)
TABLE 290 Asia Pacific Vapour Barrier Market, by Country, 2023-2030(Billion Units)
TABLE 291 China Vapour Barrier Market, by Material, 2017-2022(US$ Bn)
TABLE 292 China Vapour Barrier Market, by Material, 2023-2030(US$ Bn)
TABLE 293 China Vapour Barrier Market, by Material, 2017-2022(Billion Units)
TABLE 294 China Vapour Barrier Market, by Material, 2023-2030(Billion Units)
TABLE 295 China Vapour Barrier Market, by Application, 2017-2022(US$ Bn)
TABLE 296 China Vapour Barrier Market, by Application, 2023-2030(US$ Bn)
TABLE 297 China Vapour Barrier Market, by Application, 2017-2022(Billion Units)
TABLE 298 China Vapour Barrier Market, by Application, 2023-2030(Billion Units)
TABLE 299 China Vapour Barrier Market, by Installation, 2017-2022(US$ Bn)
TABLE 300 China Vapour Barrier Market, by Installation, 2023-2030(US$ Bn)
TABLE 301 China Vapour Barrier Market, by Installation, 2017-2022(Billion Units)
TABLE 302 China Vapour Barrier Market, by Installation, 2023-2030(Billion Units)
TABLE 303 China Vapour Barrier Market, by End-Use Industry, 2017-2022(US$ Bn)
TABLE 304 China Vapour Barrier Market, by End-Use Industry, 2023-2030(US$ Bn)
TABLE 305 China Vapour Barrier Market, by End-Use Industry, 2017-2022(Billion Units)
TABLE 306 China Vapour Barrier Market, by End-Use Industry, 2023-2030(Billion Units)
TABLE 307 Japan Vapour Barrier Market, by Material, 2017-2022(US$ Bn)
TABLE 308 Japan Vapour Barrier Market, by Material, 2023-2030(US$ Bn)
TABLE 309 Japan Vapour Barrier Market, by Material, 2017-2022(Billion Units)
TABLE 310 Japan Vapour Barrier Market, by Material, 2023-2030(Billion Units)
TABLE 311 Japan Vapour Barrier Market, by Application, 2017-2022(US$ Bn)
TABLE 312 Japan Vapour Barrier Market, by Application, 2023-2030(US$ Bn)
TABLE 313 Japan Vapour Barrier Market, by Application, 2017-2022(Billion Units)
TABLE 314 Japan Vapour Barrier Market, by Application, 2023-2030(Billion Units)
TABLE 315 Japan Vapour Barrier Market, by Installation, 2017-2022(US$ Bn)
TABLE 316 Japan Vapour Barrier Market, by Installation, 2023-2030(US$ Bn)
TABLE 317 Japan Vapour Barrier Market, by Installation, 2017-2022(Billion Units)
TABLE 318 Japan Vapour Barrier Market, by Installation, 2023-2030(Billion Units)
TABLE 319 Japan Vapour Barrier Market, by End-Use Industry, 2017-2022(US$ Bn)
TABLE 320 Japan Vapour Barrier Market, by End-Use Industry, 2023-2030(US$ Bn)
TABLE 321 Japan Vapour Barrier Market, by End-Use Industry, 2017-2022(Billion Units)
TABLE 322 Japan Vapour Barrier Market, by End-Use Industry, 2023-2030(Billion Units)
TABLE 323 India Vapour Barrier Market, by Material, 2017-2022(US$ Bn)
TABLE 324 India Vapour Barrier Market, by Material, 2023-2030(US$ Bn)
TABLE 325 India Vapour Barrier Market, by Material, 2017-2022(Billion Units)
TABLE 326 India Vapour Barrier Market, by Material, 2023-2030(Billion Units)
TABLE 327 India Vapour Barrier Market, by Application, 2017-2022(US$ Bn)
TABLE 328 India Vapour Barrier Market, by Application, 2023-2030(US$ Bn)
TABLE 329 India Vapour Barrier Market, by Application, 2017-2022(Billion Units)
TABLE 330 India Vapour Barrier Market, by Application, 2023-2030(Billion Units)
TABLE 331 India Vapour Barrier Market, by Installation, 2017-2022(US$ Bn)
TABLE 332 India Vapour Barrier Market, by Installation, 2023-2030(US$ Bn)
TABLE 333 India Vapour Barrier Market, by Installation, 2017-2022(Billion Units)
TABLE 334 India Vapour Barrier Market, by Installation, 2023-2030(Billion Units)
TABLE 335 India Vapour Barrier Market, by End-Use Industry, 2017-2022(US$ Bn)
TABLE 336 India Vapour Barrier Market, by End-Use Industry, 2023-2030(US$ Bn)
TABLE 337 India Vapour Barrier Market, by End-Use Industry, 2017-2022(Billion Units)
TABLE 338 India Vapour Barrier Market, by End-Use Industry, 2023-2030(Billion Units)
TABLE 339 South Korea Vapour Barrier Market, by Material, 2017-2022(US$ Bn)
TABLE 340 South Korea Vapour Barrier Market, by Material, 2023-2030(US$ Bn)
TABLE 341 South Korea Vapour Barrier Market, by Material, 2017-2022(Billion Units)
TABLE 342 South Korea Vapour Barrier Market, by Material, 2023-2030(Billion Units)
TABLE 343 South Korea Vapour Barrier Market, by Application, 2017-2022(US$ Bn)
TABLE 344 South Korea Vapour Barrier Market, by Application, 2023-2030(US$ Bn)
TABLE 345 South Korea Vapour Barrier Market, by Application, 2017-2022(Billion Units)
TABLE 346 South Korea Vapour Barrier Market, by Application, 2023-2030(Billion Units)
TABLE 347 South Korea Vapour Barrier Market, by Installation, 2017-2022(US$ Bn)
TABLE 348 South Korea Vapour Barrier Market, by Installation, 2023-2030(US$ Bn)
TABLE 349 South Korea Vapour Barrier Market, by Installation, 2017-2022(Billion Units)
TABLE 350 South Korea Vapour Barrier Market, by Installation, 2023-2030(Billion Units)
TABLE 351 South Korea Vapour Barrier Market, by End-Use Industry, 2017-2022(US$ Bn)
TABLE 352 South Korea Vapour Barrier Market, by End-Use Industry, 2023-2030(US$ Bn)
TABLE 353 South Korea Vapour Barrier Market, by End-Use Industry, 2017-2022(Billion Units)
TABLE 354 South Korea Vapour Barrier Market, by End-Use Industry, 2023-2030(Billion Units)
TABLE 355 South-East Asia Vapour Barrier Market, by Material, 2017-2022(US$ Bn)
TABLE 356 South-East Asia Vapour Barrier Market, by Material, 2023-2030(US$ Bn)
TABLE 357 South-East Asia Vapour Barrier Market, by Material, 2017-2022(Billion Units)
TABLE 358 South-East Asia Vapour Barrier Market, by Material, 2023-2030(Billion Units)
TABLE 359 South-East Asia Vapour Barrier Market, by Application, 2017-2022(US$ Bn)
TABLE 360 South-East Asia Vapour Barrier Market, by Application, 2023-2030(US$ Bn)
TABLE 361 South-East Asia Vapour Barrier Market, by Application, 2017-2022(Billion Units)
TABLE 362 South-East Asia Vapour Barrier Market, by Application, 2023-2030(Billion Units)
TABLE 363 South-East Asia Vapour Barrier Market, by Installation, 2017-2022(US$ Bn)
TABLE 364 South-East Asia Vapour Barrier Market, by Installation, 2023-2030(US$ Bn)
TABLE 365 South-East Asia Vapour Barrier Market, by Installation, 2017-2022(Billion Units)
TABLE 366 South-East Asia Vapour Barrier Market, by Installation, 2023-2030(Billion Units)
TABLE 367 South-East Asia Vapour Barrier Market, by End-Use Industry, 2017-2022(US$ Bn)
TABLE 368 South-East Asia Vapour Barrier Market, by End-Use Industry, 2023-2030(US$ Bn)
TABLE 369 South-East Asia Vapour Barrier Market, by End-Use Industry, 2017-2022(Billion Units)
TABLE 370 South-East Asia Vapour Barrier Market, by End-Use Industry, 2023-2030(Billion Units)
TABLE 371 Rest of Asia Pacific Vapour Barrier Market, by Material, 2017-2022(US$ Bn)
TABLE 372 Rest of Asia Pacific Vapour Barrier Market, by Material, 2023-2030(US$ Bn)
TABLE 373 Rest of Asia Pacific Vapour Barrier Market, by Material, 2017-2022(Billion Units)
TABLE 374 Rest of Asia Pacific Vapour Barrier Market, by Material, 2023-2030(Billion Units)
TABLE 375 Rest of Asia Pacific Vapour Barrier Market, by Application, 2017-2022(US$ Bn)
TABLE 376 Rest of Asia Pacific Vapour Barrier Market, by Application, 2023-2030(US$ Bn)
TABLE 377 Rest of Asia Pacific Vapour Barrier Market, by Application, 2017-2022(Billion Units)
TABLE 378 Rest of Asia Pacific Vapour Barrier Market, by Application, 2023-2030(Billion Units)
TABLE 379 Rest of Asia Pacific Vapour Barrier Market, by Installation, 2017-2022(US$ Bn)
TABLE 380 Rest of Asia Pacific Vapour Barrier Market, by Installation, 2023-2030(US$ Bn)
TABLE 381 Rest of Asia Pacific Vapour Barrier Market, by Installation, 2017-2022(Billion Units)
TABLE 382 Rest of Asia Pacific Vapour Barrier Market, by Installation, 2023-2030(Billion Units)
TABLE 383 Rest of Asia Pacific Vapour Barrier Market, by End-Use Industry, 2017-2022(US$ Bn)
TABLE 384 Rest of Asia Pacific Vapour Barrier Market, by End-Use Industry, 2023-2030(US$ Bn)
TABLE 385 Rest of Asia Pacific Vapour Barrier Market, by End-Use Industry, 2017-2022(Billion Units)
TABLE 386 Rest of Asia Pacific Vapour Barrier Market, by End-Use Industry, 2023-2030(Billion Units)
TABLE 387 Latin America Vapour Barrier Market, by Material, 2017-2022(US$ Bn)
TABLE 388 Latin America Vapour Barrier Market, by Material, 2023-2030(US$ Bn)
TABLE 389 Latin America Vapour Barrier Market, by Material, 2017-2022(Billion Units)
TABLE 390 Latin America Vapour Barrier Market, by Material, 2023-2030(Billion Units)
TABLE 391 Latin America Vapour Barrier Market, by Application, 2017-2022(US$ Bn)
TABLE 392 Latin America Vapour Barrier Market, by Application, 2023-2030(US$ Bn)
TABLE 393 Latin America Vapour Barrier Market, by Application, 2017-2022(Billion Units)
TABLE 394 Latin America Vapour Barrier Market, by Application, 2023-2030(Billion Units)
TABLE 395 Latin America Vapour Barrier Market, by Installation, 2017-2022(US$ Bn)
TABLE 396 Latin America Vapour Barrier Market, by Installation, 2023-2030(US$ Bn)
TABLE 397 Latin America Vapour Barrier Market, by Installation, 2017-2022(Billion Units)
TABLE 398 Latin America Vapour Barrier Market, by Installation, 2023-2030(Billion Units)
TABLE 399 Latin America Vapour Barrier Market, by End-Use Industry, 2017-2022(US$ Bn)
TABLE 400 Latin America Vapour Barrier Market, by End-Use Industry, 2023-2030(US$ Bn)
TABLE 401 Latin America Vapour Barrier Market, by End-Use Industry, 2017-2022(Billion Units)
TABLE 402 Latin America Vapour Barrier Market, by End-Use Industry, 2023-2030(Billion Units)
TABLE 403 Latin America Vapour Barrier Market, by Country, 2017-2022(US$ Bn)
TABLE 404 Latin America Vapour Barrier Market, by Country, 2023-2030(US$ Bn)
TABLE 405 Latin America Vapour Barrier Market, by Country, 2017-2022(Billion Units)
TABLE 406 Latin America Vapour Barrier Market, by Country, 2023-2030(Billion Units)
TABLE 407 Brazil Vapour Barrier Market, by Material, 2017-2022(US$ Bn)
TABLE 408 Brazil Vapour Barrier Market, by Material, 2023-2030(US$ Bn)
TABLE 409 Brazil Vapour Barrier Market, by Material, 2017-2022(Billion Units)
TABLE 410 Brazil Vapour Barrier Market, by Material, 2023-2030(Billion Units)
TABLE 411 Brazil Vapour Barrier Market, by Application, 2017-2022(US$ Bn)
TABLE 412 Brazil Vapour Barrier Market, by Application, 2023-2030(US$ Bn)
TABLE 413 Brazil Vapour Barrier Market, by Application, 2017-2022(Billion Units)
TABLE 414 Brazil Vapour Barrier Market, by Application, 2023-2030(Billion Units)
TABLE 415 Brazil Vapour Barrier Market, by Installation, 2017-2022(US$ Bn)
TABLE 416 Brazil Vapour Barrier Market, by Installation, 2023-2030(US$ Bn)
TABLE 417 Brazil Vapour Barrier Market, by Installation, 2017-2022(Billion Units)
TABLE 418 Brazil Vapour Barrier Market, by Installation, 2023-2030(Billion Units)
TABLE 419 Brazil Vapour Barrier Market, by End-Use Industry, 2017-2022(US$ Bn)
TABLE 420 Brazil Vapour Barrier Market, by End-Use Industry, 2023-2030(US$ Bn)
TABLE 421 Brazil Vapour Barrier Market, by End-Use Industry, 2017-2022(Billion Units)
TABLE 422 Brazil Vapour Barrier Market, by End-Use Industry, 2023-2030(Billion Units)
TABLE 423 Argentina Vapour Barrier Market, by Material, 2017-2022(US$ Bn)
TABLE 424 Argentina Vapour Barrier Market, by Material, 2023-2030(US$ Bn)
TABLE 425 Argentina Vapour Barrier Market, by Material, 2017-2022(Billion Units)
TABLE 426 Argentina Vapour Barrier Market, by Material, 2023-2030(Billion Units)
TABLE 427 Argentina Vapour Barrier Market, by Application, 2017-2022(US$ Bn)
TABLE 428 Argentina Vapour Barrier Market, by Application, 2023-2030(US$ Bn)
TABLE 429 Argentina Vapour Barrier Market, by Application, 2017-2022(Billion Units)
TABLE 430 Argentina Vapour Barrier Market, by Application, 2023-2030(Billion Units)
TABLE 431 Argentina Vapour Barrier Market, by Installation, 2017-2022(US$ Bn)
TABLE 432 Argentina Vapour Barrier Market, by Installation, 2023-2030(US$ Bn)
TABLE 433 Argentina Vapour Barrier Market, by Installation, 2017-2022(Billion Units)
TABLE 434 Argentina Vapour Barrier Market, by Installation, 2023-2030(Billion Units)
TABLE 435 Argentina Vapour Barrier Market, by End-Use Industry, 2017-2022(US$ Bn)
TABLE 436 Argentina Vapour Barrier Market, by End-Use Industry, 2023-2030(US$ Bn)
TABLE 437 Argentina Vapour Barrier Market, by End-Use Industry, 2017-2022(Billion Units)
TABLE 438 Argentina Vapour Barrier Market, by End-Use Industry, 2023-2030(Billion Units)
TABLE 439 Rest of Latin America Vapour Barrier Market, by Material, 2017-2022(US$ Bn)
TABLE 440 Rest of Latin America Vapour Barrier Market, by Material, 2023-2030(US$ Bn)
TABLE 441 Rest of Latin America Vapour Barrier Market, by Material, 2017-2022(Billion Units)
TABLE 442 Rest of Latin America Vapour Barrier Market, by Material, 2023-2030(Billion Units)
TABLE 443 Rest of Latin America Vapour Barrier Market, by Application, 2017-2022(US$ Bn)
TABLE 444 Rest of Latin America Vapour Barrier Market, by Application, 2023-2030(US$ Bn)
TABLE 445 Rest of Latin America Vapour Barrier Market, by Application, 2017-2022(Billion Units)
TABLE 446 Rest of Latin America Vapour Barrier Market, by Application, 2023-2030(Billion Units)
TABLE 447 Rest of Latin America Vapour Barrier Market, by Installation, 2017-2022(US$ Bn)
TABLE 448 Rest of Latin America Vapour Barrier Market, by Installation, 2023-2030(US$ Bn)
TABLE 449 Rest of Latin America Vapour Barrier Market, by Installation, 2017-2022(Billion Units)
TABLE 450 Rest of Latin America Vapour Barrier Market, by Installation, 2023-2030(Billion Units)
TABLE 451 Rest of Latin America Vapour Barrier Market, by End-Use Industry, 2017-2022(US$ Bn)
TABLE 452 Rest of Latin America Vapour Barrier Market, by End-Use Industry, 2023-2030(US$ Bn)
TABLE 453 Rest of Latin America Vapour Barrier Market, by End-Use Industry, 2017-2022(Billion Units)
TABLE 454 Rest of Latin America Vapour Barrier Market, by End-Use Industry, 2023-2030(Billion Units)
TABLE 455
TABLE 456 Middle East and Africa Vapour Barrier Market, by Material, 2017-2022(US$ Bn)
TABLE 457 Middle East and Africa Vapour Barrier Market, by Material, 2023-2030(US$ Bn)
TABLE 458 Middle East and Africa Vapour Barrier Market, by Material, 2017-2022(Billion Units)
TABLE 459 Middle East and Africa Vapour Barrier Market, by Material, 2023-2030(Billion Units)
TABLE 460 Middle East and Africa Vapour Barrier Market, by Application, 2017-2022(US$ Bn)
TABLE 461 Middle East and Africa Vapour Barrier Market, by Application, 2023-2030(US$ Bn)
TABLE 462 Middle East and Africa Vapour Barrier Market, by Application, 2017-2022(Billion Units)
TABLE 463 Middle East and Africa Vapour Barrier Market, by Application, 2023-2030(Billion Units)
TABLE 464 Middle East and Africa Vapour Barrier Market, by Installation, 2017-2022(US$ Bn)
TABLE 465 Middle East and Africa Vapour Barrier Market, by Installation, 2023-2030(US$ Bn)
TABLE 466 Middle East and Africa Vapour Barrier Market, by Installation, 2017-2022(Billion Units)
TABLE 467 Middle East and Africa Vapour Barrier Market, by Installation, 2023-2030(Billion Units)
TABLE 468 Middle East and Africa Vapour Barrier Market, by End-Use Industry, 2017-2022(US$ Bn)
TABLE 469 Middle East and Africa Vapour Barrier Market, by End-Use Industry, 2017-2022(US$ Bn)
TABLE 470 Middle East and Africa Vapour Barrier Market, by End-Use Industry, 2023-2030(US$ Bn)
TABLE 471 Middle East and Africa Vapour Barrier Market, by End-Use Industry, 2017-2022(Billion Units)
TABLE 472 Middle East and Africa Vapour Barrier Market, by End-Use Industry, 2023-2030(Billion Units)
TABLE 473 Middle East and Africa Vapour Barrier Market, by Country, 2017-2022(US$ Bn)
TABLE 474 Middle East and Africa Vapour Barrier Market, by Country, 2023-2030(US$ Bn)
TABLE 475 Middle East and Africa Vapour Barrier Market, by Country, 2017-2022(Billion Units)
TABLE 476 Middle East and Africa Vapour Barrier Market, by Country, 2023-2030(Billion Units)
TABLE 477 GCC Countries Vapour Barrier Market, by Material, 2017-2022(US$ Bn)
TABLE 478 GCC Countries Vapour Barrier Market, by Material, 2023-2030(US$ Bn)
TABLE 479 GCC Countries Vapour Barrier Market, by Material, 2017-2022(Billion Units)
TABLE 480 GCC Countries Vapour Barrier Market, by Material, 2023-2030(Billion Units)
TABLE 481 GCC Countries Vapour Barrier Market, by Application, 2017-2022(US$ Bn)
TABLE 482 GCC Countries Vapour Barrier Market, by Application, 2023-2030(US$ Bn)
TABLE 483 GCC Countries Vapour Barrier Market, by Application, 2017-2022(Billion Units)
TABLE 484 GCC Countries Vapour Barrier Market, by Application, 2023-2030(Billion Units)
TABLE 485 GCC Countries Vapour Barrier Market, by Installation, 2017-2022(US$ Bn)
TABLE 486 GCC Countries Vapour Barrier Market, by Installation, 2023-2030(US$ Bn)
TABLE 487 GCC Countries Vapour Barrier Market, by Installation, 2017-2022(Billion Units)
TABLE 488 GCC Countries Vapour Barrier Market, by Installation, 2023-2030(Billion Units)
TABLE 489 GCC Countries Vapour Barrier Market, by End-Use Industry, 2023-2030(Billion Units)
TABLE 490 GCC Countries Vapour Barrier Market, by End-Use Industry, 2017-2022(US$ Bn)
TABLE 491 GCC Countries Vapour Barrier Market, by End-Use Industry, 2023-2030(US$ Bn)
TABLE 492 GCC Countries Vapour Barrier Market, by End-Use Industry, 2017-2022(Billion Units)
TABLE 493 GCC Countries Vapour Barrier Market, by End-Use Industry, 2023-2030(Billion Units)
TABLE 494 South Africa Vapour Barrier Market, by Material, 2017-2022(US$ Bn)
TABLE 495 South Africa Vapour Barrier Market, by Material, 2023-2030(US$ Bn)
TABLE 496 South Africa Vapour Barrier Market, by Material, 2017-2022(Billion Units)
TABLE 497 South Africa Vapour Barrier Market, by Material, 2023-2030(Billion Units)
TABLE 498 South Africa Vapour Barrier Market, by Application, 2017-2022(US$ Bn)
TABLE 499 South Africa Vapour Barrier Market, by Application, 2023-2030(US$ Bn)
TABLE 500 South Africa Vapour Barrier Market, by Application, 2017-2022(Billion Units)
TABLE 501 South Africa Vapour Barrier Market, by Application, 2023-2030(Billion Units)
TABLE 502 South Africa Vapour Barrier Market, by Installation, 2017-2022(US$ Bn)
TABLE 503 South Africa Vapour Barrier Market, by Installation, 2023-2030(US$ Bn)
TABLE 504 South Africa Vapour Barrier Market, by Installation, 2017-2022(Billion Units)
TABLE 505 South Africa Vapour Barrier Market, by Installation, 2023-2030(Billion Units)
TABLE 506 Rest of Middle East and Africa Vapour Barrier Market, by End-Use Industry, 2017-2022(US$ Bn)
TABLE 507 South Africa Vapour Barrier Market, by End-Use Industry, 2017-2022(US$ Bn)
TABLE 508 South Africa Vapour Barrier Market, by End-Use Industry, 2023-2030(US$ Bn)
TABLE 509 South Africa Vapour Barrier Market, by End-Use Industry, 2017-2022(Billion Units)
TABLE 510 South Africa Vapour Barrier Market, by End-Use Industry, 2023-2030(Billion Units)
TABLE 511 Rest of Middle East and Africa Vapour Barrier Market, by Material, 2017-2022(US$ Bn)
TABLE 512 Rest of Middle East and Africa Vapour Barrier Market, by Material, 2023-2030(US$ Bn)
TABLE 513 Rest of Middle East and Africa Vapour Barrier Market, by Material, 2017-2022(Billion Units)
TABLE 514 Rest of Middle East and Africa Vapour Barrier Market, by Material, 2023-2030(Billion Units)
TABLE 515 Rest of Middle East and Africa Vapour Barrier Market, by Application, 2017-2022(US$ Bn)
TABLE 516 Rest of Middle East and Africa Vapour Barrier Market, by Application, 2023-2030(US$ Bn)
TABLE 517 Rest of Middle East and Africa Vapour Barrier Market, by Application, 2017-2022(Billion Units)
TABLE 518 Rest of Middle East and Africa Vapour Barrier Market, by Application, 2023-2030(Billion Units)
TABLE 519 Rest of Middle East and Africa Vapour Barrier Market, by Installation, 2017-2022(US$ Bn)
TABLE 520 Rest of Middle East and Africa Vapour Barrier Market, by Installation, 2023-2030(US$ Bn)
TABLE 521 Rest of Middle East and Africa Vapour Barrier Market, by Installation, 2017-2022(Billion Units)
TABLE 522 Rest of Middle East and Africa Vapour Barrier Market, by Installation, 2023-2030(Billion Units)
TABLE 523 Rest of Middle East and Africa Vapour Barrier Market, by End-Use Industry, 2017-2022(US$ Bn)
TABLE 524 Rest of Middle East and Africa Vapour Barrier Market, by End-Use Industry, 2017-2022(US$ Bn)
TABLE 525 Rest of Middle East and Africa Vapour Barrier Market, by End-Use Industry, 2023-2030(US$ Bn)
TABLE 526 Rest of Middle East and Africa Vapour Barrier Market, by End-Use Industry, 2017-2022(Billion Units)
TABLE 527 Rest of Middle East and Africa Vapour Barrier Market, by End-Use Industry, 2023-2030(Billion Units)

Frequently Asked Questions

What is the current size of the global vapour barrier market?

The global vapour barrier market was valued at USD 10.9 Billion in 2022.

What is the expected growth rate of the vapour barrier market between 2023 and 2030?

The vapour barrier market is expected to grow at a CAGR of 5.20% between 2023 and 2030, reaching USD 15.5 Billion in 2030.

Which segment is leading the market share in terms of material?

Polymer sector is expected to account for approximately 25% of the market in 2022.

Which application segment governs the demand for vapour barriers in the world?

In 2022, the waterproofing sector dominated the market with a 15.4% share, also governs the market demand.

Which segment is expected to post the highest CAGR during the forecast period?

The membranes sheet segment is expected to post the highest CAGR during the forecast period.

Which region is fuelling the growth of the vapour barrier industry?

North America is fuelling the growth of the vapour barrier industry with maximum market share in 2022.

Who are the major players in the global vapour barrier market?

The top players include Carlisle Companies Inc., W.R. Meadows, Inc., 3M Company.  Other major players include DuPont de Nemours, Inc., Stego Industries, LLC, RPM International Inc.

What are the major market drivers of the vapour barrier industry?

Vapour barriers are necessary in construction projects, as well as in the repair and rehabilitation of existing structures are the major market drivers.

What are the major market restraints of the vapour barrier industry?

Moisture becoming trapped within the building shell and installation costs is the major market restraints.

What are the major market opportunities of the vapour barrier industry?

Energy-efficient structures and environmentally friendly building materials are the major opportunities in the vapour barrier industry.

Asia-Pacific Scaffolding Market

Published:
Report ID: 37595

Scaffolding Market

Published:
Report ID: 16765

Concrete Mixer Market

Published:
Report ID: 36728

Stone Processing Market

Published:
Report ID: 9819

Port Infrastructure Market

Published:
Report ID: 36311

Construction Extended Reality (XR) Market

Published:
Report ID: 36229

Construction Flooring Chemicals Market

Published:
Report ID: 36160

Saudi Arabia White Cement Market

Published:
Report ID: 35946

Australia Bathroom Fittings Market

Published:
Report ID: 35922

Asia Pacific Windows and Doors Market

Published:
Report ID: 35894

South Africa Elevators and Escalators Market

Published:
Report ID: 35885

Rimless Toilets Market

Published:
Report ID: 35401

Purchase Options

$2999
Delivery Format: Excel.
$4999
Designed for the individual purchaser.
$6999
Users located at a single corporate site or regional office.
$7999
Allowed for unlimited sharing globally within one company.
Smallform of Sample request

Have a question?

User Profile

Don’t settle for less – trust Mitul to help you find the best solution.

Report delivery within 24 to 48 hours

– Other Info –

What people say?-

User Review

I am very impressed with the information in this report. The author clearly did their research when they came up with this product and it has already given me a lot of ideas.

Jana Schmidt
CEDAR CX Technologies

– Connect with us –

Phone

+91 6232 49 3207


support

24/7 Research Support


sales@credenceresearch.com

– Research Methodology –

Going beyond the basics: advanced techniques in research methodology

– Trusted By –

Pepshi, LG, Nestle
Motorola, Honeywell, Johnson and johnson
LG Chem, SIEMENS, Pfizer
Unilever, Samsonite, QIAGEN