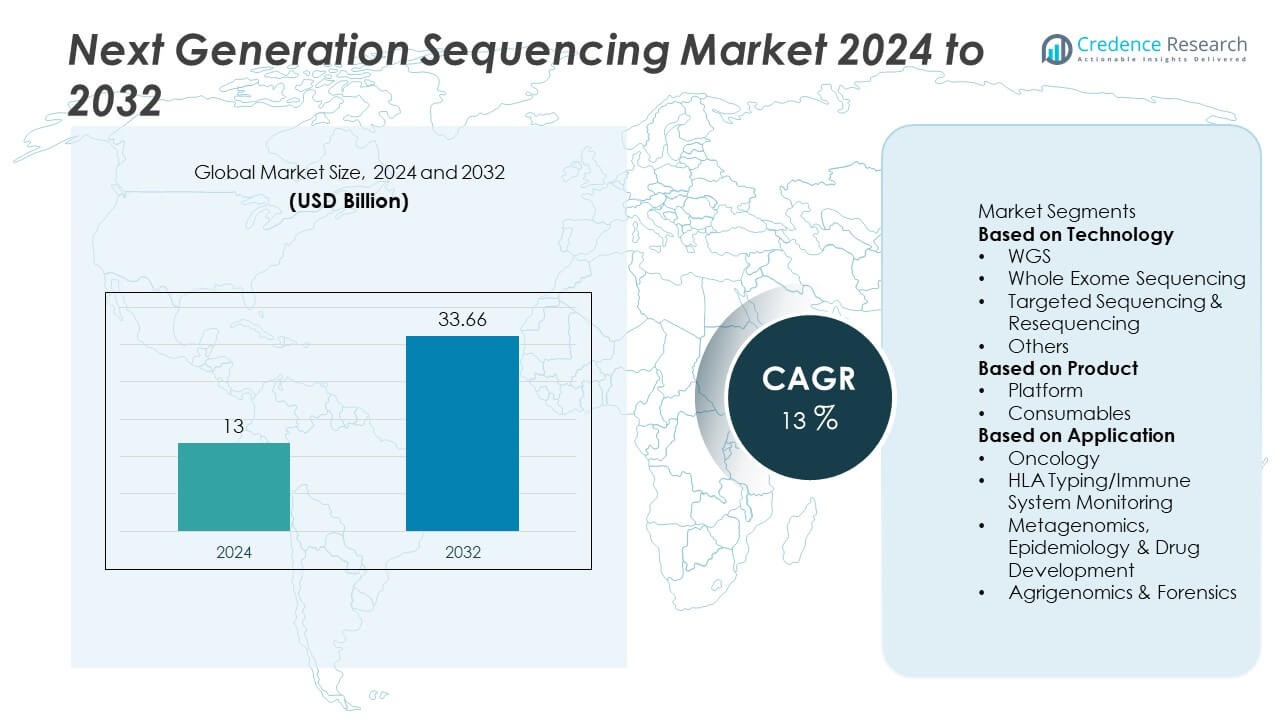
Home » Biotechnology » Next Generation Sequencing Market

Next Generation Sequencing Market By Technology (Sequencing by Synthesis, Sequencing by Ligation, Ion Semiconductor Sequencing, Nanopore Sequencing, Others), By Applications (Bioinformatics, Diagnostics, Agriculture and Animal Research, Drug Discovery, Genetic Research, Others (Clinical Bacteriology, Oncology, Etc.)), By End User (Research Institutes, Pharmaceuticals, Biotechnology Companies, Hospitals, Academic Institutes ), By Diagnostics (Cancer, Neonatal Screening, Infectious Disease, Reproductive Health, Genetic Testing), By Region – Growth, Future Prospects And Competitive Analysis 2020- 2030

Price: $4999

Published: | Report ID: 14469 | Report Format : PDF

Market Overview

The Next Generation Sequencing (NGS) market currently holds a significant valuation of USD 5,809.8 million (2022). It is anticipated that by 2030, the market will surge to an astounding USD 21,485.69 million, reflecting an impressive CAGR of 20.54% from 2023 through 2030. This robust growth signifies the rapid adoption of NGS technologies across various sectors, including genomics, diagnostics, and personalized medicine.

The market encompasses the development, manufacturing, and distribution of state-of-the-art NGS technologies, such as high-throughput sequencing platforms, reagents, and related services. These technologies find extensive utility in research institutions, clinical settings, and commercial entities. The market is propelled by an unwavering pursuit of precision, accuracy, and expediency in genomic sequencing, facilitating significant advancements in diagnostic capabilities, genetic research, and personalized medicine. As the NGS market continues its impressive growth trajectory, it becomes an increasingly indispensable component of the broader life sciences and healthcare sectors, underscoring the prominent shift towards data-driven and personalized approaches in these fields.

Market Growth Drivers and Trends

The expansion of the Next Generation Sequencing (NGS) market is being propelled by several key trends and growth drivers. One significant trend is the emergence of genomic medicine, which integrates genomics into medical practice and increases the demand for NGS technologies. As healthcare shifts towards more personalized and precise approaches, the importance of thorough and accurate genetic information becomes paramount. NGS enables comprehensive genomic profiling, empowering clinicians to deliver personalized and effective treatment plans.

Technological advancements in NGS platforms also contribute to the adoption of these technologies. Constant innovations in sequencing speed, accuracy, and cost-effectiveness drive this trend. Additionally, improved data analysis tools and software enhance the interpretation of complex genomic data, enabling more efficient analysis.

Furthermore, increasing research and development activities in genomics play a critical role in driving the growth of the NGS market. Public and private entities are investing more in genomic research, leading to a higher demand for high-throughput sequencing platforms and other NGS solutions.

The growing awareness and prevalence of genetic disorders worldwide further fuel the growth of the NGS market. The need for early and accurate diagnosis of genetic disorders creates a demand for NGS technologies.

Overall, these trends and growth drivers are propelling the expansion of the Next Generation Sequencing (NGS) market, driving innovation, and improving healthcare outcomes.

Design Element 2

Access crucial information at unmatched prices!

Request your free sample report today & start making informed decisions powered by Credence Research!

Download Free Sample
CTA Design Element 3

Market restraint factors

Despite the positive growth trajectory, certain market restraints have the potential to impede the progress of the Next Generation Sequencing (NGS) market. A primary constraint is the high cost associated with NGS technologies. The substantial investments required for initial equipment acquisition, along with ongoing maintenance and necessary reagents, can pose a significant barrier for many institutions, particularly those in developing regions. This challenge is further magnified when considering that the cost of NGS is influenced by various variables such as the size of the genome being sequenced, the level of coverage required, the sequencing technology utilized, and the bioinformatics analysis needed to process and interpret the data. Even with subsidies, the price of NGS, especially for whole-genome sequencing (WGS) or large-scale initiatives, remains considerably high.

Another major hindrance is the scarcity of skilled personnel. The operation and data interpretation of NGS technologies demand highly trained professionals. Unfortunately, there is a shortage of such professionals who possess the requisite expertise to effectively handle and interpret the vast amount of complex genomic data generated by NGS.

Data storage and management issues also present significant constraints. The sheer volume of data generated by NGS necessitates robust and secure data storage and management systems. Many organizations may encounter challenges related to data storage, data security, and privacy concerns.

Challenges and opportunities

The increasing adoption of personalized medicine and the growing utilization of genomic data in diagnostics and therapeutics present lucrative opportunities for market participants. Moreover, the rising demand for genetic testing in direct-to-consumer genomics, prenatal testing, and oncology indicates a promising expansion of the market. Bridging the gap between genomic data and clinical application holds significant potential to revolutionize healthcare delivery.

Another area of potential lies in the developing markets of Asia, Africa, and Latin America, which currently lack extensive infrastructure for genomic research and diagnostics but are making investments in healthcare sector development.

Despite these opportunities, certain challenges exist. Data security and privacy remain major concerns, given the need to store and analyze vast genomic datasets. The ethical implications of genome sequencing also pose a challenge, requiring the industry to address issues of consent, disclosure, and potential misuse of genetic information. Additionally, the industry faces the challenge of requiring specialized, highly skilled labor to operate next-generation sequencing (NGS) technologies and interpret their findings. Investing in training is crucial to building the necessary workforce capacity. Lastly, the high costs associated with NGS technologies may limit their accessibility, particularly in low and middle-income countries.

The future of the NGS market will depend on the industry’s ability to effectively capitalize on these opportunities and overcome the challenges. It will require a combination of technological innovation, strategic partnerships, effective regulatory frameworks, and intelligent investment. The next few years promise to be a dynamic and transformative period in the field of next-generation sequencing.

Regulatory Analysis

In the realm of Next Generation Sequencing (NGS), regulatory compliance plays a critical role that directly impacts market dynamics. Various global and regional regulatory bodies oversee the implementation and use of NGS technologies, with the primary ones being the U.S. Food and Drug Administration (FDA), the European Medicines Agency (EMA), and the China National Medical Products Administration (NMPA), among others. These organizations establish guidelines for NGS-based product development, clinical testing, and diagnostic applications, exerting significant influence on market operations.

The FDA has been actively establishing a regulatory pathway for NGS-based tests, striking a balance between ensuring patient safety and fostering innovation. The administration has released guidelines for the design, development, and validation of NGS-based in vitro diagnostics (IVDs) used for hereditary diseases as well as infectious disease diagnostics.

Similarly, the EMA regulates NGS technologies through its guidelines under the In Vitro Diagnostic Medical Devices Regulation (IVDR). The IVDR proposes more stringent post-market surveillance and places increased emphasis on clinical evidence, directly shaping NGS market trends in Europe.

In the rapidly expanding Chinese market, the NMPA has also implemented regulations for genetic testing products, including NGS technologies. The regulatory body continuously updates its guidelines to ensure the quality and safety of these products.

While these regulatory frameworks aim to ensure product safety and efficacy, they can also pose challenges for NGS manufacturers and service providers. Adhering to dynamic and stringent regulations can be time-consuming and costly, potentially impeding the rate of innovation and market expansion. Conversely, clear and supportive regulatory policies can expedite product approval processes, boost end-user confidence, and drive market growth. Therefore, understanding and navigating the regulatory landscape is crucial for stakeholders in the NGS market.

Competitive Analysis

Top participants profiled in the market:

  • 10X Genomics
  • BGI
  • Agilent Technologies, Inc.
  • Bio-Rad Laboratories
  • GenapSys Inc.
  • F. Hoffmann-La Roche
  • Illumina, Inc.
  • Oxford Nanopore Technologies
  • NanoString Technologies, Inc.
  • Pacific Biosciences of California, Inc.
  • Qiagen
  • PerkinElmer Inc.
  • Thermo Fisher Scientific.

Recent developments and news

2020:

  • June: Illumina, Inc. acquires BlueBee, a cloud-based software company offering genomics analysis solutions.
  • May: Roche acquires the early-stage sequencing technology firm Stratos Genomics, aiming to advance Roche’s nanopore sequencer development.

2021:

  • May: Illumina, Inc. collaborates with Next Generation Genomic Co., Ltd. to launch the VeriSeq NIPT Solution v2 in Thailand, a CE-IVD NGS-based noninvasive prenatal testing (NIPT).
  • February:
    • QIAGEN and INOVIO Pharmaceuticals extend their partnership to develop liquid biopsy-based companion diagnostic products to enhance INOVIO’s therapies using NGS technology.
    • Thermo Fisher Scientific forms a partnership with SPT Labtech Ltd., co-marketing Thermo Fisher’s NGS library preparation products.
  • June: QIAGEN N.V. partners with Verogen Inc. to enhance the automation of NGS library prep kits, expanding Biomek NGenuiS liquid handler applications. They aim to commercialize forensic workflows for NGS, merging QIAGEN’s QIAseq products with Verogen’s offerings.
  • September: Beckman Coulter, Inc. collaborates with Invitae Corporation to develop new applications for the Biomek NGeniuS System.
  • November: Beckman Coulter, Inc. teams up with Integrated DNA Technologies, Inc. to innovate the Biomek NGeniuS System, making NGS solutions more accessible.

2022:

  • Early: Illumina announces the NovaSeq Xp sequencing system, aiming to make whole-genome sequencing more affordable and revolutionize the industry.
  • February: Beckman Coulter, Inc. collaborates with Illumina, Inc. to develop new applications for the Biomek NGeniuS System.
  • Mid: Thermo Fisher Scientific introduces the Ion Torrent Genexus Dx, an NGS system for clinical diagnostic labs, offering results within a day.
  • November: Illumina partners with Twist Bioscience to introduce the Exome 2.0 Plus panel for disease research, packaging it with DNA library preparation reagents.

2023:

  • January:
    • BGI Genomics establishes a genomic research center in India, solidifying its presence in the Asian market.
    • QIAGEN partners with Helix OpCo, LLC, enhancing the adoption of NGS companion diagnostics in hereditary diseases.
  • March: QIAGEN teams up with Sophia Genetics to leverage NGS strengths, providing clients with superior QIAGEN NGS preparation kits.
  • Late: Oxford Nanopore Technologies unveils an upgraded MinION device with doubled sequencing capacity, enhancing long-read sequencing accessibility.

Segmentation Analysis

Geographically, the global market for next-generation sequencing is examined across various regional markets, including:

  • North America:
    • United States
    • Canada
  • Europe:
    • Germany
    • France
    • United Kingdom
    • Italy
    • Spain
    • Rest of Europe
  • Asia Pacific:
    • China
    • Japan
    • India
    • South Korea
    • Southeast Asia
    • Rest of Asia Pacific
  • Latin America:
    • Brazil
    • Mexico
    • Rest of Latin America
  • Middle East and Africa:
    • GCC Countries
    • South Africa
    • Rest of the Middle East and Africa

This study presents the market size and forecast for these regional and country-level markets for the period of 2020–2030. The report also includes market growth rates for the forecast period, considering 2021 as the base year.

In addition to quantitative information, this study provides qualitative information sets and assessment tools to facilitate a comprehensive analysis of the overall market scenario and future prospects. Readers can gain a better understanding of the global Next Generation Sequencing market by exploring insights such as market trends, drivers, challenges, and opportunities.

Moreover, the report offers tools like key player market positioning and an attractive investment proposition, providing readers with valuable insights into the competitive landscape of the global Next-Generation Sequencing market. The report concludes with a section featuring company profiles that highlight key information about the major players operating in the market. Furthermore, the report provides an in-depth analysis of the competitive environment and historical market size data for the years 2019 and 2020.

This research study provides a comprehensive view of the global Next Generation Sequencing market, offering market size estimates for the period from 2024 to 2030 while considering the factors mentioned above.

Based on the type of application, the next-generation sequencing market is segmented into:

  • Oncology
  • Genetic Screening
  • Infectious Diseases
  • Drug and biomarker discovery
  • Agriculture and animal research
  • Idiopathic Diseases
  • Others

Next-generation sequencing (NGS) technologies offer significant advantages in terms of cost-effectiveness, unparalleled sequencing speed, high resolution, and genomic analysis accuracy. Various applications of next-generation sequencing are broadly categorized into oncology, genetic screening, infectious diseases, drug and biomarker discovery, agriculture and animal research, idiopathic diseases, and others. Technological advancements in the next-generation sequencing market are expected to enable researchers to generate phase-resolved HLA sequences in single read cycles and provide insights into the less accessible regions of HLA genes.

Furthermore, the development of prenatal genome sequencing for the analysis of genetic anomalies and diseases is also expected to witness increased demand, thereby driving the genetic screening market. The growing incidence of cancer and infectious diseases, along with the increasing use of next-generation sequencing in developing biopharmaceuticals and drugs for their treatment, is further expected to drive the demand for next-generation sequencing. These factors are expected to have a significant impact on the sustained high growth of the next-generation sequencing market throughout the forecast period.

Based on the type of technology, the next-generation sequencing market is segmented into:

  • Whole Genome Sequencing
  • Targeted Resequencing
  • RNA Sequencing
  • Whole-exome sequencing
  • Sequencing from Scratch

Technologically, the approaches for any next-generation sequencing procedure can be categorized into whole genome sequencing, targeted resequencing, RNA sequencing, whole exome sequencing, and de novo sequencing. The primary difference between these approaches is the number of base pairs sequenced in a given sequencing cycle. With advancements in technology and the development of high-throughput sequencing platforms such as HiSeq and MiSeq, it has become increasingly efficient to sequence a larger number of base pairs in single-cycle reads.

Targeted resequencing focuses on sequencing genes that are less than 1 million base pairs in length, whereas technological advancements in NGS sequencing technology have enabled efficient and rapid sequencing capacity to read the entire human genome, which consists of 3 billion base pairs. Targeted resequencing currently holds the largest share in the global next-generation sequencing market due to its accuracy and increasing preference in research and development. De novo sequencing is anticipated to grow at the fastest rate during the forecast period due to its faster and more accurate characterization of any species compared to traditional methods.

Shape Your Report to Specific Countries or Regions & Enjoy 30% Off!

For the purpose of this study, the global next-generation sequencing market is classified into the following regions:

  • North America
  • Europe
  • Asia Pacific
  • Latin America
  • Middle East and Africa

The global next-generation sequencing market is segmented into six regional markets: North America, Europe, Asia Pacific, Latin America, the Middle East, and Africa. In the base year 2020, North America emerged as the largest revenue-generating market for next-generation sequencing, with the U.S. holding the largest market share. The market is primarily driven by technological advancements in the field of life sciences, the availability of commercial solutions for next-generation sequencing data analysis, and the presence of key players in the region.

Furthermore, government institutions’ extended support for genomic research in drug discovery and genetic screening is also contributing to the growth of the next-generation sequencing market in North America and Europe. Asia-Pacific is expected to witness the highest growth rate during the forecast period, driven by increasing medical awareness among the regional population, rising investments in healthcare development, and growing oncology and infectious disease research in the region.

Chapter No. 1 : Introduction  30

1.1.        Report Description  30

1.1.1.    Purpose of the Report 30

1.1.2.    USP & Key Offerings  30

1.2.        Key Benefits for Stakeholders  30

1.3.        Target Audience  31

1.4.        Report Scope  32

Chapter No. 2 : Executive Summary  34

2.1.        Next Generation Sequencing Market Snapshot  34

2.2.        Global Next Generation Sequencing Market, 2017 – 2022 (USD Million) 35

Chapter No. 3 : Impact Analysis of COVID 19 & Russia-Ukraine War on Next Generation Sequencing Market  36

3.1.        Impact Assessment of COVID-19 Pandemic, By Region  36

3.1.1.    Supply chain disruptions  36

3.1.2.    Demand fluctuations  36

3.1.3.    Shift in product mix  36

3.1.4.    Reduced industrial activity  36

3.1.5.    Temporary disruptions and delays  36

3.1.6.    Shift in focus towards essential services  36

3.2.        Russia-Ukraine War Impacts  37

3.2.1.    Uncertainty and economic instability  37

3.2.2.    Supply chain disruptions  37

3.2.3.    Regional market shifts  37

3.2.4.    Shift in government priorities  37

Chapter No. 4 : Next Generation Sequencing Market – Industry Analysis  38

4.1.        Introduction  38

4.2.        Market Drivers  39

4.2.1.    Driving Factor 1 Analysis  39

4.2.2.    Driving Factor 2 Analysis  40

4.3.        Market Restraints  41

4.3.1.    Restraining Factor Analysis  41

4.4.        Market Opportunities  42

4.4.1.    Market Opportunity Analysis  42

4.5.        Porter’s Five Forces Analysis  43

4.6.        Value Chain Analysis  44

4.7.        Buying Criteria  45

Chapter No. 5 : Analysis Competitive Landscape  46

5.1.        Company Market Share Analysis – 2022  46

5.1.1.    Global Next Generation Sequencing Market: Company Market Share, by Revenue2022  46

5.1.2.    Global Next Generation Sequencing Market: Top 6 Company Market Share, by Revenue2022  46

5.1.3.    Global Next Generation Sequencing Market: Top 3 Company Market Share, by Revenue2022  47

5.1.        Global Next Generation Sequencing Market Company Revenue Market Share, 2022  48

5.2.        Company Assessment Metrics, 2022  49

5.2.1.    Stars  49

5.2.2.    Emerging Leaders  49

5.2.3.    Pervasive Players  49

5.2.4.    Participants  49

5.3.        Start-ups /SMEs Assessment Metrics, 2022  49

5.3.1.    Progressive Companies  49

5.3.2.    Responsive Companies  49

5.3.3.    Dynamic Companies  49

5.3.4.    Starting Blocks  49

5.4.        Strategic Developments  50

5.4.1.    Acquisitions & Mergers  50

5.4.2.    New Product Launch  50

5.4.3.    Regional Expansion  50

5.5.        Key Players Product Matrix  51

Chapter No. 6 : PESTEL & Adjacent Market Analysis  52

6.1.        PESTEL  52

6.1.1.    Political Factors  52

6.1.2.    Economic Factors  52

6.1.3.    Social Factors  52

6.1.4.    Technological Factors  52

6.1.5.    Environmental Factors  52

6.1.6.    Legal Factors  52

6.2.        Adjacent Market Analysis  52

Chapter No. 7 : Next Generation Sequencing Market – By Type Segment Analysis  53

7.1.        Next Generation Sequencing Market Overview, by Type Segment  53

7.1.1.    Next Generation Sequencing Market Revenue Share, By Type, 2022 & 2030  54

7.1.2.    Next Generation Sequencing Market Attractiveness Analysis, By Type  55

7.1.3.    Incremental Revenue Growth Opportunity, by Type, 2023 – 2030  55

7.1.4.    Next Generation Sequencing Market Revenue, By Type, 2017, 2022, 2026 & 2030  56

7.2.        Sequencing Services  57

7.2.1.    Global Sequencing Services Next Generation Sequencing Market Revenue, By Region, 2017 – 2022 (USD Million) 58

7.2.2.    Global Sequencing Services Next Generation Sequencing Market Revenue, By Region, 2017 – 2022 (USD Million) 58

7.3.        Product By Technology  59

7.3.1.    Global Product By Technology Next Generation Sequencing Market Revenue, By Region, 2017 – 2022 (USD Million) 60

7.3.2.    Global Product By Technology Next Generation Sequencing Market Revenue, By Region, 2017 – 2022 (USD Million) 60

Chapter No. 8 : Next Generation Sequencing Market – By Application Segment Analysis  61

8.1.        Next Generation Sequencing Market Overview, by Application Segment  61

8.1.1.    Next Generation Sequencing Market Revenue Share, By Application, 2022 & 2030  62

8.1.2.    Next Generation Sequencing Market Attractiveness Analysis, By Application  63

8.1.3.    Incremental Revenue Growth Opportunity, by Application, 2023 – 2030  63

8.1.4.    Next Generation Sequencing Market Revenue, By Application, 2017, 2022, 2026 & 2030  64

8.2.        Bioinformatics  65

8.2.1.    Global Bioinformatics Next Generation Sequencing Market Revenue, By Region, 2017 – 2022 (USD Million) 66

8.2.2.    Global Bioinformatics Next Generation Sequencing Market Revenue, By Region, 2017 – 2022 (USD Million) 66

8.3.        Diagnostics  67

8.3.1.    Global Diagnostics Next Generation Sequencing Market Revenue, By Region, 2017 – 2022 (USD Million) 68

8.3.2.    Global Diagnostics Next Generation Sequencing Market Revenue, By Region, 2017 – 2022 (USD Million) 68

8.4.        Agriculture and Animal Research  69

8.4.1.    Global Agriculture and Animal Research Next Generation Sequencing Market Revenue, By Region, 2017 – 2022 (USD Million) 70

8.4.2.    Global Agriculture and Animal Research Next Generation Sequencing Market Revenue, By Region, 2017 – 2022 (USD Million) 70

8.5.        Drug Discovery  71

8.5.1.    Global Drug Discovery Next Generation Sequencing Market Revenue, By Region, 2017 – 2022 (USD Million) 72

8.5.2.    Global Drug Discovery Next Generation Sequencing Market Revenue, By Region, 2017 – 2022 (USD Million) 72

8.6.        Genetic Research  73

8.6.1.    Global Genetic Research Next Generation Sequencing Market Revenue, By Region, 2017 – 2022 (USD Million) 74

8.6.2.    Global Genetic Research Next Generation Sequencing Market Revenue, By Region, 2017 – 2022 (USD Million) 74

8.7.        Others (Clinical Bacteriology, Oncology,Etc.) 74

Chapter No. 9 : Next Generation Sequencing Market – By End-user Segment Analysis  75

9.1.        Next Generation Sequencing Market Overview, by End-user Segment  75

9.1.1.    Next Generation Sequencing Market Revenue Share, By End-user, 2022 & 2030  76

9.1.2.    Next Generation Sequencing Market Attractiveness Analysis, By End-user  77

9.1.3.    Incremental Revenue Growth Opportunity, by End-user, 2023 – 2030  77

9.1.4.    Next Generation Sequencing Market Revenue, By End-user, 2017, 2022, 2026 & 2030  78

9.2.        Research Institutes  79

9.2.1.    Global Research Institutes Next Generation Sequencing Market Revenue, By Region, 2017 – 2022 (USD Million) 80

9.2.2.    Global Research Institutes Next Generation Sequencing Market Revenue, By Region, 2017 – 2022 (USD Million) 80

9.3.        Pharmaceuticals  81

9.3.1.    Global Pharmaceuticals Next Generation Sequencing Market Revenue, By Region, 2017 – 2022 (USD Million) 82

9.3.2.    Global Pharmaceuticals Next Generation Sequencing Market Revenue, By Region, 2017 – 2022 (USD Million) 82

9.4.        Biotechnology Companies  83

9.4.1.    Global Biotechnology Companies Next Generation Sequencing Market Revenue, By Region, 2017 – 2022 (USD Million) 84

9.4.2.    Global Biotechnology Companies Next Generation Sequencing Market Revenue, By Region, 2017 – 2022 (USD Million) 84

9.5.        Hospitals  85

9.5.1.    Global Hospitals Next Generation Sequencing Market Revenue, By Region, 2017 – 2022 (USD Million) 86

9.5.2.    Global Hospitals Next Generation Sequencing Market Revenue, By Region, 2017 – 2022 (USD Million) 86

9.6.        Academic Institutes  87

9.6.1.    Global Academic Institutes Next Generation Sequencing Market Revenue, By Region, 2017 – 2022 (USD Million) 88

9.6.2.    Global Academic Institutes Next Generation Sequencing Market Revenue, By Region, 2017 – 2022 (USD Million) 88

Chapter No. 10 :              Next Generation Sequencing Market – By Technology Segment Analysis  89

10.1.     Next Generation Sequencing Market Overview, by Technology Segment  89

10.1.1.  Next Generation Sequencing Market Revenue Share, By Technology, 2022 & 2030  90

10.1.2.  Next Generation Sequencing Market Attractiveness Analysis, By Technology  91

10.1.3.  Incremental Revenue Growth Opportunity, by Technology, 2023 – 2030  91

10.1.4.  Next Generation Sequencing Market Revenue, By Technology, 2017, 2022, 2026 & 2030  92

10.2.     Sequencing by Synthesis  93

10.2.1.  Global Sequencing by Synthesis Next Generation Sequencing Market Revenue, By Region, 2017 – 2022 (USD Million) 94

10.2.2.  Global Sequencing by Synthesis Next Generation Sequencing Market Revenue, By Region, 2017 – 2022 (USD Million) 94

10.3.     Sequencing by Ligation  95

10.3.1.  Global Sequencing by Ligation Next Generation Sequencing Market Revenue, By Region, 2017 – 2022 (USD Million) 96

10.3.2.  Global Sequencing by Ligation Next Generation Sequencing Market Revenue, By Region, 2017 – 2022 (USD Million) 96

10.4.     Ion Semiconductor Sequencing  97

10.4.1.  Global Ion Semiconductor Sequencing Next Generation Sequencing Market Revenue, By Region, 2017 – 2022 (USD Million) 98

10.4.2.  Global Ion Semiconductor Sequencing Next Generation Sequencing Market Revenue, By Region, 2017 – 2022 (USD Million) 98

10.5.     Nanopore Sequencing  99

10.5.1.  Global Nanopore Sequencing Next Generation Sequencing Market Revenue, By Region, 2017 – 2022 (USD Million) 100

10.5.2.  Global Nanopore Sequencing Next Generation Sequencing Market Revenue, By Region, 2017 – 2022 (USD Million) 100

10.6.     Others  101

10.6.1.  Global Others Next Generation Sequencing Market Revenue, By Region, 2017 – 2022 (USD Million) 102

10.6.2.  Global Others Next Generation Sequencing Market Revenue, By Region, 2017 – 2022 (USD Million) 102

Chapter No. 11 :              Next Generation Sequencing Market – By Diagnostics Segment Analysis  103

11.1.     Next Generation Sequencing Market Overview, by Diagnostics Segment  103

11.1.1.  Next Generation Sequencing Market Revenue Share, By Diagnostics, 2022 & 2030  104

11.1.2.  Next Generation Sequencing Market Attractiveness Analysis, By Diagnostics  105

11.1.3.  Incremental Revenue Growth Opportunity, by Diagnostics, 2023 – 2030  105

11.1.4.  Next Generation Sequencing Market Revenue, By Diagnostics, 2017, 2022, 2026 & 2030  106

11.2.     Cancer  107

11.2.1.  Global Cancer Next Generation Sequencing Market Revenue, By Region, 2017 – 2022 (USD Million) 108

11.2.2.  Global Cancer Next Generation Sequencing Market Revenue, By Region, 2017 – 2022 (USD Million) 108

11.3.     Neonatal Screening  109

11.3.1.  Global Neonatal Screening Next Generation Sequencing Market Revenue, By Region, 2017 – 2022 (USD Million) 110

11.3.2.  Global Neonatal Screening Next Generation Sequencing Market Revenue, By Region, 2017 – 2022 (USD Million) 110

11.4.     Infectious Disease  111

11.4.1.  Global Infectious Disease Next Generation Sequencing Market Revenue, By Region, 2017 – 2022 (USD Million) 112

11.4.2.  Global Infectious Disease Next Generation Sequencing Market Revenue, By Region, 2017 – 2022 (USD Million) 112

11.5.     Reproductive Health  113

11.5.1.  Global Reproductive Health Next Generation Sequencing Market Revenue, By Region, 2017 – 2022 (USD Million) 114

11.5.2.  Global Reproductive Health Next Generation Sequencing Market Revenue, By Region, 2017 – 2022 (USD Million) 114

11.6.     Genetic Testing  115

11.6.1.  Global Genetic Testing Next Generation Sequencing Market Revenue, By Region, 2017 – 2022 (USD Million) 116

11.6.2.  Global Genetic Testing Next Generation Sequencing Market Revenue, By Region, 2017 – 2022 (USD Million) 116

Chapter No. 12 :              Next Generation Sequencing Market – Regional Analysis  117

12.1.     Next Generation Sequencing Market Overview, by Regional Segments  117

12.2.     Region  118

12.2.1.  Global Next Generation Sequencing Market Revenue Share, By Region, 2022 & 2030  118

12.2.2.  Next Generation Sequencing Market Attractiveness Analysis, By Region  119

12.2.3.  Incremental Revenue Growth Opportunity, by Region, 2023 – 2030  119

12.2.4.  Next Generation Sequencing Market Revenue, By Region, 2017, 2022, 2026 & 2030  120

12.2.5.  Global Next Generation Sequencing Market Revenue, By Region, 2017 – 2022 (USD Million) 121

12.2.6.  Global Next Generation Sequencing Market Revenue, By Region, 2023 – 2030 (USD Million) 121

12.3.     Type  122

12.3.1.  Global Next Generation Sequencing Market Revenue, By Type, 2017 – 2022 (USD Million) 122

12.3.2.  Global Next Generation Sequencing Market Revenue, By Type, 2023 – 2030 (USD Million) 122

12.4.     Application  123

12.4.1.  Global Next Generation Sequencing Market Revenue, By Application, 2017 – 2022 (USD Million) 123

12.4.2.  Global Next Generation Sequencing Market Revenue, By Application, 2023 – 2030 (USD Million) 123

12.5.     End-user  124

12.5.1.  Global Next Generation Sequencing Market Revenue, By End-user, 2017 – 2022 (USD Million) 124

12.5.2.  Global Next Generation Sequencing Market Revenue, By End-user, 2023 – 2030 (USD Million) 124

12.6.     Technology  125

12.6.1.  Global Next Generation Sequencing Market Revenue, By Technology, 2017 – 2022 (USD Million) 125

12.6.2.  Global Next Generation Sequencing Market Revenue, By Technology, 2023 – 2030 (USD Million) 125

12.7.     Diagnostics  126

12.7.1.  Global Next Generation Sequencing Market Revenue, By Diagnostics, 2017 – 2022 (USD Million) 126

12.7.2.  Global Next Generation Sequencing Market Revenue, By Diagnostics, 2023 – 2030 (USD Million) 126

Chapter No. 13 :              Next Generation Sequencing Market – North America  127

13.1.     North America  127

13.1.     Key Highlights  127

13.1.1.  North America Next Generation Sequencing Market Revenue, By Country, 2017 – 2022 (USD Million) 128

13.1.2.  North America Next Generation Sequencing Market Revenue, By Type, 2017 – 2022 (USD Million) 129

13.1.3.  North America Next Generation Sequencing Market Revenue, By Application, 2017 – 2022 (USD Million) 130

13.1.4.  North America Next Generation Sequencing Market Revenue, By End-user, 2017 – 2022 (USD Million) 131

13.1.5.  North America Next Generation Sequencing Market Revenue, By Technology, 2017 – 2022 (USD Million) 132

13.1.6.  North America Next Generation Sequencing Market Revenue, By Diagnostics, 2017 – 2022 (USD Million) 133

13.1.7.  U.S. 134

13.1.8.  Canada  134

13.1.9.  Mexico  134

Chapter No. 14 :              Next Generation Sequencing Market – Europe  135

14.1.     Europe  135

14.2.     Key Highlights  135

14.2.1.  Europe Next Generation Sequencing Market Revenue, By Country, 2017 – 2022 (USD Million) 136

14.2.2.  Europe Next Generation Sequencing Market Revenue, By Type, 2017 – 2022 (USD Million) 138

14.2.3.  Europe Next Generation Sequencing Market Revenue, By Application, 2017 – 2022 (USD Million) 139

14.2.4.  Europe Next Generation Sequencing Market Revenue, By End-user, 2017 – 2022 (USD Million) 140

14.2.5.  Europe Next Generation Sequencing Market Revenue, By Technology, 2017 – 2022 (USD Million) 141

14.2.6.  Europe Next Generation Sequencing Market Revenue, By Diagnostics, 2017 – 2022 (USD Million) 142

14.2.7.  UK  143

14.2.8.  France  143

14.2.9.  Germany  143

14.2.10.              Italy  143

14.2.11.              Spain  143

14.2.12.              Russia  143

14.2.13.              BENELUX  143

14.2.14.              Sweden  143

14.2.15.              Denmark  143

14.2.16.              Poland  143

14.2.17.              Austria  143

14.2.18.              Rest of Europe  143

Chapter No. 15 :              Next Generation Sequencing Market – Asia Pacific  144

15.1.     Asia Pacific  144

15.2.     Key Highlights  144

15.2.1.  Asia Pacific Next Generation Sequencing Market Revenue, By Country, 2017 – 2022 (USD Million) 145

15.2.2.  Asia Pacific Next Generation Sequencing Market Revenue, By Type, 2017 – 2022 (USD Million) 147

15.2.3.  Asia Pacific Next Generation Sequencing Market Revenue, By Application, 2017 – 2022 (USD Million) 148

15.2.4.  Asia Pacific Next Generation Sequencing Market Revenue, By End-user, 2017 – 2022 (USD Million) 149

15.2.5.  Asia Pacific Next Generation Sequencing Market Revenue, By Technology, 2017 – 2022 (USD Million) 150

15.2.6.  Asia Pacific Next Generation Sequencing Market Revenue, By Diagnostics, 2017 – 2022 (USD Million) 151

15.2.7.  China  152

15.2.8.  Japan  152

15.2.9.  South Korea  152

15.2.10.              India  152

15.2.11.              Thailand  152

15.2.12.              Indonesia  152

15.2.13.              Vietnam    152

15.2.14.              Malaysia  152

15.2.15.              Philippines  152

15.2.16.              Taiwan  152

15.2.17.              Rest of Asia Pacific  152

Chapter No. 16 :              Next Generation Sequencing Market – Latin America  153

16.1.     Latin America  153

16.2.     Key Highlights  153

16.2.1.  Latin America Next Generation Sequencing Market Revenue, By Country, 2017 – 2022 (USD Million) 154

16.2.2.  Latin America Next Generation Sequencing Market Revenue, By Type, 2017 – 2022 (USD Million) 155

16.2.3.  Latin America Next Generation Sequencing Market Revenue, By Application, 2017 – 2022 (USD Million) 156

16.2.4.  Latin America Next Generation Sequencing Market Revenue, By End-user, 2017 – 2022 (USD Million) 157

16.2.5.  Latin America Next Generation Sequencing Market Revenue, By Technology, 2017 – 2022 (USD Million) 158

16.2.6.  Latin America Next Generation Sequencing Market Revenue, By Diagnostics, 2017 – 2022 (USD Million) 159

16.2.7.  Brazil 160

16.2.8.  Argentina  160

16.2.9.  Colombia  160

16.2.10.              Chile  160

16.2.11.              Peru  160

16.2.12.              Rest of Latin America  160

Chapter No. 17 :              Next Generation Sequencing Market – Middle East  161

17.1.     The Middle-East  161

17.2.     Key Highlights  161

17.2.1.  Middle East Next Generation Sequencing Market Revenue, By Country, 2017 – 2022 (USD Million) 162

17.2.2.  Middle East Next Generation Sequencing Market Revenue, By Type, 2017 – 2022 (USD Million) 163

17.2.3.  Middle East Next Generation Sequencing Market Revenue, By Application, 2017 – 2022 (USD Million) 164

17.2.4.  Middle East Next Generation Sequencing Market Revenue, By End-user, 2017 – 2022 (USD Million) 165

17.2.5.  Middle East Next Generation Sequencing Market Revenue, By Technology, 2017 – 2022 (USD Million) 166

17.2.6.  Middle East Next Generation Sequencing Market Revenue, By Diagnostics, 2017 – 2022 (USD Million) 167

17.2.7.  GCC Countries  168

17.2.8.  Israel 168

17.2.9.  Turkey  168

17.2.10.              Iran  168

17.2.11.              Rest of Middle East & Africa  168

Chapter No. 18 :              Next Generation Sequencing Market – Africa  169

18.1.     Africa  169

18.2.     Key Highlights  169

18.2.1.  Africa Next Generation Sequencing Market Revenue, By Country, 2017 – 2022 (USD Million) 170

18.2.2.  Africa Next Generation Sequencing Market Revenue, By Type, 2017 – 2022 (USD Million) 171

18.2.3.  Africa Next Generation Sequencing Market Revenue, By Application, 2017 – 2022 (USD Million) 172

18.2.4.  Africa Next Generation Sequencing Market Revenue, By End-user, 2017 – 2022 (USD Million) 173

18.2.5.  Africa Next Generation Sequencing Market Revenue, By Technology, 2017 – 2022 (USD Million) 174

18.2.6.  Africa Next Generation Sequencing Market Revenue, By Diagnostics, 2017 – 2022 (USD Million) 175

18.2.7.  South Africa  176

18.2.8.  Egypt 176

18.2.9.  Nigeria  176

18.2.10.              Algeria  176

18.2.11.              Morocco  176

18.2.12.              Rest of Africa  176

Chapter No. 19 :              Company Profiles  177

19.1.     Illumina  177

19.1.1.  Company Overview   177

19.1.2.  Product Portfolio  177

19.1.3.  Swot Analysis  177

19.1.4.  Business Strategy  178

19.1.5.  Financial Overview   178

19.2.     F. Hoffman-La Roche Ltd. 179

19.3.     QIAGEN   179

19.4.     Thermo Fisher Scientific, Inc. 179

19.5.     Bio-Rad Laboratories, Inc. 179

19.6.     Oxford Nanopore Technologies  179

19.7.     PierianDx  179

19.8.     Genomatix GmbH   179

19.9.     DNASTAR, Inc. 179

19.10.   Perkin Elmer, Inc. 179

19.11.   Eurofins GATC Biotech GmbH   179

19.12.   BGI 179

Chapter No. 20 :              Research Methodology  180

20.1.     Research Methodology  180

20.2.     Phase I – Secondary Research  181

20.3.     Phase II – Data Modeling  181

20.3.1.  Company Share Analysis Model 182

20.3.2.  Revenue Based Modeling  182

20.4.     Phase III – Primary Research  183

20.5.     Research Limitations  184

20.5.1.  Assumptions  184


List of Figures

FIG NO. 1.           Global Next Generation Sequencing Market Revenue, 2017 – 2022 (USD Million) 35

FIG NO. 2.           Porter’s Five Forces Analysis for Global Next Generation Sequencing Market 43

FIG NO. 3.           Value Chain Analysis for Global Next Generation Sequencing Market 44

FIG NO. 4.           Company Share Analysis, 2022  46

FIG NO. 5.           Company Share Analysis, 2022  46

FIG NO. 6.           Company Share Analysis, 2022  47

FIG NO. 7.           Next Generation Sequencing Market – Company Revenue Market Share, 2022  48

FIG NO. 8.           Next Generation Sequencing Market Revenue Share, By Type, 2022 & 2030  54

FIG NO. 9.           Market Attractiveness Analysis, By Type  55

FIG NO. 10.        Incremental Revenue Growth Opportunity by Type  55

FIG NO. 11.        Next Generation Sequencing Market Revenue, By Type, 2017, 2022, 2026 & 2030  56

FIG NO. 12.        Global Next Generation Sequencing Market for Sequencing Services, Revenue (USD Million) 2017 – 2030  57

FIG NO. 13.        Global Next Generation Sequencing Market for Product By Technology, Revenue (USD Million) 2017 – 2030  59

FIG NO. 14.        Next Generation Sequencing Market Revenue Share, By Application, 2022 & 2030  62

FIG NO. 15.        Market Attractiveness Analysis, By Application  63

FIG NO. 16.        Incremental Revenue Growth Opportunity by Application  63

FIG NO. 17.        Next Generation Sequencing Market Revenue, By Application, 2017, 2022, 2026 & 2030  64

FIG NO. 18.        Global Next Generation Sequencing Market for Bioinformatics, Revenue (USD Million) 2017 – 2030  65

FIG NO. 19.        Global Next Generation Sequencing Market for Diagnostics, Revenue (USD Million) 2017 – 2030  67

FIG NO. 20.        Global Next Generation Sequencing Market for Agriculture and Animal Research, Revenue (USD Million) 2017 – 2030  69

FIG NO. 21.        Global Next Generation Sequencing Market for Drug Discovery, Revenue (USD Million) 2017 – 2030  71

FIG NO. 22.        Global Next Generation Sequencing Market for Genetic Research, Revenue (USD Million) 2017 – 2030  73

FIG NO. 23.        Next Generation Sequencing Market Revenue Share, By End-user, 2022 & 2030  76

FIG NO. 24.        Market Attractiveness Analysis, By End-user  77

FIG NO. 25.        Incremental Revenue Growth Opportunity by End-user  77

FIG NO. 26.        Next Generation Sequencing Market Revenue, By End-user, 2017, 2022, 2026 & 2030  78

FIG NO. 27.        Global Next Generation Sequencing Market for Research Institutes, Revenue (USD Million) 2017 – 2030  79

FIG NO. 28.        Global Next Generation Sequencing Market for Pharmaceuticals, Revenue (USD Million) 2017 – 2030  81

FIG NO. 29.        Global Next Generation Sequencing Market for Biotechnology Companies, Revenue (USD Million) 2017 – 2030  83

FIG NO. 30.        Global Next Generation Sequencing Market for Hospitals, Revenue (USD Million) 2017 – 2030  85

FIG NO. 31.        Global Next Generation Sequencing Market for Academic Institutes, Revenue (USD Million) 2017 – 2030  87

FIG NO. 32.        Next Generation Sequencing Market Revenue Share, By Technology, 2022 & 2030  90

FIG NO. 33.        Market Attractiveness Analysis, By Technology  91

FIG NO. 34.        Incremental Revenue Growth Opportunity by Technology  91

FIG NO. 35.        Next Generation Sequencing Market Revenue, By Technology, 2017, 2022, 2026 & 2030  92

FIG NO. 36.        Global Next Generation Sequencing Market for Sequencing by Synthesis, Revenue (USD Million) 2017 – 2030  93

FIG NO. 37.        Global Next Generation Sequencing Market for Sequencing by Ligation, Revenue (USD Million) 2017 – 2030  95

FIG NO. 38.        Global Next Generation Sequencing Market for Ion Semiconductor Sequencing, Revenue (USD Million) 2017 – 2030  97

FIG NO. 39.        Global Next Generation Sequencing Market for Nanopore Sequencing, Revenue (USD Million) 2017 – 2030  99

FIG NO. 40.        Global Next Generation Sequencing Market for Others, Revenue (USD Million) 2017 – 2030  101

FIG NO. 41.        Next Generation Sequencing Market Revenue Share, By Diagnostics, 2022 & 2030  104

FIG NO. 42.        Market Attractiveness Analysis, By Diagnostics  105

FIG NO. 43.        Incremental Revenue Growth Opportunity by Diagnostics  105

FIG NO. 44.        Next Generation Sequencing Market Revenue, By Diagnostics, 2017, 2022, 2026 & 2030  106

FIG NO. 45.        Global Next Generation Sequencing Market for Cancer, Revenue (USD Million) 2017 – 2030  107

FIG NO. 46.        Global Next Generation Sequencing Market for Neonatal Screening, Revenue (USD Million) 2017 – 2030  109

FIG NO. 47.        Global Next Generation Sequencing Market for Infectious Disease, Revenue (USD Million) 2017 – 2030  111

FIG NO. 48.        Global Next Generation Sequencing Market for Reproductive Health, Revenue (USD Million) 2017 – 2030  113

FIG NO. 49.        Global Next Generation Sequencing Market for Genetic Testing, Revenue (USD Million) 2017 – 2030  115

FIG NO. 50.        Global Next Generation Sequencing Market Revenue Share, By Region, 2022 & 2030  118

FIG NO. 51.        Market Attractiveness Analysis, By Region  119

FIG NO. 52.        Incremental Revenue Growth Opportunity by Region  119

FIG NO. 53.        Next Generation Sequencing Market Revenue, By Region, 2017, 2022, 2026 & 2030  120

FIG NO. 54.        North America Next Generation Sequencing Market Revenue, 2017 – 2022 (USD Million) 127

FIG NO. 55.        Europe Next Generation Sequencing Market Revenue, 2017 – 2022 (USD Million) 135

FIG NO. 56.        Asia Pacific Next Generation Sequencing Market Revenue, 2017 – 2022 (USD Million) 144

FIG NO. 57.        Latin America Next Generation Sequencing Market Revenue, 2017 – 2022 (USD Million) 153

FIG NO. 58.        The Middle-East Next Generation Sequencing Market Revenue, 2017 – 2022 (USD Million) 161

FIG NO. 59.        Africa Next Generation Sequencing Market Revenue, 2017 – 2022 (USD Million) 169

FIG NO. 60.        Research Methodology – Detailed View   180

FIG NO. 61.        Research Methodology  181


List of Tables

TABLE NO. 1. :   Global Next Generation Sequencing Market: Snapshot 33

TABLE NO. 2. :   Drivers for the Next Generation Sequencing Market: Impact Analysis  38

TABLE NO. 3. :   Restraints for the Next Generation Sequencing Market: Impact Analysis  40

TABLE NO. 4. :   Global Sequencing Services Next Generation Sequencing Market Revenue, By Region, 2017 – 2022 (USD Million) 57

TABLE NO. 5. :   Global Sequencing Services Next Generation Sequencing Market Revenue, By Region, 2023– 2030 (USD Million) 57

TABLE NO. 6. :   Global Product By Technology Next Generation Sequencing Market Revenue, By Region, 2017 – 2022 (USD Million) 59

TABLE NO. 7. :   Global Product By Technology Next Generation Sequencing Market Revenue, By Region, 2023– 2030 (USD Million) 59

TABLE NO. 8. :   Global Bioinformatics Next Generation Sequencing Market Revenue, By Region, 2017 – 2022 (USD Million) 65

TABLE NO. 9. :   Global Bioinformatics Next Generation Sequencing Market Revenue, By Region, 2023– 2030 (USD Million) 65

TABLE NO. 10. : Global Diagnostics Next Generation Sequencing Market Revenue, By Region, 2017 – 2022 (USD Million) 67

TABLE NO. 11. : Global Diagnostics Next Generation Sequencing Market Revenue, By Region, 2023– 2030 (USD Million) 67

TABLE NO. 12. : Global Agriculture and Animal Research Next Generation Sequencing Market Revenue, By Region, 2017 – 2022 (USD Million) 69

TABLE NO. 13. : Global Agriculture and Animal Research Next Generation Sequencing Market Revenue, By Region, 2023– 2030 (USD Million) 69

TABLE NO. 14. : Global Drug Discovery Next Generation Sequencing Market Revenue, By Region, 2017 – 2022 (USD Million) 71

TABLE NO. 15. : Global Drug Discovery Next Generation Sequencing Market Revenue, By Region, 2023– 2030 (USD Million) 71

TABLE NO. 16. : Global Genetic Research Next Generation Sequencing Market Revenue, By Region, 2017 – 2022 (USD Million) 73

TABLE NO. 17. : Global Genetic Research Next Generation Sequencing Market Revenue, By Region, 2023– 2030 (USD Million) 73

TABLE NO. 18. : Global Research Institutes Next Generation Sequencing Market Revenue, By Region, 2017 – 2022 (USD Million) 79

TABLE NO. 19. : Global Research Institutes Next Generation Sequencing Market Revenue, By Region, 2023– 2030 (USD Million) 79

TABLE NO. 20. : Global Pharmaceuticals Next Generation Sequencing Market Revenue, By Region, 2017 – 2022 (USD Million) 81

TABLE NO. 21. : Global Pharmaceuticals Next Generation Sequencing Market Revenue, By Region, 2023– 2030 (USD Million) 81

TABLE NO. 22. : Global Biotechnology Companies Next Generation Sequencing Market Revenue, By Region, 2017 – 2022 (USD Million) 83

TABLE NO. 23. : Global Biotechnology Companies Next Generation Sequencing Market Revenue, By Region, 2023– 2030 (USD Million) 83

TABLE NO. 24. : Global Hospitals Next Generation Sequencing Market Revenue, By Region, 2017 – 2022 (USD Million) 85

TABLE NO. 25. : Global Hospitals Next Generation Sequencing Market Revenue, By Region, 2023– 2030 (USD Million) 85

TABLE NO. 26. : Global Academic Institutes Next Generation Sequencing Market Revenue, By Region, 2017 – 2022 (USD Million) 87

TABLE NO. 27. : Global Academic Institutes Next Generation Sequencing Market Revenue, By Region, 2023– 2030 (USD Million) 87

TABLE NO. 28. : Global Sequencing by Synthesis Next Generation Sequencing Market Revenue, By Region, 2017 – 2022 (USD Million) 93

TABLE NO. 29. : Global Sequencing by Synthesis Next Generation Sequencing Market Revenue, By Region, 2023– 2030 (USD Million) 93

TABLE NO. 30. : Global Sequencing by Ligation Next Generation Sequencing Market Revenue, By Region, 2017 – 2022 (USD Million) 95

TABLE NO. 31. : Global Sequencing by Ligation Next Generation Sequencing Market Revenue, By Region, 2023– 2030 (USD Million) 95

TABLE NO. 32. : Global Ion Semiconductor Sequencing Next Generation Sequencing Market Revenue, By Region, 2017 – 2022 (USD Million) 97

TABLE NO. 33. : Global Ion Semiconductor Sequencing Next Generation Sequencing Market Revenue, By Region, 2023– 2030 (USD Million) 97

TABLE NO. 34. : Global Nanopore Sequencing Next Generation Sequencing Market Revenue, By Region, 2017 – 2022 (USD Million) 99

TABLE NO. 35. : Global Nanopore Sequencing Next Generation Sequencing Market Revenue, By Region, 2023– 2030 (USD Million) 99

TABLE NO. 36. : Global Others Next Generation Sequencing Market Revenue, By Region, 2017 – 2022 (USD Million) 101

TABLE NO. 37. : Global Others Next Generation Sequencing Market Revenue, By Region, 2023– 2030 (USD Million) 101

TABLE NO. 38. : Global Cancer Next Generation Sequencing Market Revenue, By Region, 2017 – 2022 (USD Million) 107

TABLE NO. 39. : Global Cancer Next Generation Sequencing Market Revenue, By Region, 2023– 2030 (USD Million) 107

TABLE NO. 40. : Global Neonatal Screening Next Generation Sequencing Market Revenue, By Region, 2017 – 2022 (USD Million) 109

TABLE NO. 41. : Global Neonatal Screening Next Generation Sequencing Market Revenue, By Region, 2023– 2030 (USD Million) 109

TABLE NO. 42. : Global Infectious Disease Next Generation Sequencing Market Revenue, By Region, 2017 – 2022 (USD Million) 111

TABLE NO. 43. : Global Infectious Disease Next Generation Sequencing Market Revenue, By Region, 2023– 2030 (USD Million) 111

TABLE NO. 44. : Global Reproductive Health Next Generation Sequencing Market Revenue, By Region, 2017 – 2022 (USD Million) 113

TABLE NO. 45. : Global Reproductive Health Next Generation Sequencing Market Revenue, By Region, 2023– 2030 (USD Million) 113

TABLE NO. 46. : Global Genetic Testing Next Generation Sequencing Market Revenue, By Region, 2017 – 2022 (USD Million) 115

TABLE NO. 47. : Global Genetic Testing Next Generation Sequencing Market Revenue, By Region, 2023– 2030 (USD Million) 115

TABLE NO. 48. : Global Next Generation Sequencing Market Revenue, By Region, 2017 – 2022 (USD Million) 120

TABLE NO. 49. : Global Next Generation Sequencing Market Revenue, By Region, 2023– 2030 (USD Million) 120

TABLE NO. 50. : Global Next Generation Sequencing Market Revenue, By Type, 2017 – 2022 (USD Million) 121

TABLE NO. 51. : Global Next Generation Sequencing Market Revenue, By Type, 2023– 2030 (USD Million) 121

TABLE NO. 52. : Global Next Generation Sequencing Market Revenue, By Application, 2017 – 2022 (USD Million) 122

TABLE NO. 53. : Global Next Generation Sequencing Market Revenue, By Application, 2023– 2030 (USD Million) 122

TABLE NO. 54. : Global Next Generation Sequencing Market Revenue, By End-user, 2017 – 2022 (USD Million) 123

TABLE NO. 55. : Global Next Generation Sequencing Market Revenue, By End-user, 2023– 2030 (USD Million) 123

TABLE NO. 56. : Global Next Generation Sequencing Market Revenue, By Technology, 2017 – 2022 (USD Million) 124

TABLE NO. 57. : Global Next Generation Sequencing Market Revenue, By Technology, 2023– 2030 (USD Million) 124

TABLE NO. 58. : Global Next Generation Sequencing Market Revenue, By Diagnostics, 2017 – 2022 (USD Million) 125

TABLE NO. 59. : Global Next Generation Sequencing Market Revenue, By Diagnostics, 2023– 2030 (USD Million) 125

TABLE NO. 60. : North America Next Generation Sequencing Market Revenue, By Country, 2017 – 2022 (USD Million) 127

TABLE NO. 61. : North America Next Generation Sequencing Market Revenue, By Country, 2023– 2030 (USD Million) 127

TABLE NO. 62. : North America Next Generation Sequencing Market Revenue, By Type, 2017 – 2022 (USD Million) 128

TABLE NO. 63. : North America Next Generation Sequencing Market Revenue, By Type, 2023– 2030 (USD Million) 128

TABLE NO. 64. : North America Next Generation Sequencing Market Revenue, By Application, 2017 – 2022 (USD Million) 129

TABLE NO. 65. : North America Next Generation Sequencing Market Revenue, By Application, 2023– 2030 (USD Million) 129

TABLE NO. 66. : North America Next Generation Sequencing Market Revenue, By End-user, 2017 – 2022 (USD Million) 130

TABLE NO. 67. : North America Next Generation Sequencing Market Revenue, By End-user, 2023– 2030 (USD Million) 130

TABLE NO. 68. : North America Next Generation Sequencing Market Revenue, By Technology, 2017 – 2022 (USD Million) 131

TABLE NO. 69. : North America Next Generation Sequencing Market Revenue, By Technology, 2023– 2030 (USD Million) 131

TABLE NO. 70. : North America Next Generation Sequencing Market Revenue, By Diagnostics, 2017 – 2022 (USD Million) 132

TABLE NO. 71. : North America Next Generation Sequencing Market Revenue, By Diagnostics, 2023– 2030 (USD Million) 132

TABLE NO. 72. : Europe Next Generation Sequencing Market Revenue, By Country, 2017 – 2022 (USD Million) 135

TABLE NO. 73. : Europe Next Generation Sequencing Market Revenue, By Country, 2023– 2030 (USD Million) 135

TABLE NO. 74. : Europe Next Generation Sequencing Market Revenue, By Type, 2017 – 2022 (USD Million) 137

TABLE NO. 75. : Europe Next Generation Sequencing Market Revenue, By Type, 2023– 2030 (USD Million) 137

TABLE NO. 76. : Europe Next Generation Sequencing Market Revenue, By Application, 2017 – 2022 (USD Million) 138

TABLE NO. 77. : Europe Next Generation Sequencing Market Revenue, By Application, 2023– 2030 (USD Million) 138

TABLE NO. 78. : Europe Next Generation Sequencing Market Revenue, By End-user, 2017 – 2022 (USD Million) 139

TABLE NO. 79. : Europe Next Generation Sequencing Market Revenue, By End-user, 2023– 2030 (USD Million) 139

TABLE NO. 80. : Europe Next Generation Sequencing Market Revenue, By Technology, 2017 – 2022 (USD Million) 140

TABLE NO. 81. : Europe Next Generation Sequencing Market Revenue, By Technology, 2023– 2030 (USD Million) 140

TABLE NO. 82. : Europe Next Generation Sequencing Market Revenue, By Diagnostics, 2017 – 2022 (USD Million) 141

TABLE NO. 83. : Europe Next Generation Sequencing Market Revenue, By Diagnostics, 2023– 2030 (USD Million) 141

TABLE NO. 84. : Asia Pacific Next Generation Sequencing Market Revenue, By Country, 2017 – 2022 (USD Million) 144

TABLE NO. 85. : Asia Pacific Next Generation Sequencing Market Revenue, By Country, 2023– 2030 (USD Million) 144

TABLE NO. 86. : Asia Pacific Next Generation Sequencing Market Revenue, By Type, 2017 – 2022 (USD Million) 146

TABLE NO. 87. : Asia Pacific Next Generation Sequencing Market Revenue, By Type, 2023– 2030 (USD Million) 146

TABLE NO. 88. : Asia Pacific Next Generation Sequencing Market Revenue, By Application, 2017 – 2022 (USD Million) 147

TABLE NO. 89. : Asia Pacific Next Generation Sequencing Market Revenue, By Application, 2023– 2030 (USD Million) 147

TABLE NO. 90. : Asia Pacific Next Generation Sequencing Market Revenue, By End-user, 2017 – 2022 (USD Million) 148

TABLE NO. 91. : Asia Pacific Next Generation Sequencing Market Revenue, By End-user, 2023– 2030 (USD Million) 148

TABLE NO. 92. : Asia Pacific Next Generation Sequencing Market Revenue, By Technology, 2017 – 2022 (USD Million) 149

TABLE NO. 93. : Asia Pacific Next Generation Sequencing Market Revenue, By Technology, 2023– 2030 (USD Million) 149

TABLE NO. 94. : Asia Pacific Next Generation Sequencing Market Revenue, By Diagnostics, 2017 – 2022 (USD Million) 150

TABLE NO. 95. : Asia Pacific Next Generation Sequencing Market Revenue, By Diagnostics, 2023– 2030 (USD Million) 150

TABLE NO. 96. : Latin America Next Generation Sequencing Market Revenue, By Country, 2017 – 2022 (USD Million) 153

TABLE NO. 97. : Latin America Next Generation Sequencing Market Revenue, By Country, 2023– 2030 (USD Million) 153

TABLE NO. 98. : Latin America Next Generation Sequencing Market Revenue, By Type, 2017 – 2022 (USD Million) 154

TABLE NO. 99. : Latin America Next Generation Sequencing Market Revenue, By Type, 2023– 2030 (USD Million) 154

TABLE NO. 100. :             Latin America Next Generation Sequencing Market Revenue, By Application, 2017 – 2022 (USD Million) 155

TABLE NO. 101. :             Latin America Next Generation Sequencing Market Revenue, By Application, 2023– 2030 (USD Million) 155

TABLE NO. 102. :             Latin America Next Generation Sequencing Market Revenue, By End-user, 2017 – 2022 (USD Million) 156

TABLE NO. 103. :             Latin America Next Generation Sequencing Market Revenue, By End-user, 2023– 2030 (USD Million) 156

TABLE NO. 104. :             Latin America Next Generation Sequencing Market Revenue, By Technology, 2017 – 2022 (USD Million) 157

TABLE NO. 105. :             Latin America Next Generation Sequencing Market Revenue, By Technology, 2023– 2030 (USD Million) 157

TABLE NO. 106. :             Latin America Next Generation Sequencing Market Revenue, By Diagnostics, 2017 – 2022 (USD Million) 158

TABLE NO. 107. :             Latin America Next Generation Sequencing Market Revenue, By Diagnostics, 2023– 2030 (USD Million) 158

TABLE NO. 108. :             Middle East Next Generation Sequencing Market Revenue, By Country, 2017 – 2022 (USD Million) 161

TABLE NO. 109. :             Middle East Next Generation Sequencing Market Revenue, By Country, 2023– 2030 (USD Million) 161

TABLE NO. 110. :             Middle East Next Generation Sequencing Market Revenue, By Type, 2017 – 2022 (USD Million) 162

TABLE NO. 111. :             Middle East Next Generation Sequencing Market Revenue, By Type, 2023– 2030 (USD Million) 162

TABLE NO. 112. :             Middle East Next Generation Sequencing Market Revenue, By Application, 2017 – 2022 (USD Million) 163

TABLE NO. 113. :             Middle East Next Generation Sequencing Market Revenue, By Application, 2023– 2030 (USD Million) 163

TABLE NO. 114. :             Middle East Next Generation Sequencing Market Revenue, By End-user, 2017 – 2022 (USD Million) 164

TABLE NO. 115. :             Middle East Next Generation Sequencing Market Revenue, By End-user, 2023– 2030 (USD Million) 164

TABLE NO. 116. :             Middle East Next Generation Sequencing Market Revenue, By Technology, 2017 – 2022 (USD Million) 165

TABLE NO. 117. :             Middle East Next Generation Sequencing Market Revenue, By Technology, 2023– 2030 (USD Million) 165

TABLE NO. 118. :             Middle East Next Generation Sequencing Market Revenue, By Diagnostics, 2017 – 2022 (USD Million) 166

TABLE NO. 119. :             Middle East Next Generation Sequencing Market Revenue, By Diagnostics, 2023– 2030 (USD Million) 166

TABLE NO. 120. :             Africa Next Generation Sequencing Market Revenue, By Country, 2017 – 2022 (USD Million) 169

TABLE NO. 121. :             Africa Next Generation Sequencing Market Revenue, By Country, 2023– 2030 (USD Million) 169

TABLE NO. 122. :             Africa Next Generation Sequencing Market Revenue, By Type, 2017 – 2022 (USD Million) 170

TABLE NO. 123. :             Africa Next Generation Sequencing Market Revenue, By Type, 2023– 2030 (USD Million) 170

TABLE NO. 124. :             Africa Next Generation Sequencing Market Revenue, By Application, 2017 – 2022 (USD Million) 171

TABLE NO. 125. :             Africa Next Generation Sequencing Market Revenue, By Application, 2023– 2030 (USD Million) 171

TABLE NO. 126. :             Africa Next Generation Sequencing Market Revenue, By End-user, 2017 – 2022 (USD Million) 172

TABLE NO. 127. :             Africa Next Generation Sequencing Market Revenue, By End-user, 2023– 2030 (USD Million) 172

TABLE NO. 128. :             Africa Next Generation Sequencing Market Revenue, By Technology, 2017 – 2022 (USD Million) 173

TABLE NO. 129. :             Africa Next Generation Sequencing Market Revenue, By Technology, 2023– 2030 (USD Million) 173

TABLE NO. 130. :             Africa Next Generation Sequencing Market Revenue, By Diagnostics, 2017 – 2022 (USD Million) 174

TABLE NO. 131. :             Africa Next Generation Sequencing Market Revenue, By Diagnostics, 2023– 2030 (USD Million) 174


Frequently Asked Questions:

What is the current valuation of the NGS market and its projected growth by 2030?

The NGS market was valued at USD 5,809.8 million in 2022. By 2030, it’s expected to reach a valuation of USD 21,485.69 million, growing at a CAGR of 20.54% from 2023 to 2030.

What drives the growth of the NGS market?

Growth drivers include the emergence of genomic medicine, technological advancements in NGS platforms, an increase in R&D activities in genomics, and a growing awareness of genetic disorders. The trend towards personalized and precise medical approaches, leading to the need for comprehensive genomic profiling, also plays a significant role.

Are there challenges facing the NGS market?

Yes, challenges include the high costs of NGS technologies, a shortage of skilled professionals for data interpretation, data storage and management issues, and concerns related to data security and privacy. Ethical implications around genome sequencing, such as issues of consent and potential misuse of genetic information, also present challenges.

How do regulatory bodies impact the NGS market?

Regulatory bodies like the FDA, EMA, and NMPA establish guidelines for NGS-based product development, clinical testing, and diagnostic applications. While these regulations ensure product safety and efficacy, they can also pose challenges for NGS manufacturers due to the stringent nature of the regulations. Clear and supportive regulatory policies, on the other hand, can expedite product approval processes and drive market growth.

Canine Stem Cell Therapy Market

Published:
Report ID: 34386

Humanized Mice Model Market

Published:
Report ID: 34329

Mobile Water Treatment Systems Market

Published:
Report ID: 19203

Environmental Testing Equipment Market

Published:
Report ID: 33589

Biological Safety Cabinets Market

Published:
Report ID: 1536

Glycosaminoglycans (GAGs) Market

Published:
Report ID: 33489

Nontuberculous Mycobacterial (NTM) Infection Market

Published:
Report ID: 33051

Sulfated Biomolecules Market

Published:
Report ID: 33398

Plant Stem Cell Market

Published:
Report ID: 9766

Pharmaceutical Rapid Microbiology Testing Market

Published:
Report ID: 9476

Plant Stem Cell Nutrition Products Market

Published:
Report ID: 9775

Biological Data Visualization Market

Published:
Report ID: 32405

Purchase Options

$2999
Delivery Format: Excel.
$4999
Designed for the individual purchaser.
$6999
Users located at a single corporate site or regional office.
$7999
Allowed for unlimited sharing globally within one company.
Smallform of Sample request

Have a question?

User Profile

Don’t settle for less – trust Mitul to help you find the best solution.

Report delivery within 24 to 48 hours

– Other Info –

What people say?-

User Review

I am very impressed with the information in this report. The author clearly did their research when they came up with this product and it has already given me a lot of ideas.

Jana Schmidt
CEDAR CX Technologies

– Connect with us –

Phone

+91 6232 49 3207


support

24/7 Research Support


sales@credenceresearch.com

– Research Methodology –

Going beyond the basics: advanced techniques in research methodology

– Trusted By –

Pepshi, LG, Nestle
Motorola, Honeywell, Johnson and johnson
LG Chem, SIEMENS, Pfizer
Unilever, Samsonite, QIAGEN