Market Overview
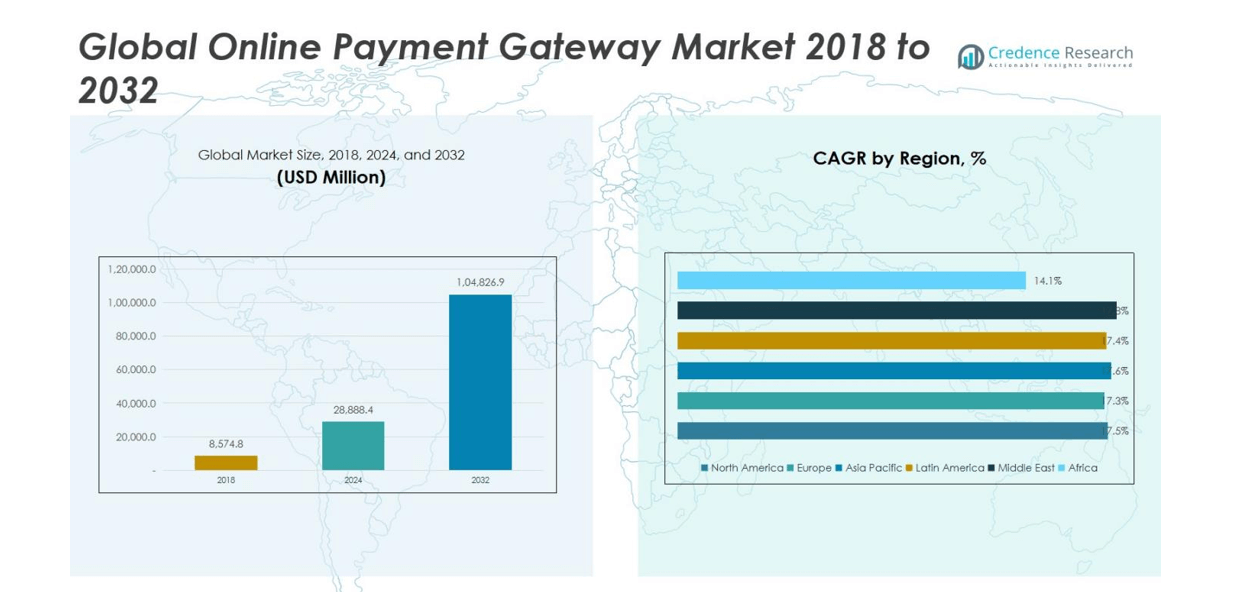
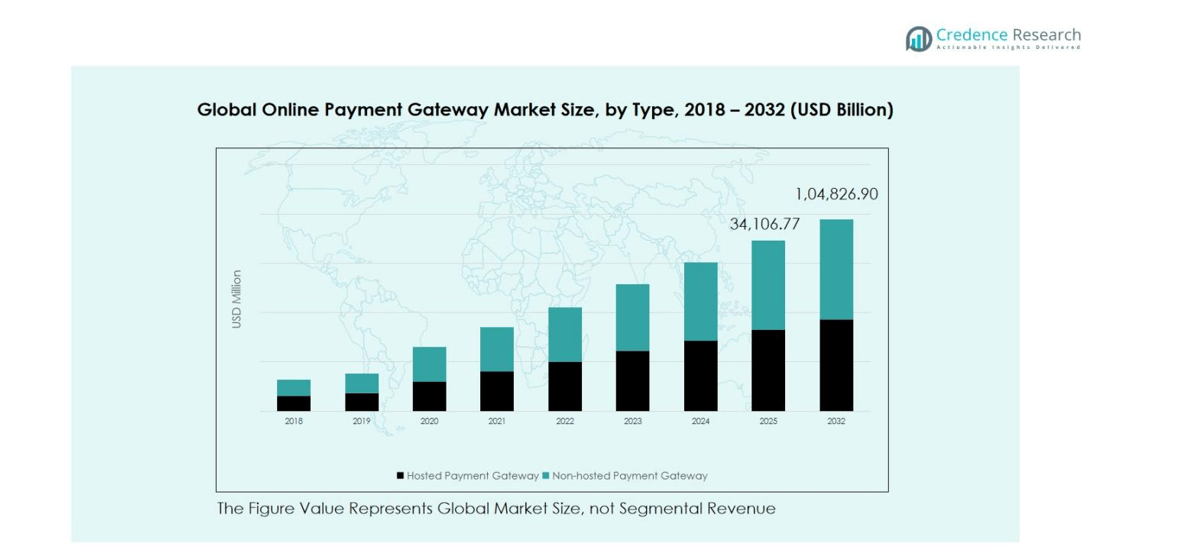
The Online Payment Gateway Market size was valued at USD 8,574.8 million in 2018, increased to USD 28,888.4 million in 2024, and is anticipated to reach USD 104,826.9 million by 2032, growing at a CAGR of 17.40% during the forecast period.
| REPORT ATTRIBUTE |
DETAILS |
| Historical Period |
2020-2023 |
| Base Year |
2024 |
| Forecast Period |
2025-2032 |
| Online Payment Gateway Market Size 2024 |
USD 28,888.4 million |
| Online Payment Gateway Market, CAGR |
17.40% |
| Online Payment Gateway Market Size 2032 |
USD 104,826.9 million |
The Online Payment Gateway Market is highly competitive, led by key players such as PayPal Holdings, Inc., Adyen N.V., Stripe, Inc., Amazon Payments Inc., Authorize. Net, Braintree, Verifone Holdings Inc., and Worldpay, Inc. These companies maintain their leadership through technological innovation, secure and scalable payment solutions, and strategic partnerships with merchants and financial institutions. Emerging players like Razorpay, PayU, and Payoneer are intensifying competition by offering region-specific, cost-effective solutions for SMEs. The Asia Pacific region emerges as the leading market, capturing a 33.2% share in 2024, driven by rapid e-commerce expansion, high smartphone penetration, and government initiatives promoting cashless economies. Market growth in this region is further supported by fintech innovations, mobile payments, and the presence of regional payment giants such as Alipay, Paytm, and Razorpay, positioning Asia Pacific as the most dynamic and high-potential market globally.
Market Insights
- The Online Payment Gateway Market was valued at USD 28,888.4 million in 2024 and is projected to reach USD 104,826.9 million by 2032, growing at a CAGR of 17.40%. The hosted payment gateway segment dominates with 57% share, while retail and e-commerce lead end-use with 28% share.
- Growth is driven by rising e-commerce adoption, increasing smartphone penetration, and the preference for cashless and contactless payment methods across industries.
- Key trends include the expansion of mobile and contactless payments, integration of AI and blockchain technologies for secure transactions, and the rise of cross-border e-commerce driving demand for multi-currency and localized payment solutions.
- Competitive analysis indicates dominance by PayPal, Adyen, Stripe, Amazon Payments, Authorize.Net, and Verifone, with emerging players like Razorpay and PayU expanding regional presence through cost-effective, customizable solutions.
- Regional analysis shows Asia Pacific leading with 2% share, followed by North America at 27.8%, Europe at 22%, with growth supported by fintech innovations, digital adoption, and regulatory support.
Access crucial information at unmatched prices!
Request your sample report today & start making informed decisions powered by Credence Research Inc.!
Download Sample
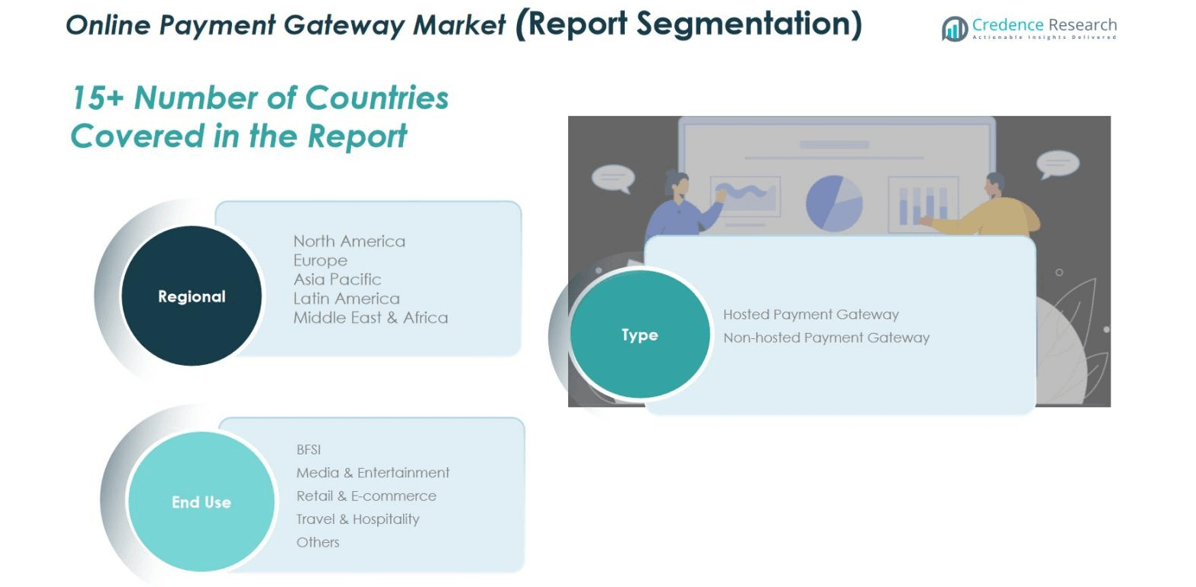
Market Segmentation Analysis:
By Type
The hosted payment gateway segment dominates the Online Payment Gateway Market, accounting for around 57% of the total market share. Its leadership is driven by simplified integration, high security, and PCI DSS compliance, making it the preferred choice for small and medium enterprises. These gateways redirect customers to secure third-party payment pages, reducing merchant liability and ensuring seamless transactions. In contrast, the non-hosted payment gateway segment, though smaller in share, is expanding rapidly as businesses seek greater control over checkout design, user experience, and brand consistency through API-based integrations.
- For instance, PayPal’s hosted solution, PayPal Payments Advanced, offers a secure token-based integration, allowing merchants to redirect customers to a secure third-party payment page, thereby reducing merchant liability and ensuring seamless transactions.
By End Use
Within end-use segments, retail and e-commerce lead the market with 28% share, propelled by the surge in online shopping, mobile payments, and digital wallet adoption. Merchants in this segment rely heavily on payment gateways to enhance transaction speed, reduce cart abandonment, and build customer trust. The BFSI sector follows closely, driven by its demand for secure and scalable digital payment solutions. Meanwhile, media & entertainment, travel & hospitality, and other sectors such as healthcare and education are experiencing steady growth due to the digitalisation of services and the increasing preference for cashless transactions.
- For instance, Netflix and Disney+ have fully shifted to digital billing models, with Netflix recording over 270 million paid subscriptions globally in 2025.
Key Growth Drivers
Rising E-commerce Penetration
The exponential rise in global e-commerce activity remains the strongest growth driver for the Online Payment Gateway Market. Increasing internet accessibility, smartphone adoption, and digital literacy are fueling online retail transactions. Consumers prefer cashless and contactless payment options, which boost demand for efficient payment gateway solutions. Businesses across retail, travel, and entertainment are investing in advanced gateways to enable seamless, secure, and quick transactions. This widespread shift toward digital commerce continues to accelerate gateway adoption and transaction volumes worldwide.
- For instance, India’s Titan Company, which integrated advanced digital payment features like video call sales and omnichannel checkout, significantly boosting customer engagement and online transaction volumes in 2024.
Increased Adoption of Digital Payment Technologies
The integration of emerging technologies such as artificial intelligence, blockchain, and biometrics into payment gateways is driving market expansion. These innovations enhance transaction security, fraud detection, and user authentication, offering a safer payment environment. Additionally, the growing use of digital wallets and contactless payments across industries supports gateway utilization. Service providers are increasingly leveraging machine learning algorithms to improve risk assessment and real-time fraud prevention, thereby fostering greater consumer confidence and higher adoption rates.
- For instance, Stripe uses machine learning algorithms to analyze transaction data in real time, dynamically scoring risk and detecting subtle fraud patterns such as inconsistent device usage, which allows for instant approval or blocking of suspicious transactions.
Government Initiatives for Cashless Economies
Governments worldwide are promoting digital payment ecosystems through supportive policies and incentives. Initiatives such as India’s Digital India campaign and Europe’s PSD2 directive have encouraged the adoption of secure online payment gateways. By emphasizing financial inclusion and transparency, these programs aim to reduce cash dependency and increase electronic transactions. The result is a rapid expansion of payment infrastructure, particularly in emerging markets, where small and medium enterprises (SMEs) are increasingly shifting to digital platforms for financial operations.
Key Trends and Opportunities
Expansion of Cross-Border E-commerce
The surge in cross-border e-commerce is creating new opportunities for payment gateway providers. As consumers purchase goods and services from global merchants, demand for multi-currency support and localized payment solutions is increasing. Payment gateways offering seamless international transaction processing and compliance with regional regulations are gaining prominence. This trend is prompting providers to expand their global networks, forge strategic partnerships, and integrate real-time currency conversion tools, enhancing customer convenience and merchant competitiveness in the international marketplace.
- For instance, PayPal now supports over 200 markets and 25 currencies, enabling users to send and receive cross-border payments seamlessly.
Rise of Mobile and Contactless Payments
The growing preference for mobile and contactless transactions is reshaping the Online Payment Gateway Market. With the expansion of mobile banking, NFC-enabled devices, and digital wallets, consumers now expect faster and more convenient payment experiences. Payment gateways integrating mobile-first and tap-to-pay capabilities are witnessing accelerated adoption. Businesses are also optimizing checkout systems for mobile devices to improve conversion rates. This trend reflects the broader movement toward frictionless, secure, and user-friendly payment ecosystems driven by digital innovation.
- For instance, PayPal has enhanced its mobile checkout experience, contributing to its 25% digital wallet market share in Europe by streamlining payments and boosting conversion rates on mobile devices.
Key Challenges
Rising Cybersecurity and Fraud Risks
Cybersecurity threats pose a major challenge to the Online Payment Gateway Market. As transaction volumes rise, so do phishing attacks, identity theft, and payment fraud. These risks undermine consumer trust and increase compliance costs for service providers. Companies are investing heavily in encryption, multi-factor authentication, and tokenization to strengthen defenses. However, maintaining regulatory compliance across multiple jurisdictions while ensuring a seamless user experience remains a critical balancing act for gateway providers worldwide.
High Integration and Maintenance Costs
Despite growing demand, the high cost of integrating and maintaining online payment gateways continues to restrain market growth, especially among small and medium enterprises. Implementation requires robust IT infrastructure, data security systems, and continuous updates to comply with evolving standards. Additionally, transaction fees and service charges from third-party providers can erode profit margins. These financial and operational challenges often delay adoption for businesses with limited digital maturity, highlighting the need for cost-effective and scalable gateway solutions.
Regional Analysis
North America
North America holds a substantial share of the Global Online Payment Gateway Market, contributing 27.8% of the total market in 2024. The market was valued at USD 2,372.65 million in 2018, rising to USD 8,020.67 million in 2024, and is projected to reach USD 29,236.22 million by 2032, growing at a CAGR of 17.5%. Growth is primarily driven by strong digital infrastructure, high internet penetration, and the presence of leading providers such as PayPal, Stripe, and Amazon Pay. The region’s mature e-commerce ecosystem and advanced cybersecurity frameworks continue to support robust adoption of online payment solutions.
Europe
Europe accounts for 22% of the Online Payment Gateway Market in 2024, valued at USD 1,895.89 million in 2018, increasing to USD 6,361.23 million in 2024, and projected to reach USD 22,957.09 million by 2032 at a CAGR of 17.3%. The region’s growth is driven by the expansion of digital banking, strong regulatory backing through PSD2, and the rising popularity of contactless payments. Markets such as the UK, Germany, and France are key contributors, supported by tech-savvy consumers and high adoption of mobile wallets, promoting secure and frictionless digital transactions.
Asia Pacific
Asia Pacific dominates the global market, capturing the largest 33.2% share in 2024. The market was valued at USD 2,820.26 million in 2018, expanding to USD 9,597.98 million in 2024, and is anticipated to reach USD 35,295.22 million by 2032, recording the highest CAGR of 17.6%. Rapid e-commerce growth, smartphone proliferation, and government initiatives promoting cashless economies—especially in China, India, and Southeast Asia—are key drivers. The presence of regional payment giants like Alipay, Paytm, and Razorpay strengthens adoption, while fintech innovations and cross-border e-commerce continue to elevate the region’s dominance.
Latin America
Latin America represents 9.7% of the Online Payment Gateway Market in 2024, growing at a CAGR of 17.4%. Valued at USD 829.19 million in 2018, the market expanded to USD 2,793.51 million in 2024 and is forecasted to reach USD 10,136.76 million by 2032. The region’s growth is fueled by the rapid rise of digital commerce in Brazil, Mexico, and Argentina. Increasing smartphone usage, improved internet connectivity, and the entry of international payment service providers have enhanced accessibility and convenience for online transactions across diverse business verticals.
Middle East
The Middle East holds a modest yet growing 5% share of the global market in 2024. The market size was USD 372.15 million in 2018, reaching USD 1,281.00 million in 2024, and is expected to attain USD 4,780.11 million by 2032, registering a CAGR of 17.8% the fastest among emerging regions. Growth is driven by the expansion of e-commerce platforms, high mobile penetration, and fintech investments across GCC countries, Israel, and Turkey. Governments’ digital transformation initiatives and the rising adoption of secure, Sharia-compliant online payment solutions are further propelling market development.
Africa
Africa accounted for 3.3% of the global market in 2024 and is projected to grow at a CAGR of 14.1%. The market was valued at USD 284.68 million in 2018, increasing to USD 834.05 million in 2024, and is forecasted to reach USD 2,421.50 million by 2032. Growth across the continent is supported by mobile money platforms, expanding digital infrastructure, and increasing financial inclusion efforts. Countries like South Africa, Nigeria, and Kenya lead the region’s transition toward digital payments. However, inconsistent internet access and limited banking infrastructure remain barriers to faster adoption.
Market Segmentations:
By Type
- Hosted Payment Gateway
- Non-Hosted Payment Gateway
By End Use
- BFSI (Banking, Financial Services, and Insurance)
- Media & Entertainment
- Retail & E-commerce
- Travel & Hospitality
- Others
By Region
- North America
- Europe
- Germany
- France
- U.K.
- Italy
- Spain
- Rest of Europe
- Asia Pacific
- China
- Japan
- India
- South Korea
- South-east Asia
- Rest of Asia Pacific
- Latin America
- Brazil
- Argentina
- Rest of Latin America
- Middle East & Africa
- GCC Countries
- South Africa
- Rest of the Middle East and Africa
Competitive Landscape
The competitive landscape of the Online Payment Gateway Market features prominent players such as PayPal Holdings, Inc., Adyen N.V., Stripe, Inc., Amazon Payments Inc., Authorize.Net, Braintree, Verifone Holdings Inc., and Worldpay, Inc. These companies dominate the market through technological innovation, strong global networks, and strategic partnerships with merchants and financial institutions. The competition is shaped by a focus on secure, scalable, and customizable payment solutions catering to various industries, including retail, BFSI, and e-commerce. Players are investing heavily in AI-driven fraud detection, blockchain-based transparency, and real-time analytics to enhance transaction security and efficiency. Moreover, emerging firms like Razorpay, PayU, and Payoneer are intensifying competition by offering region-specific solutions and affordable integration options for SMEs. Continuous product innovations, acquisitions, and expansion into high-growth regions such as Asia Pacific and the Middle East remain key strategies driving competitive advantage and market consolidation.
Shape Your Report to Specific Countries or Regions & Enjoy 30% Off!
Key Player Analysis
- Adyen N.V.
- Net (a Visa Solution)
- Amazon Payments Inc.
- BitPay, Inc.
- Braintree (a PayPal Service)
- PayPal Holdings, Inc.
- Verifone Holdings Inc.
- WePay, Inc. (a JPMorgan Chase Company)
- Other Key Players
Recent Developments
- In 2025, PayPal launched “PayPal World,” a global platform designed to connect major digital wallets and payment systems. The initiative enables cross-border transactions, allowing users to shop and send money internationally using their domestic wallets without relying on traditional international payment methods. This platform enhances interoperability among various payment systems and expands PayPal’s global reach.
- In 2025, Stripe launched “Open Issuance,” allowing businesses to create their own stablecoins within days. This initiative promotes the mainstream adoption of blockchain-based commerce, giving companies greater control over digital payment systems and enabling innovative financial solutions.
- In 2025, Adyen unveiled “Adyen Uplift,” an AI-powered payment optimization suite. Leveraging machine learning, it improves transaction routing, fraud prevention, and cost efficiency, helping businesses maximize conversion rates while maintaining secure payment processes.
Report Coverage
The research report offers an in-depth analysis based on Type, End Use and Region. It details leading market players, providing an overview of their business, product offerings, investments, revenue streams, and key applications. Additionally, the report includes insights into the competitive environment, SWOT analysis, current market trends, as well as the primary drivers and constraints. Furthermore, it discusses various factors that have driven market expansion in recent years. The report also explores market dynamics, regulatory scenarios, and technological advancements that are shaping the industry. It assesses the impact of external factors and global economic changes on market growth. Lastly, it provides strategic recommendations for new entrants and established companies to navigate the complexities of the market.
Future Outlook
- The market will continue to expand rapidly with the growing preference for digital and contactless payments worldwide.
- Integration of artificial intelligence and machine learning will enhance fraud detection and transaction efficiency.
- The adoption of blockchain technology will improve transparency and reduce processing time in cross-border transactions.
- Mobile-based payment gateways will dominate due to the increasing use of smartphones for online shopping.
- Government initiatives promoting financial inclusion and cashless economies will drive further market penetration.
- Small and medium enterprises will increasingly adopt online gateways to streamline digital payment processing.
- The growth of e-commerce and subscription-based business models will sustain strong demand for payment solutions.
- Emerging markets in Asia Pacific, the Middle East, and Africa will offer high growth potential for gateway providers.
- Strategic collaborations between banks, fintech firms, and e-commerce platforms will redefine market dynamics.
- Continuous advancements in data encryption and authentication methods will strengthen consumer trust and market stability.


