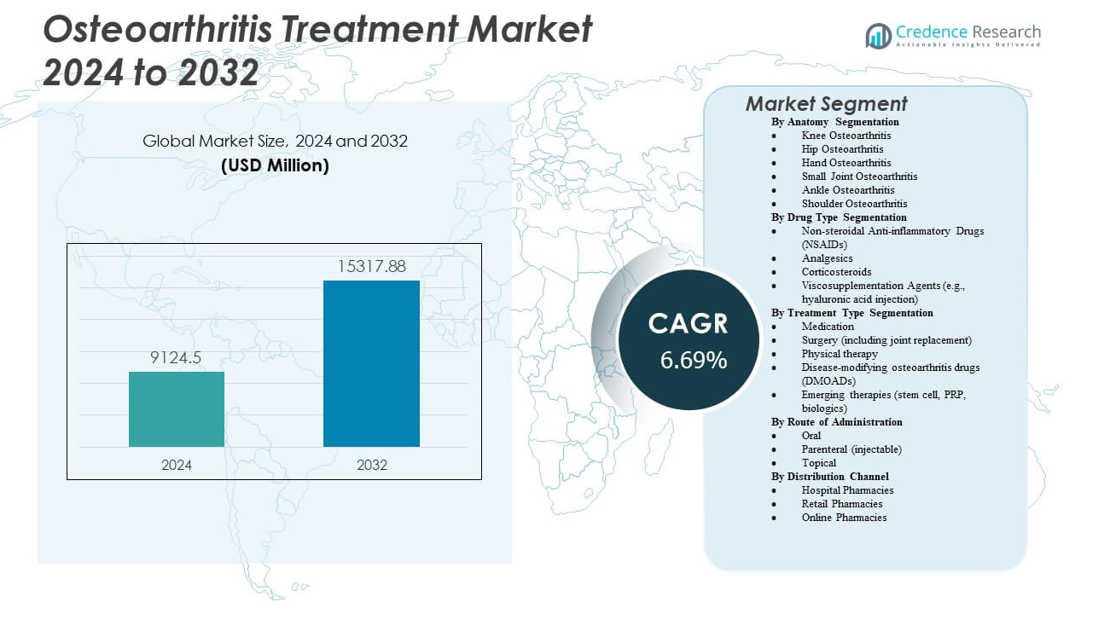
Home » Healthcare » Osteoarthritis Treatment Market

Global Osteoarthritis Treatment Market By Type (Analgesics, Non-Steroidal Anti-Inflammatory Drugs (Nsaids), Corticosteroids, Hyaluronic Acid, Pipeline Analysis) – Growth, Share, Opportunities & Competitive Analysis, 2016 – 2030

Price: $4999

Published: | Report ID: 8291 | Report Format : PDF

Key Highlights of the Report

How are the major segments performing in the Osteoarthritis Treatment market?

  • The analgesics treatment type segment held the largest market revenue share in 2022 and is anticipated to increase fastest over the forecast period. The rising prevalence of osteoarthritis worldwide is predicted to increase demand for analgesics, the most often prescribed pain relievers. The high efficacy of analgesics in reducing pain and inflammation induced by osteoarthritis is further projected to drive demand for these medications.
  • In 2022, the hospital pharmacies distribution channel segment was anticipated to hold a prominent global osteoarthritis treatment market share. Hospital pharmacies play an important role in ensuring that patients receive prompt and appropriate treatment for their ailments. They give patients access to various medications, including prescription prescriptions, over-the-counter treatments, and medical equipment. Hospital pharmacies provide patients with a simple and dependable means to obtain these treatments.
  • The knee osteoarthritis disease type category was the largest in 2022 and is expected to increase at the highest rate during the coming years. Knee osteoarthritis is one of the leading causes of impairment in older adults worldwide. The rising prevalence of knee osteoarthritis, increased awareness of knee osteoarthritis, and the growing senior population are all important factors driving the segment’s growth. For example, according to a PubMed Central article published in June 2022, knee osteoarthritis (OA) is a degenerative joint disease that is one of the most common reasons for knee joint replacements in the United States. As a result, it increases the need for therapeutic medications and propels the market segment’s expansion.
  • The parenteral route of administration category accounted for the largest revenue share of this market in 2022 and is estimated to grow at the highest CAGR in the projected period. This can be ascribed to the widespread use of the parenteral route for giving osteoarthritis medications due to its convenience of administration and improved pharmacokinetics and pharmacodynamics, which result in improved patient compliance.
Design Element 2

Access crucial information at unmatched prices!

Request your free sample report today & start making informed decisions powered by Credence Research!

Download Free Sample
CTA Design Element 3

What is the Market Size of Osteoarthritis Treatment regarding value?

The global osteoarthritis treatment market is estimated to grow at a substantial CAGR of 9.2% over the upcoming years. The global Osteoarthritis Treatment industry was estimated to be worth USD 7.6 billion in 2022 and is expected to be USD 14.07 billion by 2030.

Which region dominated the osteoarthritis treatment market?

North America dominated the global osteoarthritis treatment market in terms of revenue share in 2022. This can be attributed to a large patient pool, high awareness and adoption of advanced treatments, favorable government initiatives, and major regional market players. Additionally, the availability of advanced healthcare infrastructure and the presence of leading research and academic institutions have contributed to the market growth in North America.

Osteoarthritis Treatment Market

Which are the key countries in the osteoarthritis treatment market?

The United States is a major country in the osteoarthritis treatment industry, owing to an aging population, greater awareness of the condition, and high healthcare expenditure. As per the Centers for Disease Control & Prevention (CDC), osteoarthritis affects roughly 32.5 million adults in the United States, which is anticipated to rise in the coming years.

Japan is another key country in the osteoarthritis treatment industry, with a huge patient population and advanced healthcare infrastructure. The Japanese government has launched several programs to combat the growing burden of osteoarthritis, including boosting research and development of novel medicines, better diagnosis & treatment, and raising public awareness. Moreover, the increased frequency of osteoarthritis among Japan’s aging population will likely fuel market expansion.

How is the economy impacting global osteoarthritis treatment growth?

The current economic conditions are projected to impact the global osteoarthritis treatment industry. The impending recession and inflation may reduce healthcare spending, lowering demand for osteoarthritis treatments. In addition, the ongoing Russia-Ukraine conflict can disrupt supply chains and generate volatility in raw material pricing, negatively impacting the production and distribution of osteoarthritis treatment products. However, osteoarthritis is a chronic condition, and the demand for treatment may remain relatively stable, even during economic downturns. The availability of government-sponsored healthcare programs and insurance plans can also minimize the effects of economic conditions on demand for osteoarthritis treatment.

What is the competitive environment of the osteoarthritis treatment market?

The global osteoarthritis treatment market is highly competitive, with a large number of established firms as well as new entrants. The market’s top companies are focused on discovering new medications, treatments, and devices to improve the treatment of osteoarthritis. They are expanding their product portfolio and geographical reach through strategic collaborations, mergers & acquisitions, and partnerships. Numerous small and mid-sized businesses also distinguish the industry focused on finding novel treatment options for osteoarthritis. For instance, Alkem Laboratories gained regulatory approval from the DCGI (Drug Controller General of India) to market its off-the-shelf cell treatment product, StemOne, in September 2022. Alkem Laboratories developed the medicine in partnership with Stempeutics to treat knee osteoarthritis, a degenerative joint disorder.

Executive Summary

What are the key trends in the Osteoarthritis Treatment market?

  • Growing adoption of personalized medicines to propel market growth: Personalized medicine is adapting treatments to a person’s genetic makeup, lifestyle, and circumstances. Personalized medicine can improve treatment outcomes and lower the risk of side effects by utilizing modern technology such as genomics and biomarkers. Many firms are investing in the research and development of personalized medicine to treat osteoarthritis to provide patients with more effective and precise treatments. The use of biomarkers for OA diagnosis and prognosis, as well as technological improvements and the discovery of novel medications, is likely to fuel the growth of the personalized medicine market for osteoarthritis therapy.

What are the latest technological advancements in the osteoarthritis treatment market?

The osteoarthritis treatment industry is undergoing continual technical improvements to enhance the efficacy and safety of treatments. One example is the creation of innovative drug delivery methods, such as microspheres and nanosuspensions, which provide better bioavailability and sustained drug release. Another notable innovation is using biologics to treat osteoarthritides, such as monoclonal antibodies and growth factors. These biologics target specific pathways involved in the onset and progression of osteoarthritis, allowing for a more targeted and personalized therapy approach. Using stem cells and tissue engineering techniques for cartilage repair and regeneration is also gaining market traction. In addition, digital health technologies such as smartphone apps and wearables are being developed to help patients monitor and manage their osteoarthritis.

Which are the key investments by the osteoarthritis treatment market players?

Major companies are actively investing in R&D to develop new and innovative treatments for osteoarthritis. They also collaborate with other companies and academic institutions to leverage their expertise and resources to develop new treatments. Besides, companies are also acquiring smaller companies and startups to strengthen their product portfolios and expand their geographic reach. For instance, in 2021, Eli Lilly & Company acquired Disarm Therapeutics, a biotechnology company developing therapies for axonal degeneration, including osteoarthritis.

Major osteoarthritis treatment market players are Assertio Therapeutics Inc, Abbott Laboratories Inc, Ampio Pharmaceuticals Inc, Apotex Inc, Eli Lilly & Company, Bayer AG, Johnson & Johnson, Horizon Therapeutics Plc, Mylan N.V., Merck Sharp & Dohme Corp., Pfizer Inc, Novartis AG, Sanofi SA, Reckitt Benckiser Group PLC, Teva Pharmaceutical Industries Ltd, Tolmar Pharmaceuticals Inc, and Zimmer Biomet Holding.

What are the Major Driving Factors for the Osteoarthritis Treatment Market?

The rising geriatric population, increasing awareness about osteoarthritis and its treatment options, technological advancements in developing new drugs and therapies, and the growing demand for minimally invasive surgeries are the main driving factors for the osteoarthritis treatment market growth. Further, rising pharmaceutical company R&D spending and government initiatives to improve osteoarthritis treatment and management will likely drive market expansion.

What are the Major Risks for the Osteoarthritis Treatment Market?

The high cost of medicines, significant side effects associated with some pharmaceuticals, limited efficacy of currently available treatments, and a lack of disease-modifying drugs are some of the primary limitations of the osteoarthritis treatment industry. Another major barrier is the disease’s low level of awareness and the available therapies, particularly in underdeveloped nations.

Which is the key disease type in the osteoarthritis treatment market?

Knee osteoarthritis therapies are the largest and fastest-growing category of this global market. Knee osteoarthritis is one of the primary causes of disability in older persons across the globe. The growing senior population, rising prevalence of knee osteoarthritis, and improved awareness of knee osteoarthritis drive the segment’s expansion. Knee osteoarthritis (OA), for example, is a degenerative joint disease that is one of the most common reasons for knee replacement in the United States, according to a PubMed Central article published in June 2022. As a result, the need for therapeutic pharmaceuticals rises, propelling the market segment’s growth. According to OECD data in 2022, Australia’s old population climbed to 16.82% in 2021, which is higher than in previous years. Likewise, the old population in Germany is expected to climb to 22.09% by 2021, as per the same source. The growing senior population is anticipated to support the sector growth as knee osteoarthritis is strongly linked to aging. Also, ongoing developments by market leaders are positively impacting the segment’s growth. For example, Novartis got FDA approval for LNA043 to treat knee osteoarthritis in September 2021. LNA043 is being explored as a potential first-in-class osteoarthritis (OA) disease-modifying therapy.

How is the osteoarthritis treatment market performing in regions?

Asia Pacific region will likely witness the fastest growth in the global osteoarthritis treatment market during the forecast period. This can be attributed to several factors, such as the rising prevalence of osteoarthritis, increasing healthcare expenditure, and improving healthcare infrastructure in countries such as China and India. The growing aging population in the region is also driving the demand for osteoarthritis treatment. Major regional market players and increasing investments in research and development activities for osteoarthritis treatment further contribute to market growth.

What is the regulatory landscape for the osteoarthritis treatment market?

The regulatory environment for osteoarthritis treatment is complex and differs by nation. The FDA regulates the approval and marketing of new medications and medical devices in the United States, including those used to treat osteoarthritis. In addition, numerous countries have regulatory agencies that regulate medication and medical device approval and marketing. Regulatory regulations, which require new competitors in the osteoarthritis therapy industry to demonstrate safety and efficacy before their treatments can be approved for sale, can be a significant barrier to entry. Moreover, legislative changes can impact the market by altering the competitive environment and affecting product development plans.

What are the major players planning for the future of the osteoarthritis treatment market?

Major players in the osteoarthritis treatment market concentrate on producing innovative products and therapies, extending their geographical presence, and partnering with other companies to increase their market position. Companies are also expanding their distribution networks and upgrading their marketing methods to improve their customer base and sales revenue. Some firms also use strategic agreements and acquisitions to extend their product ranges and market reach. For example, in Japan, Shionogi & Co. Ltd and Grünenthal GmbH signed a licensing agreement in August 2022 to commercialize injectable resiniferatoxin, a Grünenthal pipeline product. It is used to alleviate pain in patients with knee osteoarthritis.

Shape Your Report to Specific Countries or Regions & Enjoy 30% Off!

Segmentation of Global Osteoarthritis Treatment Market-

Global Osteoarthritis Treatment Market – By Treatment Type

  • Drugs
  • Viscosupplementation Agents
  • Nonsteroidal Anti-inflammatory Drugs
  • Analgesics
  • Corticosteroids
  • Assistive Devices

Global Osteoarthritis Treatment Market – By Distribution Channel

  • Hospital Pharmacies
  • Retail Pharmacies
  • Drug Stores
  • E-Commerce

Global Osteoarthritis Treatment Market – By Disease Type

  • Knee Osteoarthritis
  • Spine Osteoarthritis
  • Foot & Ankle Osteoarthritis
  • Shoulder Osteoarthritis
  • Hand Osteoarthritis

Global Osteoarthritis Treatment Market – By Route of Administration

  • Parenteral Route
  • Topical Route
  • Oral Route

Global Osteoarthritis Treatment Market – By Region

  • North America
    • U.S.
    • Canada
    • Mexico
  • Europe
    • Germany
    • France
    • U.K.
    • Italy
    • Spain
    • Rest of Europe
  • Asia Pacific
    • China
    • Japan
    • India
    • South Korea
    • South-east Asia
    • Rest of Asia Pacific
  • Latin America
    • Brazil
    • Argentina
    • Rest of Latin America
  • Middle East & Africa
    • GCC Countries
    • South Africa
    • Rest of the Middle East and Africa

1. Preface
1.1. Report Description
1.1.1. Purpose of the Report
1.1.2. Target Audience
1.1.3. USP and Key Offerings
1.2. Research Scope
1.3. Research Methodology
1.3.1. Phase I – Secondary Research
1.3.2. Phase II – Data Modelling
1.3.2.1. Company Share Analysis Model
1.3.2.2. Revenue Based Modelling
1.3.3. Phase III – Primary Research
1.3.4. Research Limitations
1.3.5. Assumptions
1.4. Market Introduction
1.5. Market Research Scope

2. Executive Summary
2.1. Market Snapshot: Global Orthopedic Prosthetic Devices Market
2.2. Global Orthopedic Prosthetic Devices Market, By Product
2.3. Global Orthopedic Prosthetic Devices Market, By Technology
2.4. Global Orthopedic Prosthetic Devices Market, By Region

3. Market Dynamics & Factors Analysis
3.1. Introduction
3.1.1. Global Orthopedic Prosthetic Devices Market Value, 2017-2030, (US$ Bn)
3.1.2. Y-o-Y Growth Trend Analysis
3.2. Market Dynamics
3.2.1. Market Drivers
3.2.1.1. Driver 1
3.2.1.2. Driver 2
3.2.1.3. Driver 3
3.2.2. Market Restraints
3.2.2.1. Restraint 1
3.2.2.2. Restraint 2
3.2.3. Market Opportunities
3.2.3.1. Opportunity 1
3.2.3.2. Opportunity 2
3.2.4. Major Industry Challenges
3.2.4.1. Challenge 1
3.2.4.2. Challenge 2
3.3. Growth and Development Patterns
3.4. Investment Feasibility Analysis
3.5. Market Opportunity Analysis
3.5.1. Product
3.5.2. Technology
3.5.3. Geography

4. Premium Insights
4.1. STAR (Situation, Task, Action, Results) Analysis
4.2. Porter’s Five Forces Analysis
4.2.1. Threat of New Entrants
4.2.2. Bargaining Power of Buyers/Consumers
4.2.3. Bargaining Power of Suppliers
4.2.4. Threat of Substitute Types
4.2.5. Intensity of Competitive Rivalry
4.3. Key Market Trends
4.3.1. Demand Side Trends
4.3.2. Supply Side Trends
4.4. Value Chain Analysis
4.5. Product Analysis
4.6. Analysis and Recommendations
4.7. Marketing Strategy Analysis
4.7.1. Orthopedic Prosthetic Devices Marketing
4.7.2. Orthopedic Prosthetic Devices Marketing
4.7.3. Marketing Channel Development Trend

5. Market Positioning of Key Players, 2022
5.1. Company market share of key players, 2022
5.2. Competitive Benchmarking
5.3. Market Positioning of Key Vendors
5.4. Geographical Presence Analysis
5.5. Major Strategies Adopted by Key Players
5.5.1. Key Strategies Analysis
5.5.2. Mergers and Acquisitions
5.5.3. Partnerships
5.5.4. Product Launch
5.5.5. Geographical Expansion
5.5.6. Others

6. Economic Impact Analysis
6.1. Recession Impact
6.1.1. North America
6.1.2. Europe
6.1.3. Asia Pacific
6.1.4. Latin America
6.1.5. Middle East and Africa
6.2. Ukraine-Russia War Impact
6.2.1. North America
6.2.2. Europe
6.2.3. Asia Pacific
6.2.4. Latin America
6.2.5. Middle East and Africa
6.3. COVID-19 Impact Analysis
6.3.1. North America
6.3.2. Europe
6.3.3. Asia Pacific
6.3.4. Latin America
6.3.5. Middle East and Africa

7. Global Orthopedic Prosthetic Devices Market, By Product
7.1. Global Orthopedic Prosthetic Devices Market Overview, by Product
7.1.1. Global Orthopedic Prosthetic Devices Market Revenue Share, By Product, 2022 Vs 2030 (in %)
7.2. Upper Extremity Prosthetics
7.2.1. Global Orthopedic Prosthetic Devices Market, By Region, 2017-2030 (US$ Bn)
7.3. Lower Extremity Prosthetics
7.3.1. Global Orthopedic Prosthetic Devices Market, By Region, 2017-2030 (US$ Bn)
7.4. Sockets
7.4.1. Global Orthopedic Prosthetic Devices Market, By Region, 2017-2030 (US$ Bn)
7.5. Other Products
7.5.1. Global Orthopedic Prosthetic Devices Market, By Region, 2017-2030 (US$ Bn)

8. Global Orthopedic Prosthetic Devices Market, By Technology
8.1. Global Orthopedic Prosthetic Devices Market Overview, by Technology
8.1.1. Global Orthopedic Prosthetic Devices Market, By Technology, 2022 vs 2030 (in %)
8.2. Conventional
8.2.1. Global Orthopedic Prosthetic Devices Market, By Region, 2017-2030 (US$ Bn)
8.3. Electric-powered
8.3.1. Global Orthopedic Prosthetic Devices Market, By Region, 2017-2030 (US$ Bn)
8.4. Hybrid Orthopedic Prosthetics
8.4.1. Global Orthopedic Prosthetic Devices Market, By Region, 2017-2030 (US$ Bn)

9. Global Orthopedic Prosthetic Devices Market, By Region
9.1. Global Orthopedic Prosthetic Devices Market Overview, by Region
9.1.1. Global Orthopedic Prosthetic Devices Market, By Region, 2022 vs 2030 (in%)
9.2. Product
9.2.1. Global Orthopedic Prosthetic Devices Market, By Product, 2017-2030 (US$ Bn)
9.3. Technology
9.3.1. Global Orthopedic Prosthetic Devices Market, By Technology, 2017-2030 (US$ Bn)

10. North America Orthopedic Prosthetic Devices Market Analysis
10.1. North America Orthopedic Prosthetic Devices Market, by Product, 2017-2030(US$ Bn)
10.1.1. Overview
10.1.2. SRC Analysis
10.2. North America Orthopedic Prosthetic Devices Market, by Technology, 2017-2030(US$ Bn)
10.2.1. Overview
10.2.2. SRC Analysis
10.3. North America Orthopedic Prosthetic Devices Market, by Country, 2017-2030 (US$ Bn)
10.3.1. North America Orthopedic Prosthetic Devices Market, by Country, 2022 Vs 2030 (in%)
10.3.2. U.S.
10.3.2.1. U.S. Orthopedic Prosthetic Devices Market Estimates and Forecast, 2017-2030 (US$ Bn)
10.3.2.2. U.S. Orthopedic Prosthetic Devices, By Product, 2017-2030 (US$ Bn)
10.3.2.3. U.S. Orthopedic Prosthetic Devices, By Technology, 2017-2030 (US$ Bn)
10.3.3. Canada
10.3.3.1. Canada Orthopedic Prosthetic Devices Market Estimates and Forecast, 2017-2030 (US$ Bn)
10.3.3.2. Canada Orthopedic Prosthetic Devices, By Product, 2017-2030 (US$ Bn)
10.3.3.3. Canada Orthopedic Prosthetic Devices, By Technology, 2017-2030 (US$ Bn)
10.3.4. Mexico
10.3.4.1. Mexico Orthopedic Prosthetic Devices Market Estimates and Forecast, 2017-2030 (US$ Bn)
10.3.4.2. Mexico Orthopedic Prosthetic Devices, By Product, 2017-2030 (US$ Bn)
10.3.4.3. Mexico Orthopedic Prosthetic Devices, By Technology, 2017-2030 (US$ Bn)

11. Europe Orthopedic Prosthetic Devices Market Analysis
11.1. Europe Orthopedic Prosthetic Devices Market, by Product, 2017-2030(US$ Bn)
11.1.1. Overview
11.1.2. SRC Analysis
11.2. Europe Orthopedic Prosthetic Devices Market, by Technology, 2017-2030(US$ Bn)
11.2.1. Overview
11.2.2. SRC Analysis
11.3. Europe Orthopedic Prosthetic Devices Market, by Country, 2017-2030 (US$ Bn)
11.3.1. Europe Orthopedic Prosthetic Devices Market, by Country, 2022 Vs 2030 (in%)
11.3.2. Germany
11.3.2.1. Germany Orthopedic Prosthetic Devices Market Estimates and Forecast, 2017-2030 (US$ Bn)
11.3.2.2. Germany Orthopedic Prosthetic Devices, By Product, 2017-2030 (US$ Bn)
11.3.2.3. Germany Orthopedic Prosthetic Devices, By Technology, 2017-2030 (US$ Bn)
11.3.3. France
11.3.3.1. France Orthopedic Prosthetic Devices Market Estimates and Forecast, 2017-2030 (US$ Bn)
11.3.3.2. France Orthopedic Prosthetic Devices, By Product, 2017-2030 (US$ Bn)
11.3.3.3. France Orthopedic Prosthetic Devices, By Technology, 2017-2030 (US$ Bn)
11.3.4. UK
11.3.4.1. UK Orthopedic Prosthetic Devices Market Estimates and Forecast, 2017-2030 (US$ Bn)
11.3.4.2. UK Orthopedic Prosthetic Devices, By Product, 2017-2030 (US$ Bn)
11.3.4.3. UK Orthopedic Prosthetic Devices, By Technology, 2017-2030 (US$ Bn)
11.3.5. Italy
11.3.5.1. Italy Orthopedic Prosthetic Devices Market Estimates and Forecast, 2017-2030 (US$ Bn)
11.3.5.2. Italy Orthopedic Prosthetic Devices, By Product, 2017-2030 (US$ Bn)
11.3.5.3. Italy Orthopedic Prosthetic Devices, By End-user, 2017-2030 (US$ Bn)
11.3.6. Spain
11.3.6.1. Spain Orthopedic Prosthetic Devices Market Estimates and Forecast, 2017-2030 (US$ Bn)
11.3.6.2. Spain Orthopedic Prosthetic Devices, By Product, 2017-2030 (US$ Bn)
11.3.6.3. Spain Orthopedic Prosthetic Devices, By Technology, 2017-2030 (US$ Bn)
11.3.7. Rest of Europe
11.3.7.1. Rest of Europe Orthopedic Prosthetic Devices Market Estimates and Forecast, 2017-2030 (US$ Bn)
11.3.7.2. Rest of Europe Orthopedic Prosthetic Devices, By Product, 2017-2030 (US$ Bn)
11.3.7.3. Rest of Europe Orthopedic Prosthetic Devices, By Technology, 2017-2030 (US$ Bn)

12. Asia Pacific Orthopedic Prosthetic Devices Market Analysis
12.1. Asia Pacific Orthopedic Prosthetic Devices Market, by Product, 2017-2030(US$ Bn)
12.1.1. Overview
12.1.2. SRC Analysis
12.2. Asia Pacific Orthopedic Prosthetic Devices Market, by Technology, 2017-2030(US$ Bn)
12.2.1. Overview
12.2.2. SRC Analysis
12.3. Asia Pacific Orthopedic Prosthetic Devices Market, by Country, 2017-2030 (US$ Bn)
12.3.1. Asia Pacific Orthopedic Prosthetic Devices Market, by Country, 2022 Vs 2030 (in%)
12.3.2. China
12.3.2.1. China Orthopedic Prosthetic Devices Market Estimates and Forecast, 2017-2030 (US$ Bn)
12.3.2.2. China Orthopedic Prosthetic Devices, By Product, 2017-2030 (US$ Bn)
12.3.2.3. China Orthopedic Prosthetic Devices, By Technology, 2017-2030 (US$ Bn)
12.3.3. Japan
12.3.3.1. Japan Orthopedic Prosthetic Devices Market Estimates and Forecast, 2017-2030 (US$ Bn)
12.3.3.2. Japan Orthopedic Prosthetic Devices, By Product, 2017-2030 (US$ Bn)
12.3.3.3. Japan Orthopedic Prosthetic Devices, By Technology, 2017-2030 (US$ Bn)
12.3.4. India
12.3.4.1. India Orthopedic Prosthetic Devices Market Estimates and Forecast, 2017-2030 (US$ Bn)
12.3.4.2. India Orthopedic Prosthetic Devices, By Product, 2017-2030 (US$ Bn)
12.3.4.3. India Orthopedic Prosthetic Devices, By Technology, 2017-2030 (US$ Bn)
12.3.5. South Korea
12.3.5.1. South Korea Orthopedic Prosthetic Devices Market Estimates and Forecast, 2017-2030 (US$ Bn)
12.3.5.2. South Korea Orthopedic Prosthetic Devices, By Product, 2017-2030 (US$ Bn)
12.3.5.3. South Korea Orthopedic Prosthetic Devices, By Technology, 2017-2030 (US$ Bn)
12.3.6. South-East Asia
12.3.6.1. South-East Asia Orthopedic Prosthetic Devices Market Estimates and Forecast, 2017-2030 (US$ Bn)
12.3.6.2. South-East Asia Orthopedic Prosthetic Devices, By Product, 2017-2030 (US$ Bn)
12.3.6.3. South-East Asia Orthopedic Prosthetic Devices, By Technology, 2017-2030 (US$ Bn)
12.3.7. Rest of Asia Pacific
12.3.7.1. Rest of Asia Pacific Orthopedic Prosthetic Devices Market Estimates and Forecast, 2017-2030 (US$ Bn)
12.3.7.2. Rest of Asia Pacific Orthopedic Prosthetic Devices, By Product, 2017-2030 (US$ Bn)
12.3.7.3. Rest of Asia Pacific Orthopedic Prosthetic Devices, By Technology, 2017-2030 (US$ Bn)

13. Latin America Orthopedic Prosthetic Devices Market Analysis
13.1. Latin America Orthopedic Prosthetic Devices Market, by Product, 2017-2030(US$ Bn)
13.1.1. Overview
13.1.2. SRC Analysis
13.2. Latin America Orthopedic Prosthetic Devices Market, by Technology, 2017-2030(US$ Bn)
13.2.1. Overview
13.2.2. SRC Analysis
13.3. Latin America Orthopedic Prosthetic Devices Market, by Country, 2017-2030 (US$ Bn)
13.3.1. Latin America Orthopedic Prosthetic Devices Market, by Country, 2022 Vs 2030 (in%)
13.3.2. Brazil
13.3.2.1. Brazil Orthopedic Prosthetic Devices Market Estimates and Forecast, 2017-2030 (US$ Bn)
13.3.2.2. Brazil Orthopedic Prosthetic Devices, By Product, 2017-2030 (US$ Bn)
13.3.2.3. Brazil Orthopedic Prosthetic Devices, By Technology, 2017-2030 (US$ Bn)
13.3.3. Argentina
13.3.3.1. Argentina Orthopedic Prosthetic Devices Market Estimates and Forecast, 2017-2030 (US$ Bn)
13.3.3.2. Argentina Orthopedic Prosthetic Devices, By Product, 2017-2030 (US$ Bn)
13.3.3.3. Argentina Orthopedic Prosthetic Devices, By Technology, 2017-2030 (US$ Bn)
13.3.4. Rest of Latin America
13.3.4.1. Rest of Latin America Orthopedic Prosthetic Devices Market Estimates and Forecast, 2017-2030 (US$ Bn)
13.3.4.2. Rest of Latin America Orthopedic Prosthetic Devices, By Product, 2017-2030 (US$ Bn)
13.3.4.3. Rest of Latin America Orthopedic Prosthetic Devices, By Technology, 2017-2030 (US$ Bn)

14. Middle East and Africa Orthopedic Prosthetic Devices Market Analysis
14.1. Middle East and Africa Orthopedic Prosthetic Devices Market, by Product, 2017-2030(US$ Bn)
14.1.1. Overview
14.1.2. SRC Analysis
14.2. Middle East and Africa Orthopedic Prosthetic Devices Market, by Technology, 2017-2030(US$ Bn)
14.2.1. Overview
14.2.2. SRC Analysis
14.3. Middle East and Africa Orthopedic Prosthetic Devices Market, by Country, 2017-2030 (US$ Bn)
14.3.1. Middle East and Africa Orthopedic Prosthetic Devices Market, by Country, 2022 Vs 2030 (in%)
14.3.2. GCC Countries
14.3.2.1. GCC Countries Orthopedic Prosthetic Devices Market Estimates and Forecast, 2017-2030 (US$ Bn)
14.3.2.2. GCC Countries Orthopedic Prosthetic Devices, By Product, 2017-2030 (US$ Bn)
14.3.2.3. GCC Countries Orthopedic Prosthetic Devices, By Technology, 2017-2030 (US$ Bn)
14.3.3. South Africa
14.3.3.1. South Africa Orthopedic Prosthetic Devices Market Estimates and Forecast, 2017-2030 (US$ Bn)
14.3.3.2. South Africa Orthopedic Prosthetic Devices, By Product, 2017-2030 (US$ Bn)
14.3.3.3. South Africa Orthopedic Prosthetic Devices, By Technology, 2017-2030 (US$ Bn)
14.3.4. Rest of Middle East and Africa
14.3.4.1. Rest of Middle East and Africa Orthopedic Prosthetic Devices Market Estimates and Forecast, 2017-2030 (US$ Bn)
14.3.4.2. Rest of Middle East and Africa Orthopedic Prosthetic Devices, By Product, 2017-2030 (US$ Bn)
14.3.4.3. Rest of Middle East and Africa Orthopedic Prosthetic Devices, By Technology, 2017-2030 (US$ Bn)

15. Company Profiles
15.1. Össur
15.1.1. Company Overview
15.1.2. Products/Services Portfolio
15.1.3. Geographical Presence
15.1.4. Financial Summary
15.1.4.1. Market Revenue and Net Profit (2019-2022)
15.1.4.2. Business Segment Revenue Analysis
15.1.4.3. Geographical Revenue Analysis
15.2. Hanger Inc.
15.3. Ottobock
15.4. Blatchford Limited
15.5. WillowWood Global LLC
15.6. Fillauer LLC
15.7. Howard Orthopaedics Inc.
15.8. Aether Biomedical
15.9. United Prosthetics
15.10. Advanced Arm Dynamic
15.11. TASKA Prosthetics
15.12. Steeper Inc.
15.13. BioMetrics Prosthetic and Orthotic CT
15.14. Trulife
15.15. Open Bionics
15.16. SYNERGY PROSTHETICS
15.17. Motorica

List of Figures
FIG. 1 Global Orthopedic Prosthetic Devices Market: Research Methodology
FIG. 2 Market Size Estimation – Top Down & Bottom up Approach
FIG. 3 Global Orthopedic Prosthetic Devices Market Segmentation
FIG. 4 Global Orthopedic Prosthetic Devices Market, by Product, 2022 (US$ Bn)
FIG. 5 Global Orthopedic Prosthetic Devices Market, by Technology, 2022 (US$ Bn)
FIG. 6 Global Orthopedic Prosthetic Devices Market, by Geography, 2022 (US$ Bn)
FIG. 7 Attractive Investment Proposition, by Product, 2022
FIG. 8 Attractive Investment Proposition, by Technology, 2022
FIG. 9 Attractive Investment Proposition, by Geography, 2022
FIG. 10 Global Market Share Analysis of Key Orthopedic Prosthetic Devices Market Manufacturers, 2022
FIG. 11 Global Market Positioning of Key Orthopedic Prosthetic Devices Market Manufacturers, 2022
FIG. 12 Global Orthopedic Prosthetic Devices Market Value Contribution, By Product, 2022 & 2030 (Value %)
FIG. 13 Global Orthopedic Prosthetic Devices Market, by Upper Extremity Prosthetics, Value, 2017-2030 (US$ Bn)
FIG. 14 Global Orthopedic Prosthetic Devices Market, by Lower Extremity Prosthetics, Value, 2017-2030 (US$ Bn)
FIG. 15 Global Orthopedic Prosthetic Devices Market, by Sockets, Value, 2017-2030 (US$ Bn)
FIG. 16 Global Orthopedic Prosthetic Devices Market, by Other Products, Value, 2017-2030 (US$ Bn)
FIG. 17 Global Orthopedic Prosthetic Devices Market Value Contribution, By Technology, 2022 & 2030 (Value %)
FIG. 18 Global Orthopedic Prosthetic Devices Market, by Conventional, Value, 2017-2030 (US$ Bn)
FIG. 19 Global Orthopedic Prosthetic Devices Market, by Electric-powered, 2017-2030 (US$ Bn)
FIG. 20 Global Orthopedic Prosthetic Devices Market, by Hybrid Orthopedic Prosthetics, 2017-2030 (US$ Bn)
FIG. 21 North America Orthopedic Prosthetic Devices Market, 2017-2030 (US$ Bn)
FIG. 22 U.S. Orthopedic Prosthetic Devices Market, 2017-2030 (US$ Bn)
FIG. 23 Canada Orthopedic Prosthetic Devices Market, 2017-2030 (US$ Bn)
FIG. 24 Europe Orthopedic Prosthetic Devices Market, 2017-2030 (US$ Bn)
FIG. 25 Germany Orthopedic Prosthetic Devices Market, 2017-2030 (US$ Bn)
FIG. 26 France Orthopedic Prosthetic Devices Market, 2017-2030 (US$ Bn)
FIG. 27 U.K. Orthopedic Prosthetic Devices Market, 2017-2030 (US$ Bn)
FIG. 28 Italy Orthopedic Prosthetic Devices Market, 2017-2030 (US$ Bn)
FIG. 29 Spain Orthopedic Prosthetic Devices Market, 2017-2030 (US$ Bn)
FIG. 30 Rest of Europe Orthopedic Prosthetic Devices Market, 2017-2030 (US$ Bn)
FIG. 31 Asia Pacific Orthopedic Prosthetic Devices Market, 2017-2030 (US$ Bn)
FIG. 32 China Orthopedic Prosthetic Devices Market, 2017-2030 (US$ Bn)
FIG. 33 Japan Orthopedic Prosthetic Devices Market, 2017-2030 (US$ Bn)
FIG. 34 India Orthopedic Prosthetic Devices Market, 2017-2030 (US$ Bn)
FIG. 35 South Korea Orthopedic Prosthetic Devices Market, 2017-2030 (US$ Bn)
FIG. 36 South-East Asia Orthopedic Prosthetic Devices Market, 2017-2030 (US$ Bn)
FIG. 37 Rest of Asia Pacific Orthopedic Prosthetic Devices Market, 2017-2030 (US$ Bn)
FIG. 38 Latin America Orthopedic Prosthetic Devices Market, 2017-2030 (US$ Bn)
FIG. 39 Brazil Orthopedic Prosthetic Devices Market, 2017-2030 (US$ Bn)
FIG. 40 Mexico Orthopedic Prosthetic Devices Market, 2017-2030 (US$ Bn)
FIG. 41 Rest of Latin America Orthopedic Prosthetic Devices Market, 2017-2030 (US$ Bn)
FIG. 42 Middle East & Africa Orthopedic Prosthetic Devices Market, 2017-2030 (US$ Bn)
FIG. 43 GCC Countries Orthopedic Prosthetic Devices Market, 2017-2030 (US$ Bn)
FIG. 44 South Africa Orthopedic Prosthetic Devices Market, 2017-2030 (US$ Bn)
FIG. 45 Rest of Middle East and Africa Orthopedic Prosthetic Devices Market, 2017-2030 (US$ Bn)

List of Tables
TABLE 1 Market Snapshot: Global Orthopedic Prosthetic Devices Market
TABLE 2 Global Orthopedic Prosthetic Devices Market: Market Drivers Impact Analysis
TABLE 3 Global Orthopedic Prosthetic Devices Market: Market Restraints Impact Analysis
TABLE 4 Global Orthopedic Prosthetic Devices Market, by Competitive Benchmarking, 2022
TABLE 5 Global Orthopedic Prosthetic Devices Market, by Geographical Presence Analysis, 2022
TABLE 6 Global Orthopedic Prosthetic Devices Market, by Key Strategies Analysis, 2022
TABLE 7 Global Orthopedic Prosthetic Devices Market, by Barcodes, By Region, 2017-2022 (US$ Bn)
TABLE 8 Global Orthopedic Prosthetic Devices Market, by Barcodes, By Region, 2023-2030 (US$ Bn)
TABLE 9 Global Orthopedic Prosthetic Devices Market, by Upper Extremity Prosthetics, By Region, 2017-2022 (US$ Bn)
TABLE 10 Global Orthopedic Prosthetic Devices Market, by Upper Extremity Prosthetics, By Region, 2017-2022 (US$ Bn)
TABLE 11 Global Orthopedic Prosthetic Devices Market, by Lower Extremity Prosthetics, By Region, 2017-2022 (US$ Bn)
TABLE 12 Global Orthopedic Prosthetic Devices Market, by Lower Extremity Prosthetics, By Region, 2023-2030 (US$ Bn)
TABLE 13 Global Orthopedic Prosthetic Devices Market, by Sockets, By Region, 2017-2022 (US$ Bn)
TABLE 14 Global Orthopedic Prosthetic Devices Market, by Sockets, By Region, 2023-2030 (US$ Bn)
TABLE 15 Global Orthopedic Prosthetic Devices Market, by Other Products, By Region, 2017-2022 (US$ Bn)
TABLE 16 Global Orthopedic Prosthetic Devices Market, by Other Products, By Region, 2023-2030 (US$ Bn)
TABLE 17 Global Orthopedic Prosthetic Devices Market, by Conventional, By Region, 2017-2022 (US$ Bn)
TABLE 18 Global Orthopedic Prosthetic Devices Market, by Conventional, By Region, 2023-2030 (US$ Bn)
TABLE 19 Global Orthopedic Prosthetic Devices Market, by Electric-powered, By Region, 2017-2022 (US$ Bn)
TABLE 20 Global Orthopedic Prosthetic Devices Market, by Electric-powered, By Region, 2023-2030 (US$ Bn)
TABLE 21 Global Orthopedic Prosthetic Devices Market, by Hybrid Orthopedic Prosthetics, By Region, 2017-2022 (US$ Bn)
TABLE 22 Global Orthopedic Prosthetic Devices Market, by Hybrid Orthopedic Prosthetics, By Region, 2023-2030 (US$ Bn)
TABLE 23 Global Orthopedic Prosthetic Devices Market, by Product, 2017-2022 (US$ Bn)
TABLE 24 Global Orthopedic Prosthetic Devices Market, by Product, 2023-2030 (US$ Bn)
TABLE 25 Global Orthopedic Prosthetic Devices Market, by Technology, 2017-2022 (US$ Bn)
TABLE 26 Global Orthopedic Prosthetic Devices Market, by Technology, 2023-2030 (US$ Bn)
TABLE 27 Global Orthopedic Prosthetic Devices Market, by Region, 2017-2022 (US$ Bn)
TABLE 28 Global Orthopedic Prosthetic Devices Market, by Region, 2023-2030 (US$ Bn)
TABLE 29 North America Orthopedic Prosthetic Devices Market, by Product, 2017-2022 (US$ Bn)
TABLE 30 North America Orthopedic Prosthetic Devices Market, by Product, 2023-2030 (US$ Bn)
TABLE 31 North America Orthopedic Prosthetic Devices Market, by Technology, 2017-2022 (US$ Bn)
TABLE 32 North America Orthopedic Prosthetic Devices Market, by Technology, 2023-2030 (US$ Bn)
TABLE 33 North America Orthopedic Prosthetic Devices Market, by Country, 2017-2022 (US$ Bn)
TABLE 34 North America Orthopedic Prosthetic Devices Market, by Country, 2023-2030 (US$ Bn)
TABLE 35 United States Orthopedic Prosthetic Devices Market, by Product, 2017-2022 (US$ Bn)
TABLE 36 United States Orthopedic Prosthetic Devices Market, by Product, 2023-2030 (US$ Bn)
TABLE 37 United States Orthopedic Prosthetic Devices Market, by Technology, 2017-2022 (US$ Bn)
TABLE 38 United States Orthopedic Prosthetic Devices Market, by Technology, 2023-2030 (US$ Bn)
TABLE 39 Canada Orthopedic Prosthetic Devices Market, by Product, 2017-2022 (US$ Bn)
TABLE 40 Canada Orthopedic Prosthetic Devices Market, by Product, 2023-2030 (US$ Bn)
TABLE 41 Canada Orthopedic Prosthetic Devices Market, by Technology, 2017-2022 (US$ Bn)
TABLE 42 Canada Orthopedic Prosthetic Devices Market, by Technology, 2023-2030 (US$ Bn)
TABLE 43 Mexico Orthopedic Prosthetic Devices Market, by Product, 2017-2022 (US$ Bn)
TABLE 44 Mexico Orthopedic Prosthetic Devices Market, by Product, 2023-2030 (US$ Bn)
TABLE 45 Mexico Orthopedic Prosthetic Devices Market, by Technology, 2017-2022 (US$ Bn)
TABLE 46 Mexico Orthopedic Prosthetic Devices Market, by Technology, 2023-2030 (US$ Bn)
TABLE 47 Europe Orthopedic Prosthetic Devices Market, by Product, 2017-2022 (US$ Bn)
TABLE 48 Europe Orthopedic Prosthetic Devices Market, by Product, 2023-2030 (US$ Bn)
TABLE 49 Europe Orthopedic Prosthetic Devices Market, by Technology, 2017-2022 (US$ Bn)
TABLE 50 Europe Orthopedic Prosthetic Devices Market, by Technology, 2023-2030 (US$ Bn)
TABLE 51 Europe Orthopedic Prosthetic Devices Market, by Country, 2017-2022 (US$ Bn)
TABLE 52 Europe Orthopedic Prosthetic Devices Market, by Country, 2023-2030 (US$ Bn)
TABLE 53 Germany Orthopedic Prosthetic Devices Market, by Product, 2017-2022 (US$ Bn)
TABLE 54 Germany Orthopedic Prosthetic Devices Market, by Product, 2023-2030 (US$ Bn)
TABLE 55 Germany Orthopedic Prosthetic Devices Market, by Technology, 2017-2022 (US$ Bn)
TABLE 56 Germany Orthopedic Prosthetic Devices Market, by Technology, 2023-2030 (US$ Bn)
TABLE 57 France Orthopedic Prosthetic Devices Market, by Product, 2017-2022 (US$ Bn)
TABLE 58 France Orthopedic Prosthetic Devices Market, by Product, 2023-2030 (US$ Bn)
TABLE 59 France Orthopedic Prosthetic Devices Market, by Technology, 2017-2022 (US$ Bn)
TABLE 60 France Orthopedic Prosthetic Devices Market, by Technology, 2023-2030 (US$ Bn)
TABLE 61 United Kingdom Orthopedic Prosthetic Devices Market, by Product, 2017-2022 (US$ Bn)
TABLE 62 United Kingdom Orthopedic Prosthetic Devices Market, by Product, 2023-2030 (US$ Bn)
TABLE 63 United Kingdom Orthopedic Prosthetic Devices Market, by Technology, 2017-2022 (US$ Bn)
TABLE 64 United Kingdom Orthopedic Prosthetic Devices Market, by Technology, 2023-2030 (US$ Bn)
TABLE 65 Italy Orthopedic Prosthetic Devices Market, by Product, 2017-2022 (US$ Bn)
TABLE 66 Italy Orthopedic Prosthetic Devices Market, by Product, 2023-2030 (US$ Bn)
TABLE 67 Italy Orthopedic Prosthetic Devices Market, by Technology, 2017-2022 (US$ Bn)
TABLE 68 Italy Orthopedic Prosthetic Devices Market, by Technology, 2023-2030 (US$ Bn)
TABLE 69 Spain Orthopedic Prosthetic Devices Market, by Product, 2017-2022 (US$ Bn)
TABLE 70 Spain Orthopedic Prosthetic Devices Market, by Product, 2023-2030 (US$ Bn)
TABLE 71 Spain Orthopedic Prosthetic Devices Market, by Technology, 2017-2022 (US$ Bn)
TABLE 72 Spain Orthopedic Prosthetic Devices Market, by Technology, 2023-2030 (US$ Bn)
TABLE 73 Rest of Europe Orthopedic Prosthetic Devices Market, by Product, 2017-2022 (US$ Bn)
TABLE 74 Rest of Europe Orthopedic Prosthetic Devices Market, by Product, 2023-2030 (US$ Bn)
TABLE 75 Rest of Europe Orthopedic Prosthetic Devices Market, by Technology, 2017-2022 (US$ Bn)
TABLE 76 Rest of Europe Orthopedic Prosthetic Devices Market, by Technology, 2023-2030 (US$ Bn)
TABLE 77 Asia Pacific Orthopedic Prosthetic Devices Market, by Product, 2017-2022 (US$ Bn)
TABLE 78 Asia Pacific Orthopedic Prosthetic Devices Market, by Product, 2023-2030 (US$ Bn)
TABLE 79 Asia Pacific Orthopedic Prosthetic Devices Market, by Technology, 2017-2022 (US$ Bn)
TABLE 80 Asia Pacific Orthopedic Prosthetic Devices Market, by Technology, 2023-2030 (US$ Bn)
TABLE 81 China Orthopedic Prosthetic Devices Market, by Product, 2017-2022 (US$ Bn)
TABLE 82 China Orthopedic Prosthetic Devices Market, by Product, 2023-2030 (US$ Bn)
TABLE 83 China Orthopedic Prosthetic Devices Market, by Technology, 2017-2022 (US$ Bn)
TABLE 84 China Orthopedic Prosthetic Devices Market, by Technology, 2023-2030 (US$ Bn)
TABLE 85 Japan Orthopedic Prosthetic Devices Market, by Product, 2017-2022 (US$ Bn)
TABLE 86 Japan Orthopedic Prosthetic Devices Market, by Product, 2023-2030 (US$ Bn)
TABLE 87 Japan Orthopedic Prosthetic Devices Market, by Technology, 2017-2022 (US$ Bn)
TABLE 88 Japan Orthopedic Prosthetic Devices Market, by Technology, 2023-2030 (US$ Bn)
TABLE 89 Japan Orthopedic Prosthetic Devices Market, by End-user, 2017-2022 (US$ Bn)
TABLE 90 India Orthopedic Prosthetic Devices Market, by Product, 2023-2030 (US$ Bn)
TABLE 91 India Orthopedic Prosthetic Devices Market, by Technology, 2017-2022 (US$ Bn)
TABLE 92 India Orthopedic Prosthetic Devices Market, by Technology, 2023-2030 (US$ Bn)
TABLE 93 South Korea Orthopedic Prosthetic Devices Market, by Product, 2017-2022 (US$ Bn)
TABLE 94 South Korea Orthopedic Prosthetic Devices Market, by Product, 2023-2030 (US$ Bn)
TABLE 95 South Korea Orthopedic Prosthetic Devices Market, by Technology, 2017-2022 (US$ Bn)
TABLE 96 South Korea Orthopedic Prosthetic Devices Market, by Technology, 2023-2030 (US$ Bn)
TABLE 97 South-East Asia Orthopedic Prosthetic Devices Market, by Product, 2017-2022 (US$ Bn)
TABLE 98 South-East Asia Orthopedic Prosthetic Devices Market, by Product, 2023-2030 (US$ Bn)
TABLE 99 South-East Asia Orthopedic Prosthetic Devices Market, by Technology, 2017-2022 (US$ Bn)
TABLE 100 South-East Asia Orthopedic Prosthetic Devices Market, by Technology, 2023-2030 (US$ Bn)
TABLE 101 Rest of Asia Pacific Orthopedic Prosthetic Devices Market, by Product, 2017-2022 (US$ Bn)
TABLE 102 Rest of Asia Pacific Orthopedic Prosthetic Devices Market, by Product, 2023-2030 (US$ Bn)
TABLE 103 Rest of Asia Pacific Orthopedic Prosthetic Devices Market, by Technology, 2017-2022 (US$ Bn)
TABLE 104 Rest of Asia Pacific Orthopedic Prosthetic Devices Market, by Technology, 2023-2030 (US$ Bn)
TABLE 105 Latin America Orthopedic Prosthetic Devices Market, by Product, 2017-2022 (US$ Bn)
TABLE 106 Latin America Orthopedic Prosthetic Devices Market, by Product, 2023-2030 (US$ Bn)
TABLE 107 Latin America Orthopedic Prosthetic Devices Market, by Technology, 2017-2022 (US$ Bn)
TABLE 108 Latin America Orthopedic Prosthetic Devices Market, by Technology, 2023-2030 (US$ Bn)
TABLE 109 Brazil Orthopedic Prosthetic Devices Market, by Product, 2017-2022 (US$ Bn)
TABLE 110 Brazil Orthopedic Prosthetic Devices Market, by Product, 2023-2030 (US$ Bn)
TABLE 111 Brazil Orthopedic Prosthetic Devices Market, by Technology, 2017-2022 (US$ Bn)
TABLE 112 Brazil Orthopedic Prosthetic Devices Market, by Technology, 2023-2030 (US$ Bn)
TABLE 113 Argentina Orthopedic Prosthetic Devices Market, by Product, 2017-2022 (US$ Bn)
TABLE 114 Argentina Orthopedic Prosthetic Devices Market, by Product, 2023-2030 (US$ Bn)
TABLE 115 Argentina Orthopedic Prosthetic Devices Market, by Technology, 2017-2022 (US$ Bn)
TABLE 116 Argentina Orthopedic Prosthetic Devices Market, by Technology, 2023-2030 (US$ Bn)
TABLE 117 Rest of Latin America Orthopedic Prosthetic Devices Market, by Product, 2017-2022 (US$ Bn)
TABLE 118 Rest of Latin America Orthopedic Prosthetic Devices Market, by Product, 2023-2030 (US$ Bn)
TABLE 119 Rest of Latin America Orthopedic Prosthetic Devices Market, by Technology, 2017-2022 (US$ Bn)
TABLE 120 Rest of Latin America Orthopedic Prosthetic Devices Market, by Technology, 2023-2030 (US$ Bn)
TABLE 121 Middle East and Africa Orthopedic Prosthetic Devices Market, by Product, 2017-2022 (US$ Bn)
TABLE 122 Middle East and Africa Orthopedic Prosthetic Devices Market, by Product, 2023-2030 (US$ Bn)
TABLE 123 Middle East and Africa Orthopedic Prosthetic Devices Market, by Technology, 2017-2022 (US$ Bn)
TABLE 124 Middle East and Africa Orthopedic Prosthetic Devices Market, by Technology, 2023-2030 (US$ Bn)
TABLE 125 GCC Countries Orthopedic Prosthetic Devices Market, by Product, 2017-2022 (US$ Bn)
TABLE 126 GCC Countries Orthopedic Prosthetic Devices Market, by Product, 2023-2030 (US$ Bn)
TABLE 127 GCC Countries Orthopedic Prosthetic Devices Market, by Technology, 2017-2022 (US$ Bn)
TABLE 128 GCC Countries Orthopedic Prosthetic Devices Market, by Technology, 2023-2030 (US$ Bn)
TABLE 129 South Africa Orthopedic Prosthetic Devices Market, by Product, 2017-2022 (US$ Bn)
TABLE 130 South Africa Orthopedic Prosthetic Devices Market, by Product, 2023-2030 (US$ Bn)
TABLE 131 South Africa Orthopedic Prosthetic Devices Market, by Technology, 2017-2022 (US$ Bn)
TABLE 132 South Africa Orthopedic Prosthetic Devices Market, by Technology, 2023-2030 (US$ Bn)
TABLE 133 Rest of Middle East and Africa Orthopedic Prosthetic Devices Market, by Product, 2017-2022 (US$ Bn)
TABLE 134 Rest of Middle East and Africa Orthopedic Prosthetic Devices Market, by Product, 2023-2030 (US$ Bn)
TABLE 135 Rest of Middle East and Africa Orthopedic Prosthetic Devices Market, by Technology, 2017-2022 (US$ Bn)
TABLE 136 Rest of Middle East and Africa Orthopedic Prosthetic Devices Market, by Technology, 2023-2030 (US$ Bn

Frequently Asked Questions:

How does COVID-19 impact the global osteoarthritis treatment market?

The COVID-19 pandemic has impacted the global osteoarthritis treatment market in various ways. While the supply chain and medicine manufacturing have been disrupted, the demand for osteoarthritis therapy has increased due to increased cases. The pandemic has also switched to telemedicine and online commerce, allowing businesses to increase their digital presence.

Which is the leading region of the market for osteoarthritis treatments?

North America accounted for the most heightened global osteoarthritis treatment market share.

What are the key drivers for the growth of the osteoarthritis treatment market?

The increasing prevalence of osteoarthritis, expanding elderly population, and growing initiatives by government and private organizations to create awareness of the disease and its management are the primary factors for the growth of the osteoarthritis treatment market.

Which is the major segment in the osteoarthritis treatment market by treatment type?

The analgesics segment had a major share in the global market in 2022.

Which is the major segment in the osteoarthritis treatment market by distribution channel?

The hospital pharmacies segment had a major share in the global market.

Cryotherapy Market

Published:
Report ID: 34531

Crohn’s Disease Treatment Market

Published:
Report ID: 34527

Angiographic Catheter Market

Published:
Report ID: 34520

Pharmacy Automation Market

Published:
Report ID: 9511

Bioactive Wound Care Market

Published:
Report ID: 2936

Primary Hepatocyte Market

Published:
Report ID: 34377

Neuropathic Pain Market

Published:
Report ID: 34373

Neurology Contract Research Organization Market

Published:
Report ID: 34365

Tamoxifen Market

Published:
Report ID: 10886

Autologous Conditioned Plasma (ACP) Market

Published:
Report ID: 34347

Insomnia Treatment Market

Published:
Report ID: 34343

Irritable Bowel Syndrome Treatment Market

Published:
Report ID: 34339

Purchase Options

$2999
Delivery Format: Excel.
$4999
Designed for the individual purchaser.
$6999
Users located at a single corporate site or regional office.
$7999
Allowed for unlimited sharing globally within one company.
Smallform of Sample request

Have a question?

User Profile

Don’t settle for less – trust Mitul to help you find the best solution.

Report delivery within 24 to 48 hours

– Other Info –

What people say?-

User Review

I am very impressed with the information in this report. The author clearly did their research when they came up with this product and it has already given me a lot of ideas.

Jana Schmidt
CEDAR CX Technologies

– Connect with us –

Phone

+91 6232 49 3207


support

24/7 Research Support


sales@credenceresearch.com

– Research Methodology –

Going beyond the basics: advanced techniques in research methodology

– Trusted By –

Pepshi, LG, Nestle
Motorola, Honeywell, Johnson and johnson
LG Chem, SIEMENS, Pfizer
Unilever, Samsonite, QIAGEN